

Crude oil closed the previous month above the barrier of $50 for the first time since February, which raised hopes for further improvement. Meanwhile, the commodity reversed and decline, invalidating the earlier breakouts above important resistance lines and levels. What does it man for black gold in broader perspective? Let’s jump right into the charts (charts courtesy of http://stockcharts.com) and try to find out what can we expect in the coming weeks.
Crude Oil
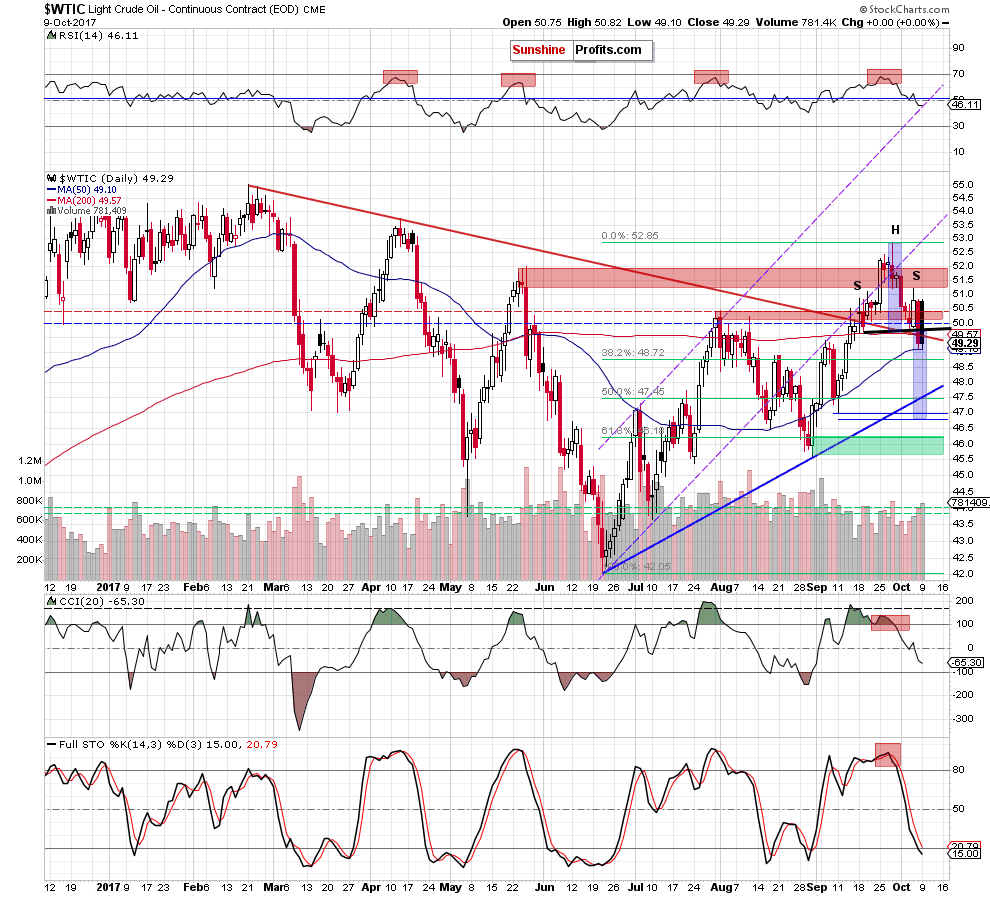
Looking at the daily chart, we see that although crude oil moved higher on Thursday, the red resistance zone created by the August peaks stopped further improvement, triggering a pullback. On Friday, black gold extended losses, which took the commodity not only below the barrier of $50, but also under the red declining line and the 200-day moving average, which resulted in an invalidation of the earlier breakouts above them.
On top of that, light crude declined under the black support line based on the recent lows, which confirmed the head and shoulders formation. What does it mean for black gold? In our opinion, the breakdown under the neck line of the pattern (which materialized on visibly higher volume than Thursday increase) suggests that we’ll see a decline to around $46.80-$47, where the size of the downward move will correspond to the height of the formation and where the September 11 low is.
Nevertheless, before we see the price of crude oil at $47, oil bears will have to push the commodity below the 38.2% Fibonacci retracement based on the June-September upward move (around $48.72), the short-term blue support line based on the June and August lows (currently around $47.45) and the 50% Fibonacci retracement.
Will they manage to do that? Taking into account the sell signals generated by the daily and weekly indicators, the size of volume during declines and the above-mentioned invalidations of the earlier breakouts above important lines and levels, we believe that lower prices of crude oil are more likely than not.
The pro bearish scenario is also reinforced by the medium-term picture of the commodity.
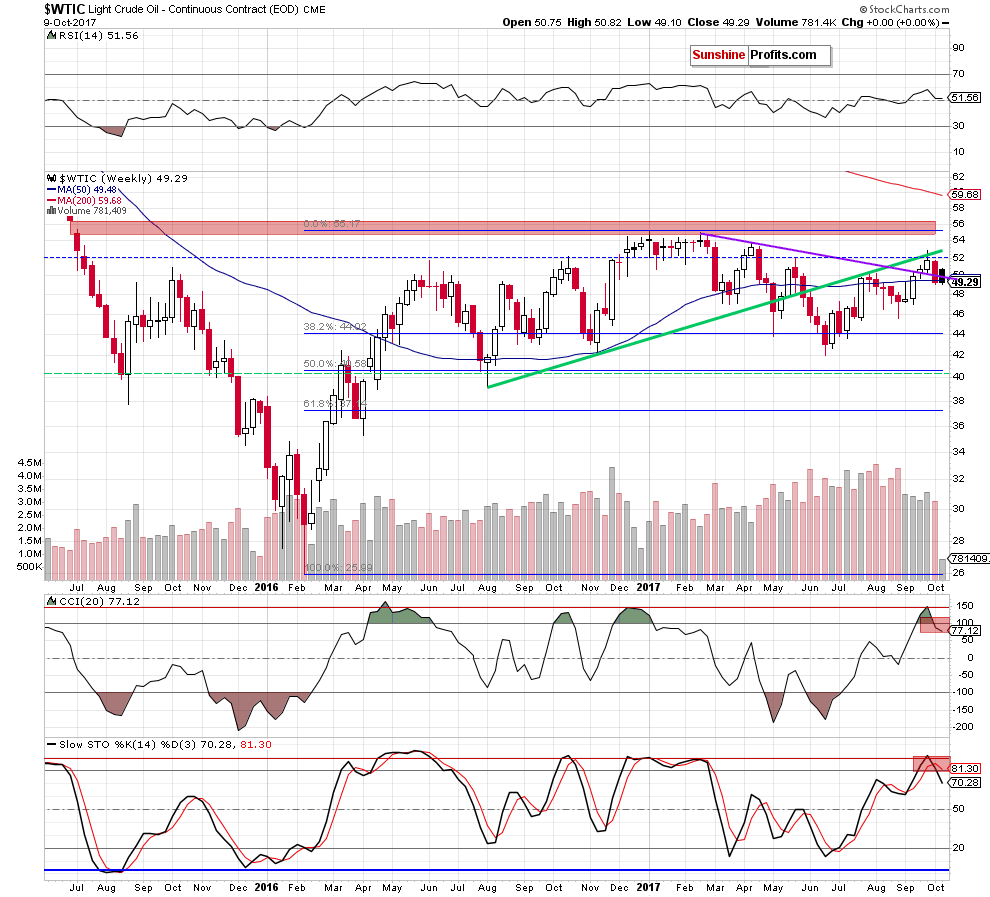
The first thing that catches the eye on the medium-term chart is an invalidation of the earlier breakout above the long-term purple declining line based on the February and April peaks (a bearish event). Additionally, thanks to the last week drop light crude closed Friday session below the 50-week moving average, invalidating earlier breakout, which is another bearish development.
On top of that, the CCI generated the sell signal (while the signal generated by the Stochastic Oscillator remain in cards), which together with the above-mentioned invalidations suggests further deterioration in the coming week.
How did this decline affect the long-term perspective? Let’s examine the monthly chart and find out.
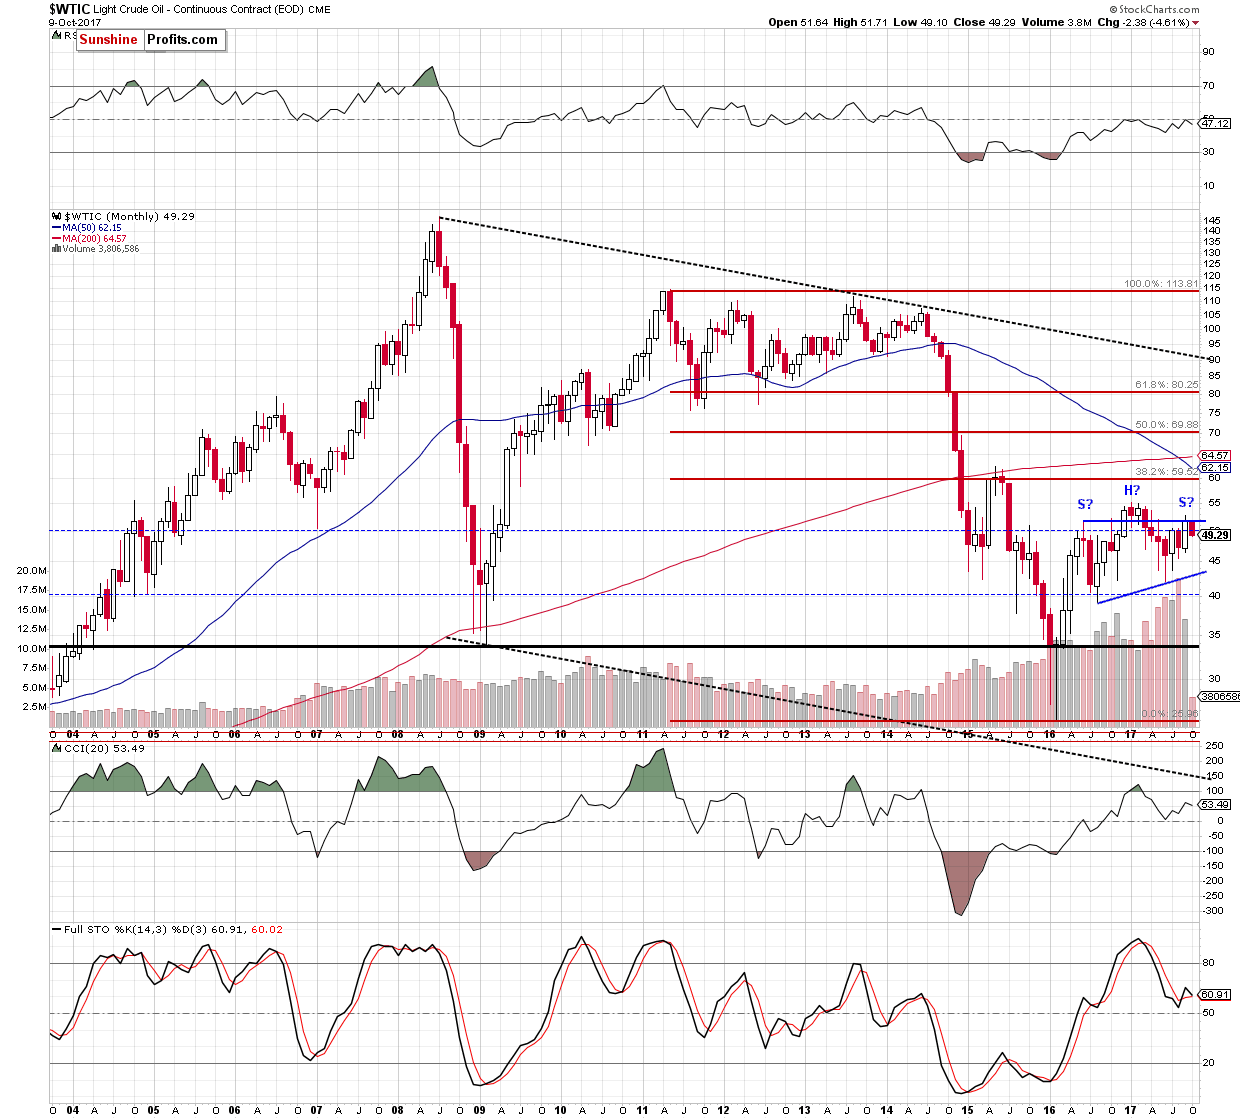
Looking at the monthly chart, we can notice a potential head and shoulders formation. Of course it will be more bearish and reliable only if crude oil falls below the neck line of the pattern (the blue support line based on the August 2016 and June 2017 lows around $43.20 at the moment of writing these words), but we think that oil bears will use all the above-mentioned negative events to create the right shoulder of the pattern in the following weeks.
Will the current situation in our interesting ratios confirm this pro bearish scenario? Let’s take a closer look at them and find out.
Ratio Analysis
Let’s start this section with the long-term chart of the oil-to-oil stocks chart.
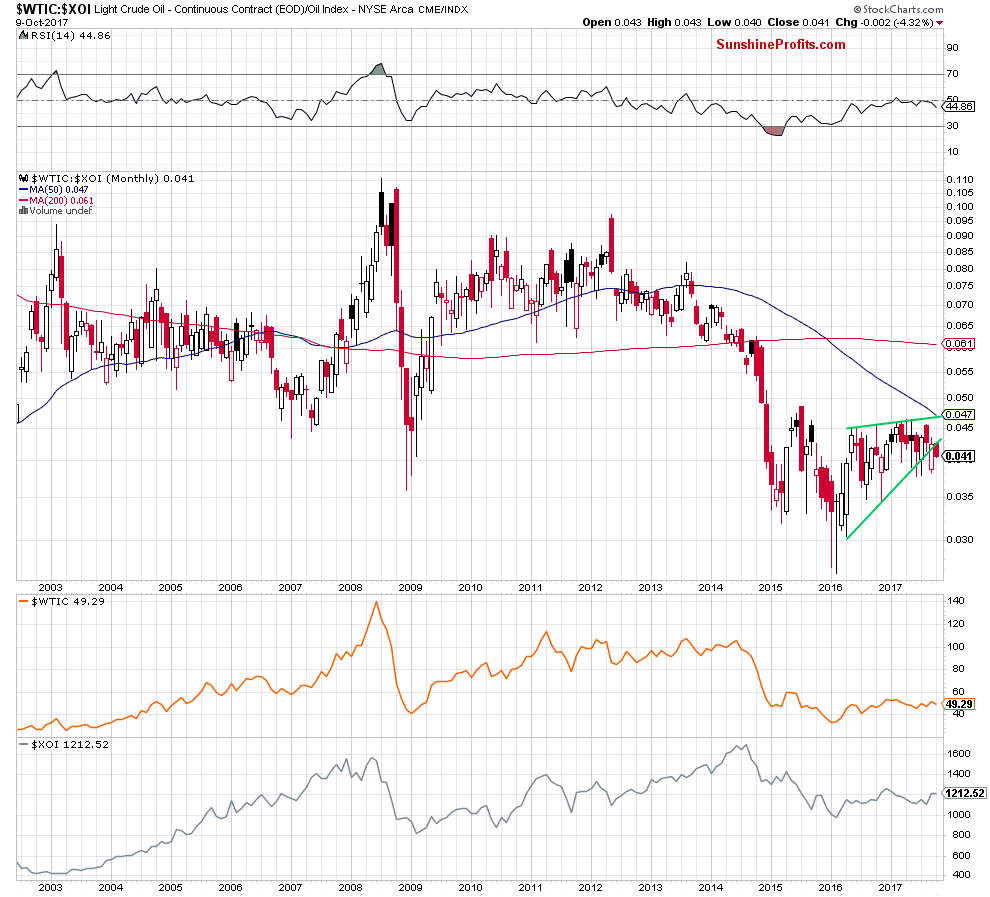
Looking at the monthly chart, we see that although the ratio invalidated the earlier breakdown below the lower border of the green wedge in the previous month, we didn’t see further improvement. Instead the ratio reversed and declined below this important support line, opening the way to lower levels.
But will we see further deterioration in the coming weeks? Let’s examine the weekly chart to find out.
From this perspective, we see that the long-term key resistance red zone stopped bulls once again, triggering a pullback in recent weeks – similarly to what we saw many times in the previous months.
As a result, the ratio declined not only below the 50-week moving average, but also slipped under the green support line, which together with the sell signals generated by the CCI and the Stochastic Oscillator suggests that we’ll likely see lower values of the ratio. If this is the case, the bears could test the May and Jun lows in the coming weeks.
What does it mean for light crude? On the above charts, we see that the positive correlation between the ratio and the black gold remain in place, suggesting that declines in the ratio will also have a negative impact on the price of the commodity.
Once we know the above, let’s focus on the relation between crude oil and precious metals. Let’s start with the long-term chart of the oil-to-gold ratio.
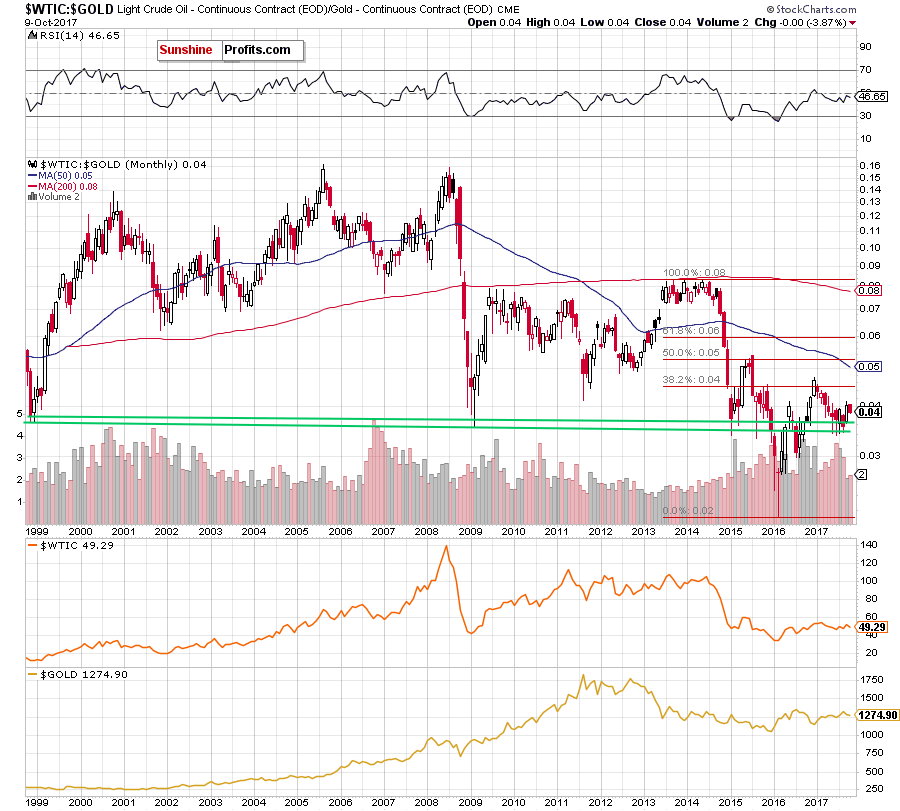
From the long-term perspective, we see that the ratio bounced off the long-term green support lines, which resulted in a rebound in September. Despite this improvement, bulls didn’t manage to push the ratio higher, which resulted in a reversal in the previous weeks.
How did this move affect the medium-term picture? Let’s take a look at the weekly chart.
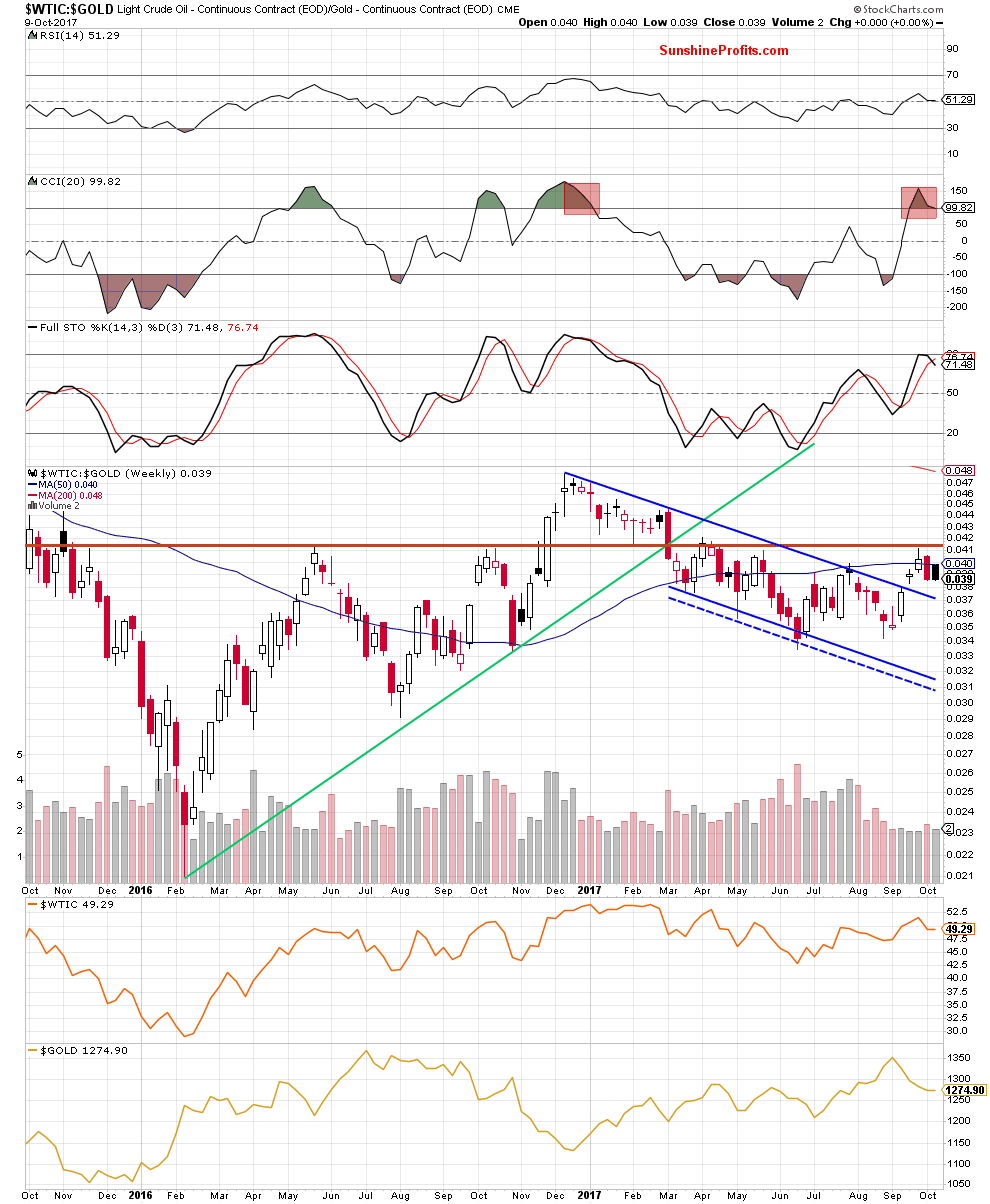
Looking at the above chart, we see that the last month’s upward move took the ratio to the red horizontal line. As you see, this resistance was strong enough to stop further improvement several times in the past, which encouraged bears to act. As a result, the ratio declined and slipped under the 50-week moving average, invalidating the earlier tiny breakout. Additionally, the CCI and the Stochastic Oscillator generated the sell signals, increasing the probability of declines in the following weeks.
How low could the ratio go? In our opinion, if we see declines from current levels, the initial downside target will be the previously-broken upper border of the blue declining trend channel. If this support is broken, the way to lower levels will be open – not only in the case of the oil-to-gold ratio, but also in the case of crude oil as positive correlation between the ratio and the commodity is still in cards.
Will the very short-term chart confirm the pro- bearish scenario?
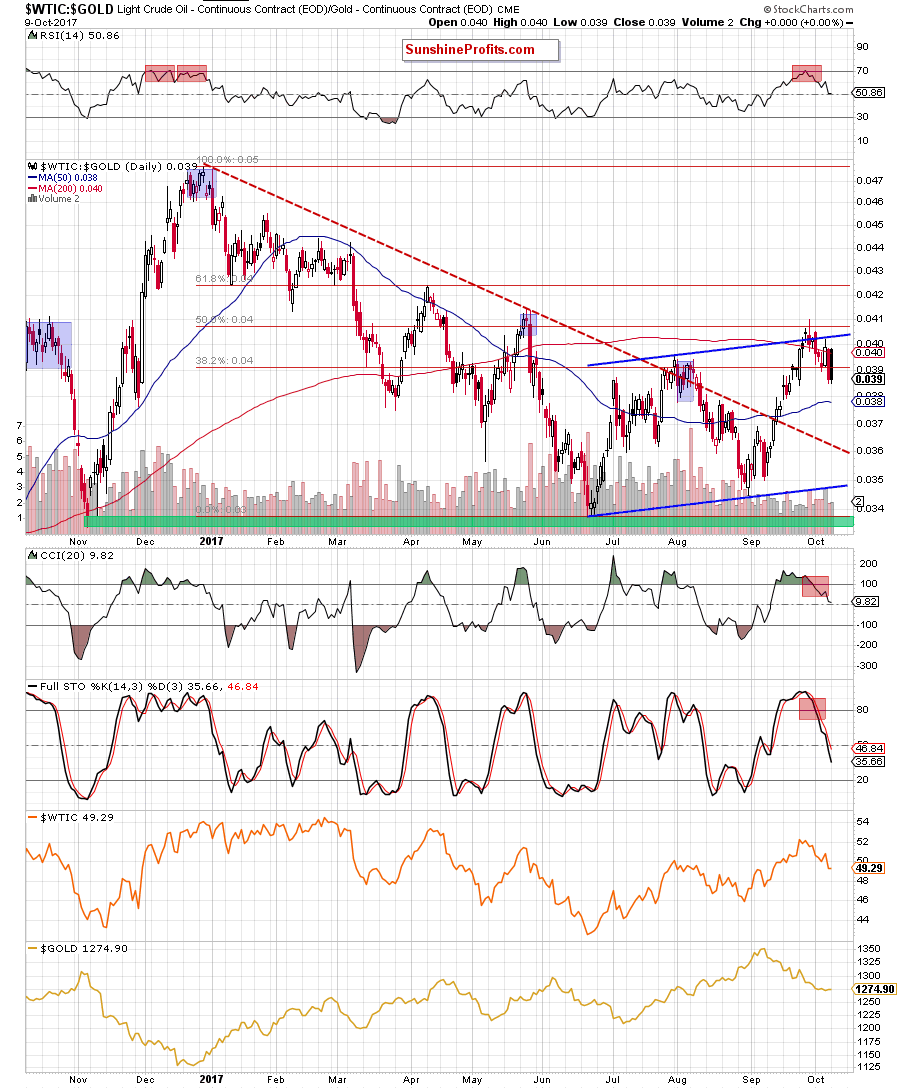
The first thing that catches the eye on the daily chart is an invalidation of the breakout not only above the 50% Fibonacci retracement, but also above the upper border of the blue rising trend channel, the 200-day moving average and the August highs. Taking these bearish developments into account and combining them with the sell signals generated by the indicators, we believe that further deterioration is very likely, which increases the probability of lower prices of crude oil in the coming days.
This pro-bearish scenario is also reinforced by the current situation in the oil-to-silver ratio.
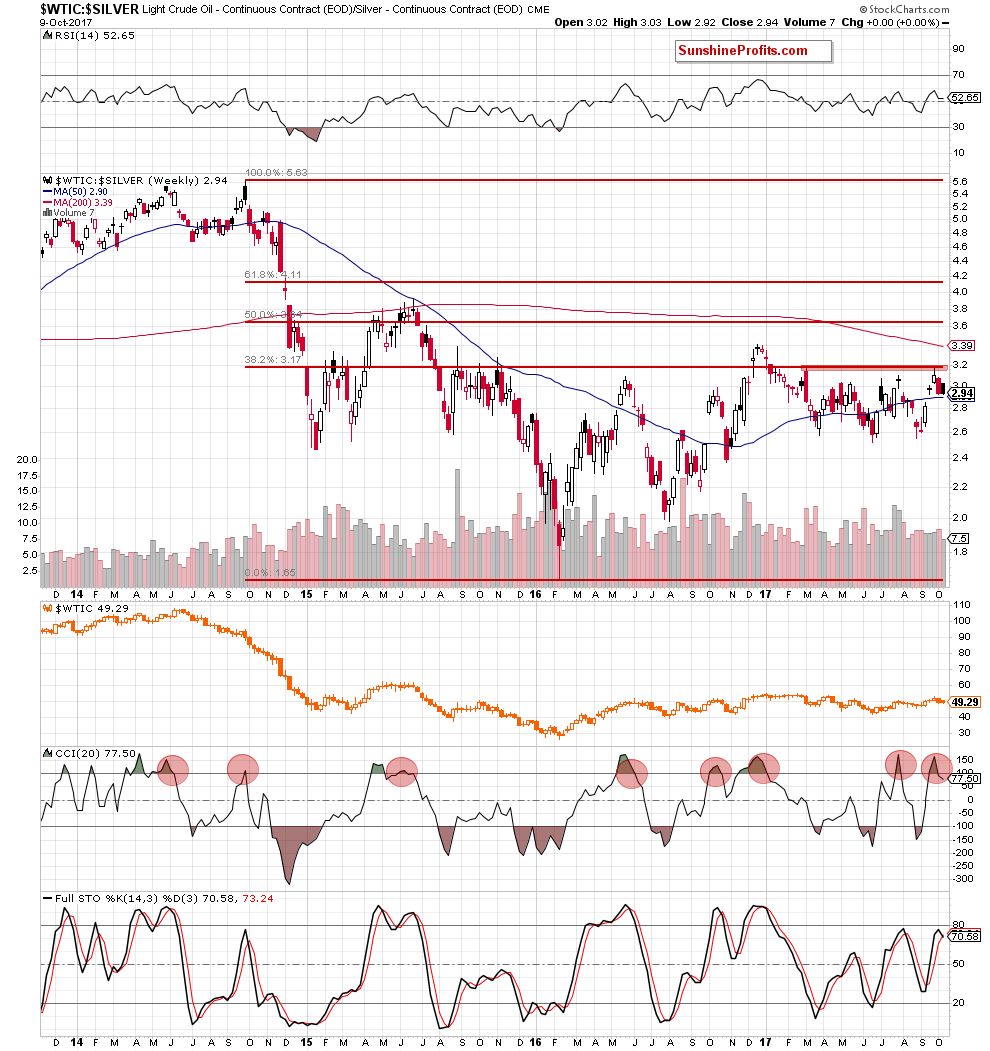
As you see on the weekly chart, the red resistance zone created by the previous 2017 peaks and the 38.2% Fibonacci retracement stopped further improvement at the end of September. Thanks to these circumstances, the ratio declined and the CCI dropped under 100, generating the sell signal.
When we take a closer look at this chart, we see that in most of the previous cases, such price action preceded bigger downward moves, which suggests that we may see further deterioration in the following weeks.
On top of that, the ratio invalidated the earlier tiny breakout above the red resistance zone, the 61.8% Fibonacci retracement and the upper border of the black rising trend channel marked on the daily chart below.
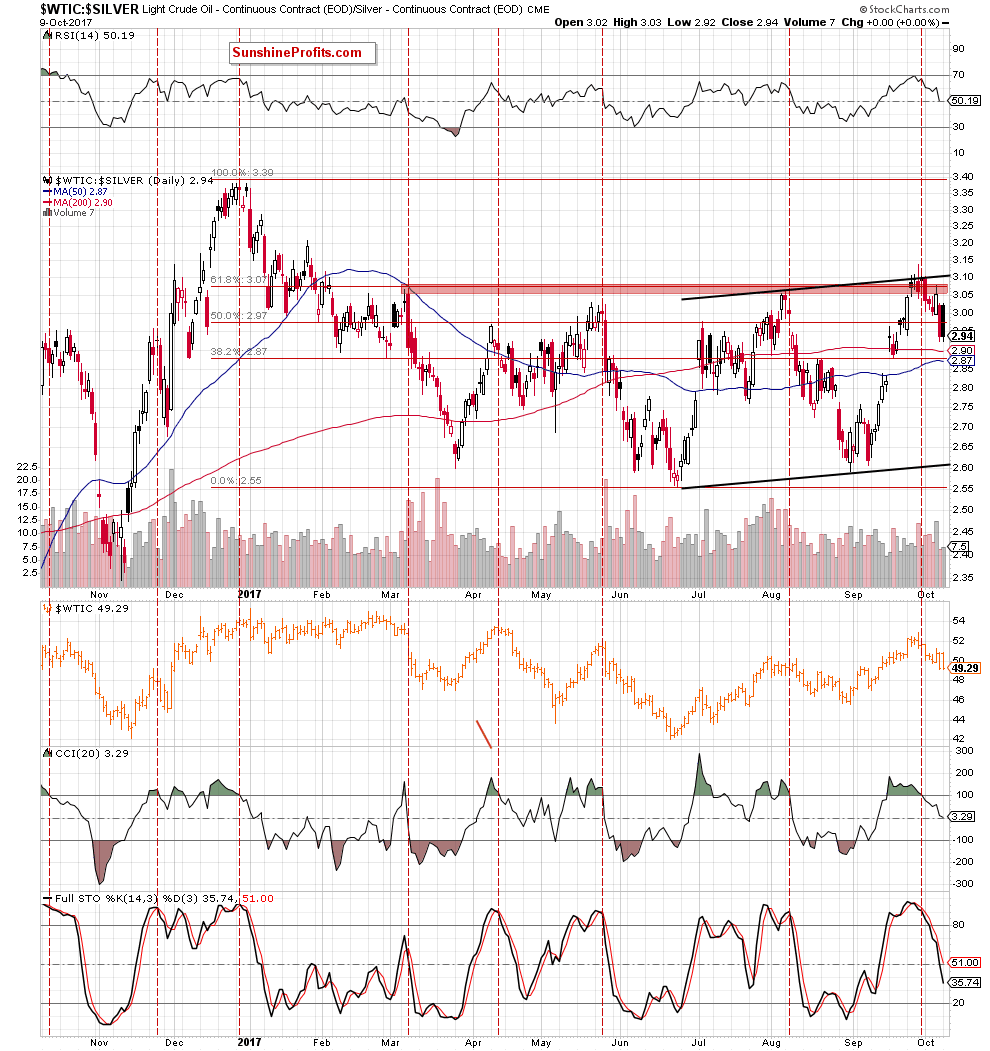
Additionally, all daily indicators generated the sell signals, supporting bears and lower values of the ratio.
What does it mean for crude oil? Just like we wrote in the case of the oil-to-gold ratio, we believe that further deterioration in the ratio will encourage oil bears to act and bring lower prices of black gold in the coming weeks.
Will the oil-to-stocks ratio give oil bears another reason to act? Let’s check.
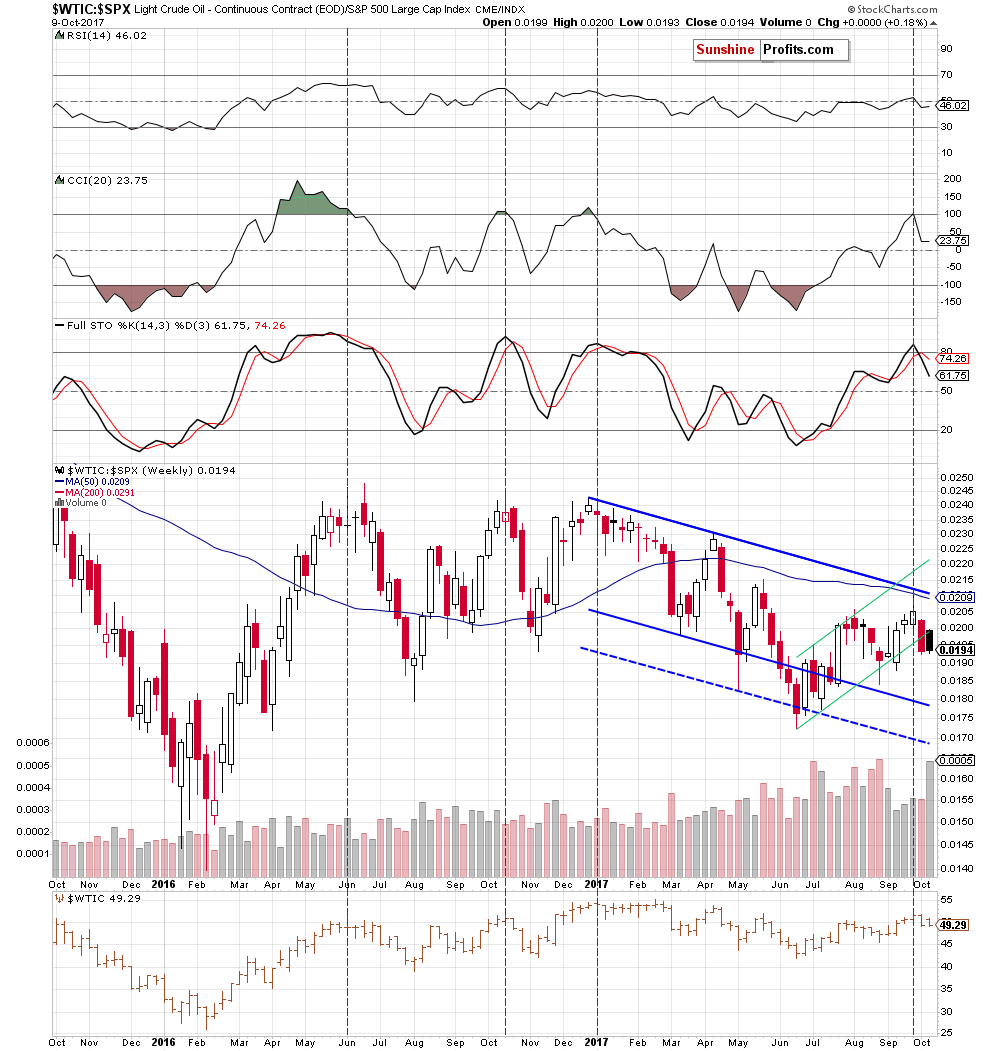
Looking at the weekly chart, we see that although the ratio moved higher, it climbed to the very important resistances at the end of the previous month – the upper border of the blue declining trend channel and the 50-week moving average, which together stopped bulls and triggered a reversal.
Thanks to this drop the ratio and crude oil moved lower, which means that further declines will also affect negatively the price of black gold. Will we see such price action? Taking into account the sell signals generated by the indicators and their impact on declines in the past (we marked them on the chart with the red vertical dashed lines), we think that another move to the downside is just around the corner.
Finishing this section let’s focus on the non-USD (WTIC:UDN ratio) chart of crude oil. As a reminder, UDN is the symbol for the PowerShares DB US Dollar Index Bearish Fund, which moves in the exact opposite direction to the USD Index. Since the USD Index is a weighted average of the dollar's exchange rates with world's most important currencies, the WTIC:UDN ratio displays the value of crude oil priced in "other currencies".
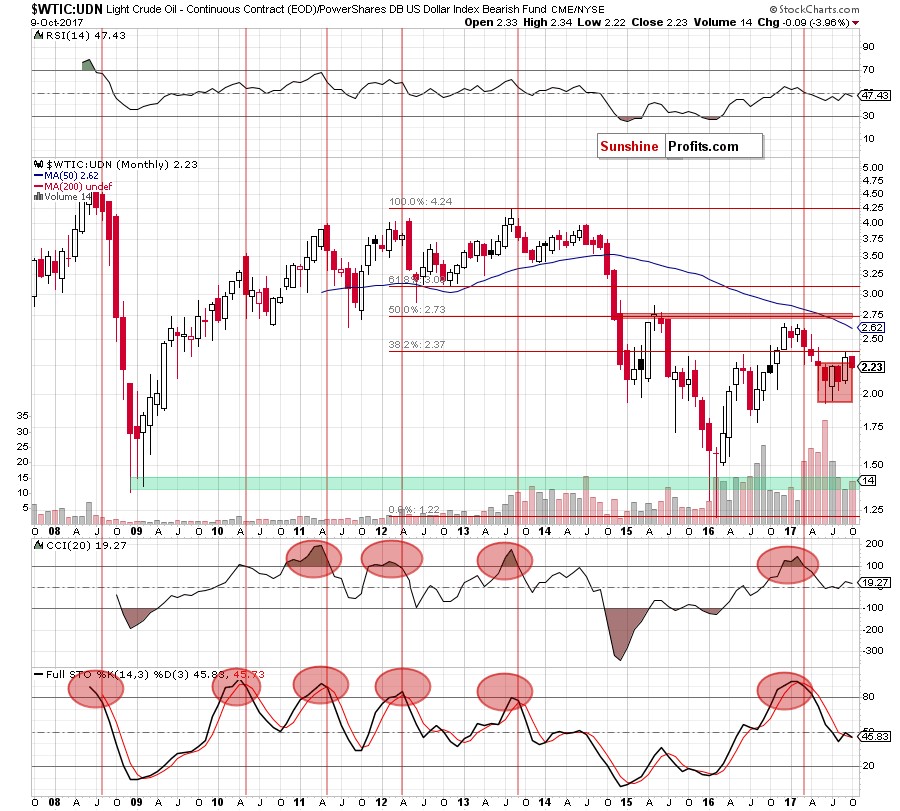
Looking at the long-term chart, we see that although the ratio broke above the upper border of the red consolidation in the previous month, the 38.2% Fibonacci retracement stopped oil bulls, triggering a pullback at the end of October. Thanks to this negative development, the ratio came back to the consolidation, invalidating the earlier small breakout.
Taking this fact into account and combining it with the sell signals generated by the monthly indicators (they continue to support oil bears since several months), we think that lower prices of crude oil are still ahead of us – especially when we factor in the medium-term picture.
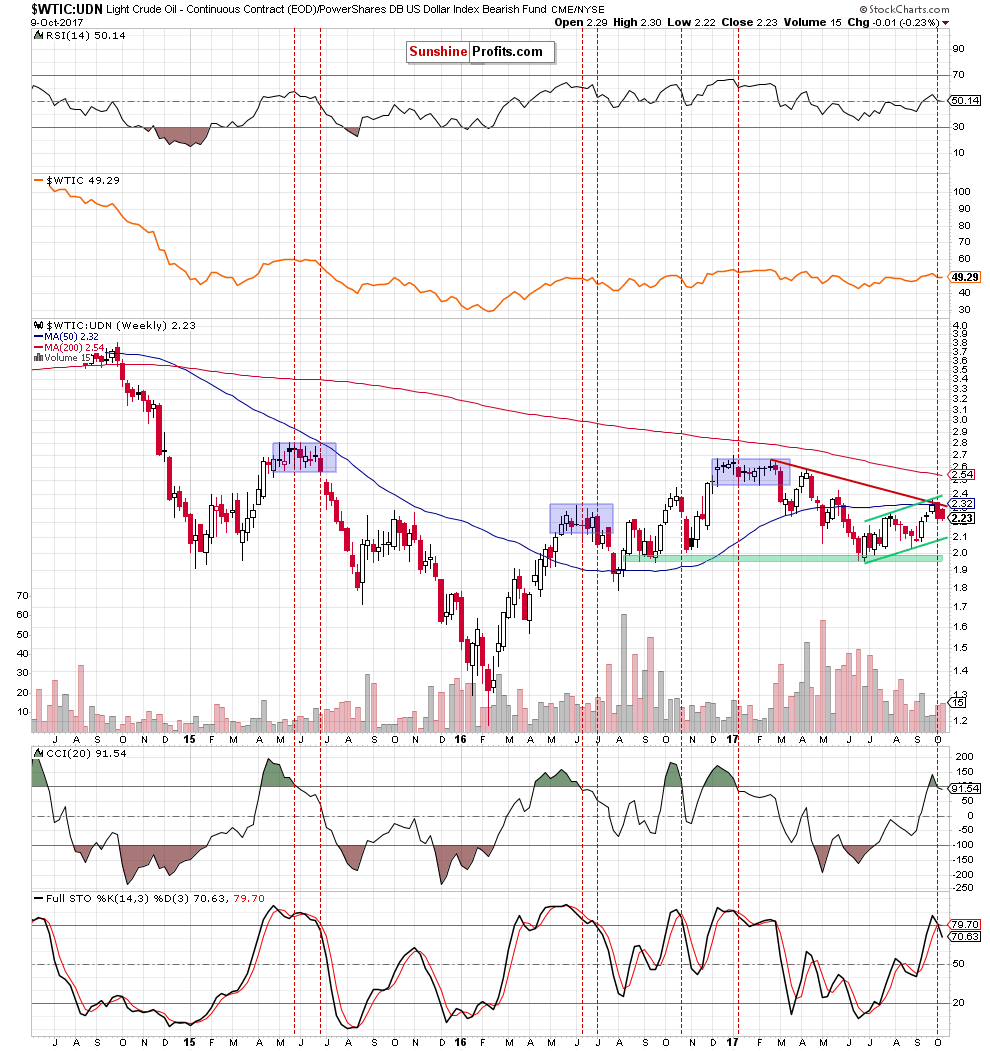
On the weekly chart, we see that the combination of the red declining resistance line based on February and April highs, the 50-week moving average and the upper border of the green rising trend channel stopped oil bulls and encouraged their opponents to act. Additionally, the CCI and the Stochastic Oscillator generated the sell signals, increasing the probability of further declines in the coming week(s).
Why? As you see on the chart, many times in the past the sell signals generated by the medium-term indicators preceded bigger downward moves (or even huge – just like in 2015 or earlier this year), which suggests that the history will likely repeat itself once again and we’ll see another move to the downside later in October.
This scenario is also reinforced by the very short-term picture of the ratio.
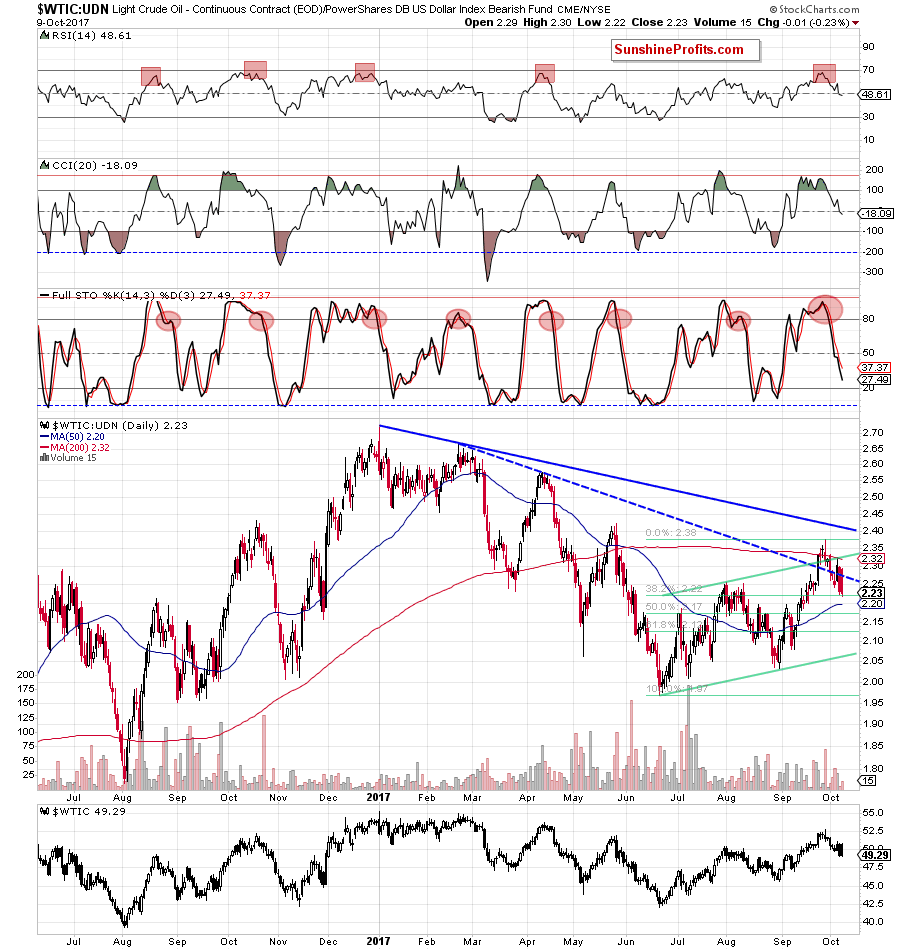
From this perspective, we see that the ratio invalidated the earlier breakout above the 200-day moving average, the blue dashed resistance line and the upper border of the green rising trend channel, which suggests lower prices in the coming week – especially when we take into account the sell signals generated by the indicators, which support oil bears.
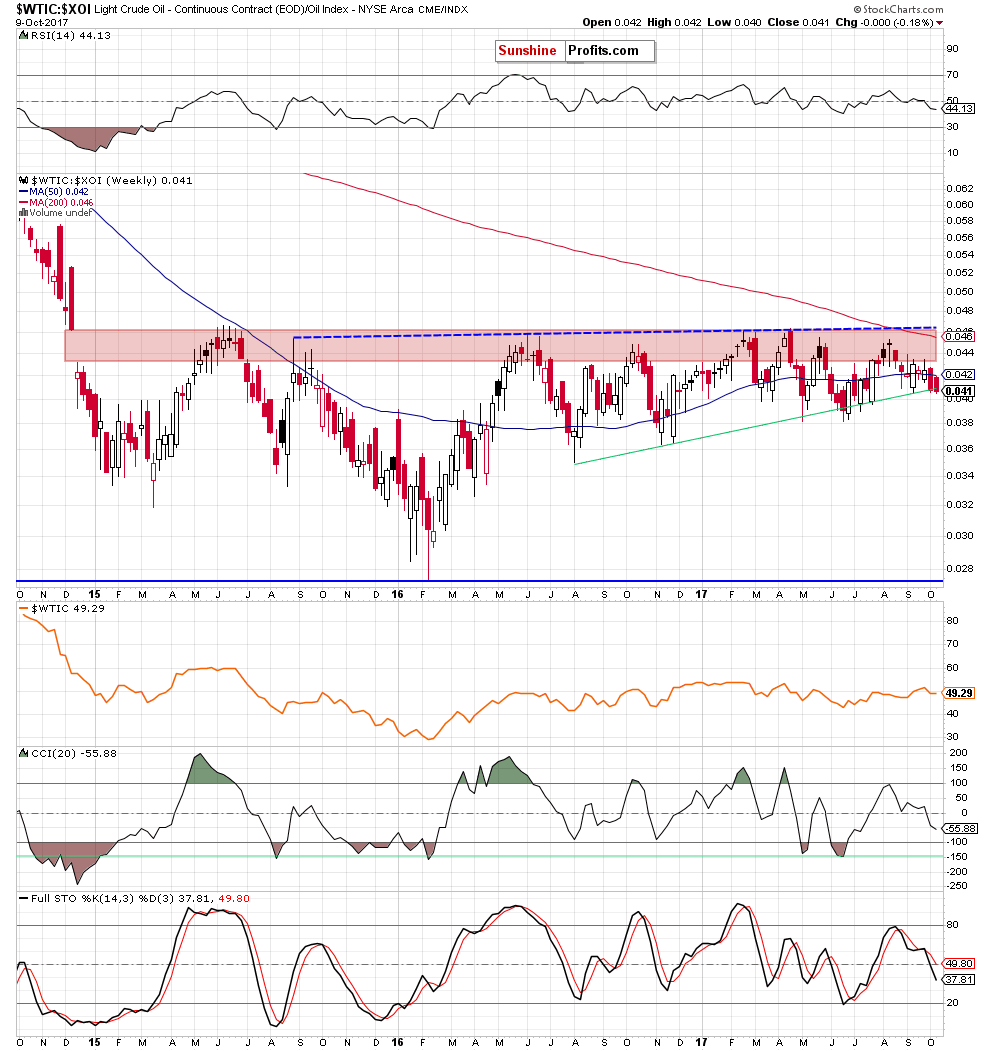
Finishing this month’s Oil Investment Update let’s examine the NYSE Arca Oil Index (XOI) to find out what the current outlook for oil stocks is.
Oil Stocks
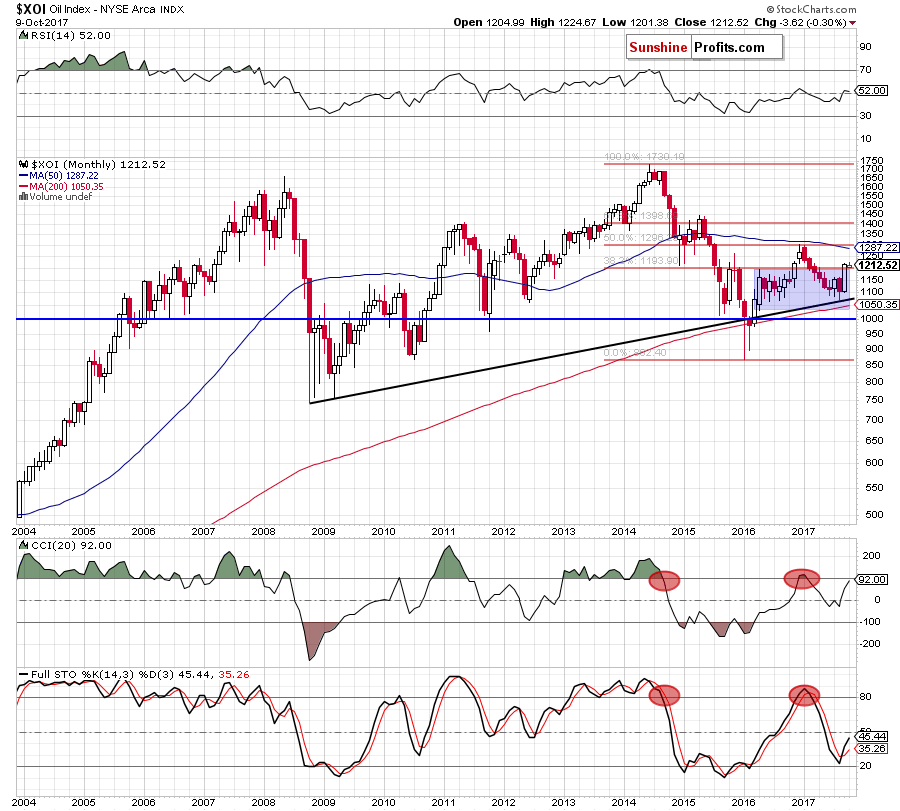
Looking at the long-term chart, we see that oil stocks moved higher in the previous month and broke above the upper border of the blue consolidation, which is a positive development – especially when we factor in the buy signal generated by the Stochastic Oscillator.
But will we see further improvement in the coming month? Let’s examine the charts below and find out.
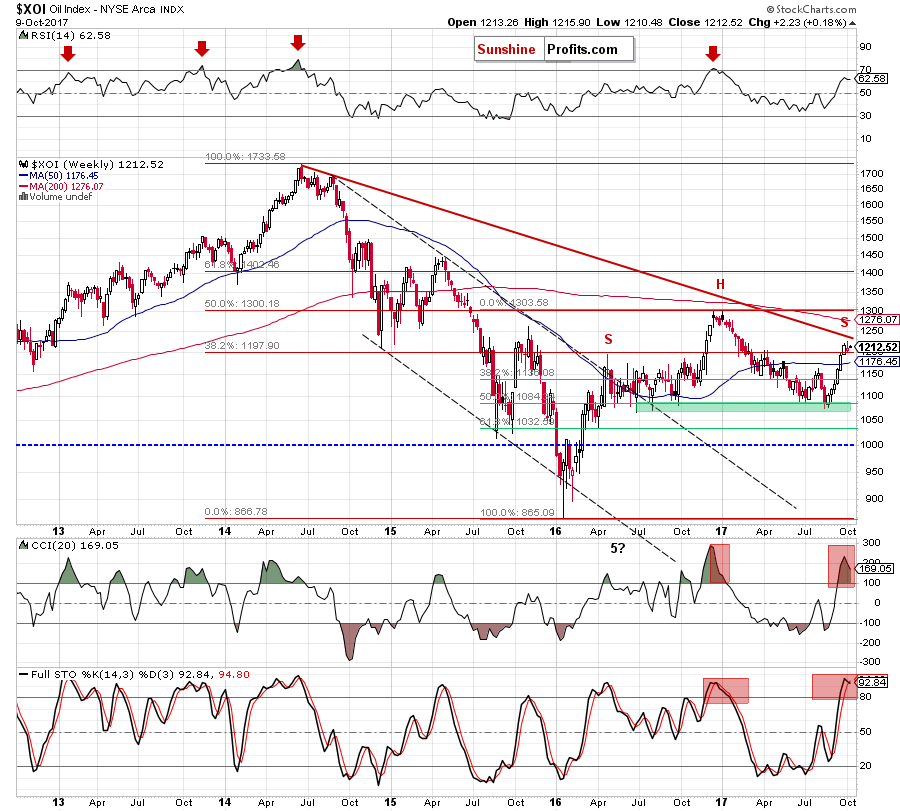
From the medium-term perspective, we see that although the XOI extended gains in recent weeks, the index is still trading under the long-term red declining resistance line based on the 2014 highs. This fact together with the current position of the indicators (the CCI climbed to the highest level since December 2016 and the Stochastic Oscillator generated a sell signal) suggests that the space for gains may be limited and reversal in October should not surprise us.
Additionally, when we take a look at the above chart we can notice a potential head and shoulders formation. Of course it will be confirmed only if oil bears push oil stocks below the green support zone, but (similarly to what we wrote in the case of crude oil) taking into account the above-mentioned negative signs and the sell signals generated by the daily indicators (marked on the chart below), we think that oil bears will use them to push the XOI lower and create the right shoulder of the formation in the coming weeks.
How low could the index go in October?
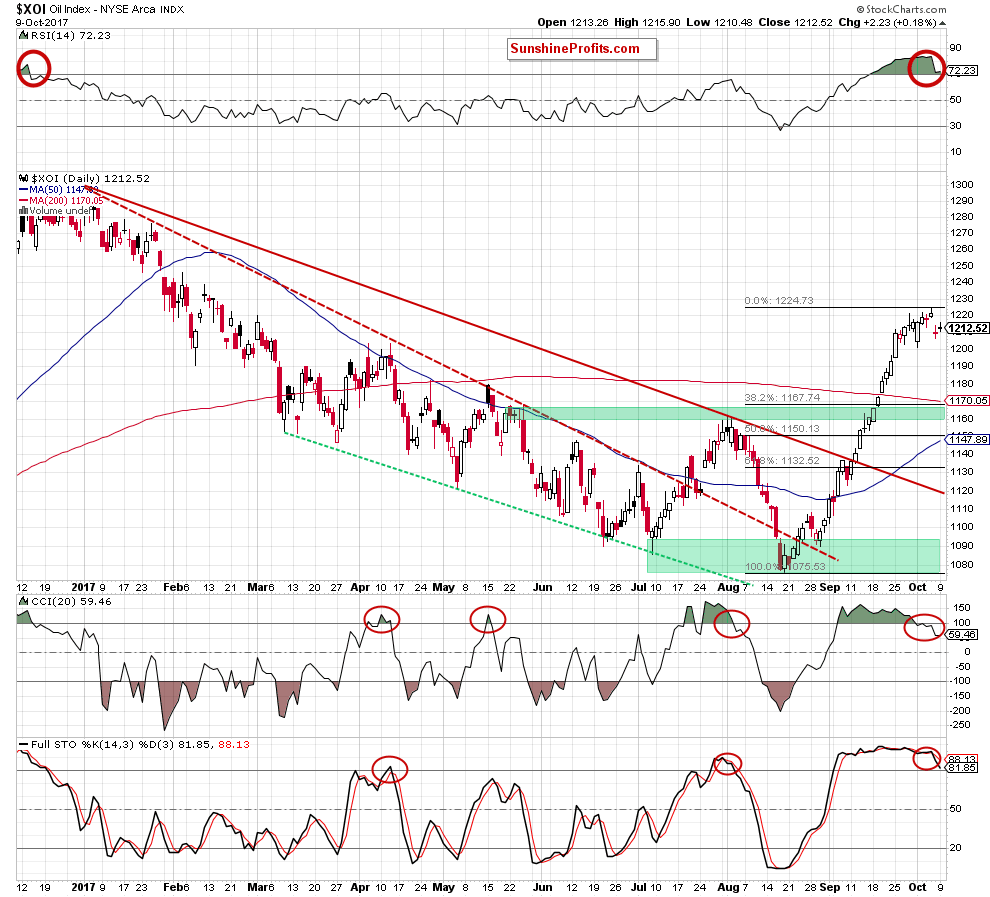
In our opinion, if oil stocks move lower from today’s levels, the initial downside target will be around 1,160-1,170, where the previously-broken 200-day moving average, the 38.2% Fibonacci retracement and the May and August peaks are (the green support zone).
Scenarios
Just like a month ago, today’s Oil Investment Update includes scenarios of what could happen in the coming weeks. Naturally, we will continue to monitor the market in the coming days and if anything invalidates our long-term outlook we will send you an additional message.
- Bullish scenario
If crude oil increases and invalidates the breakout below the neck line of the head and shoulders formation, we may see an increase to the red resistance zone created by the May highs (around $51.25-$52). If oil bulls break above it, we’ll likely see a test of the September high of $52.86 or even April highs (around $53.08-$53.76). However, if they manage to push the pair higher, the next upside target will be around $54.44-$55.03, where the February peaks are. - Bearish scenario
If the commodity extends losses the first downside target will be the 38.2% Fibonacci retracement (based on the entire June-September upward move) at $48.72 and then the 50% retracement and the blue support line based on the June and August lows (around $47.50). If these supports are broken, we’ll see a test of the green support zone (created by the 61.8% Fibonacci retracement and the August lows) seen on the daily chart of crude oil. If it is broken, the next downside target will be the July low of $43.65 or even the June 21 low of $42.05.
Summary
While it’s possible that we will see a corrective upswing in the coming days, it seems much more likely that crude oil will move lower in the coming weeks as the major resistance lines (the long-term green line based on August and November 2016 lows seen on the weekly chart of crude oil, the long-term red declining resistance line based on February and April highs seen on the weekly chart of wtic:udn ratio, the red resistance zone marked on the weekly and daily charts of the oil-to-silver ratio) and several other short-term resistance zones (in crude oil and the above-mentioned ratios) continue to support oil bears. Additionally, the medium-term indicators generated the sell signals, suggesting lower prices of crude oil in October.
This completes this month’s Oil Investment Update. Our next Oil Investment Update is scheduled for November 6, 2017. Oil Trading Alerts subscribers will additionally receive similar but shorter alerts on a daily basis (or more than once a day when the situation requires it). You – Oil Investment Updates subscribers – will receive short Investment Alert messages should the outlook for the medium or long term change before the next Update is posted.
Thank you.
Nadia Simmons
Forex & Oil Trading Strategist
Oil Investment Updates
Oil Trading Alerts

