

This month’s Oil Investment Update we begin with the words that we used to summarize the situation in the previous update (on June 5, 2017). We summarized the situation in the following way:
(…) the price of crude oil reversed and declined, invalidating the earlier breakout above the barrier of $50, the 50 and 200-day moving averages and the long-term green line based on the August and November lows. Such combination of negative factors together with the current situation in all of our above-mentioned ratios suggests further deterioration in the coming weeks – especially when we factor in the fact that the size of volume was rising during declines, indicating that oil bears are getting stronger. If this is the case, we’ll likely see a re-test of the strength of the lower border of the red declining trend channel in the coming week. If it holds, light crude could rebound slightly (…)
Looking at the price of crude oil from today’s point of view, we see that the situation developed in line with this scenario and the commodity not only reached our downside target, but also slipped slightly below it, hitting a fresh 2017 low. After this event, the black gold rebounded, but then pulled back, invalidating the earlier breakout and the key question at the moment is: will we see further deterioration or rather the bulls will take control and push the price to the barrier of $50 or higher? Let’s jump right into the charts (charts courtesy of http://stockcharts.com) and try to find an answer to this important question.
Crude Oil
In our previous Oil Investment Update, we wrote the following:
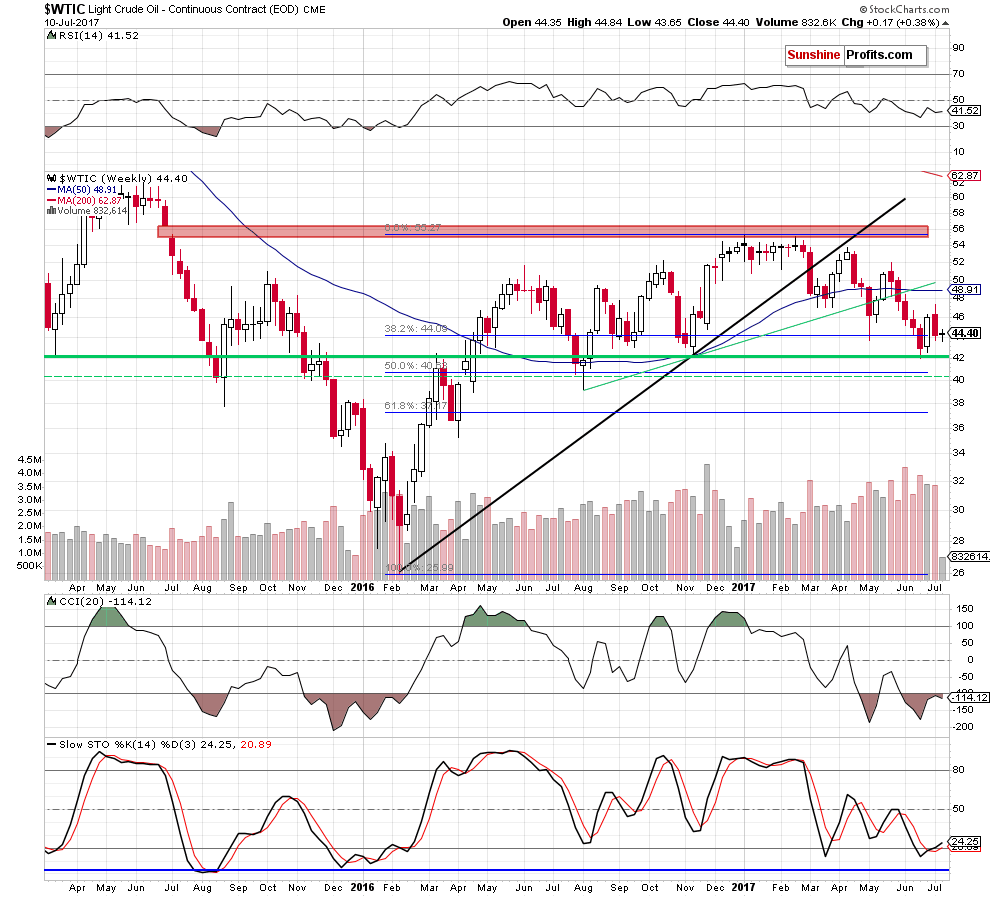
(…) crude oil broke below the green support line based on the August and November lows and closed the week below it, which is a negative event, which could trigger an acceleration of declines and a re-test of the strength of the 38.2% Fibonacci retracement based on the entire February-January upward move in the coming week(s).
Looking at the medium-term chart, we see that the situation developed in line with the above scenario and crude oil not only reached the 38.2% Fibonacci retracement, but also slipped below it, reaching the mid-November low. As you see, this area triggered a rebound, which took light crude above $46 in the previous week. Despite this improvement, the commodity gave up some gains and re-tested the strength of the Fibonacci retracement earlier this week.
Will it withstand the selling pressure in the coming days? Let’s take a closer look at the daily chart and try to find the answer to this question.
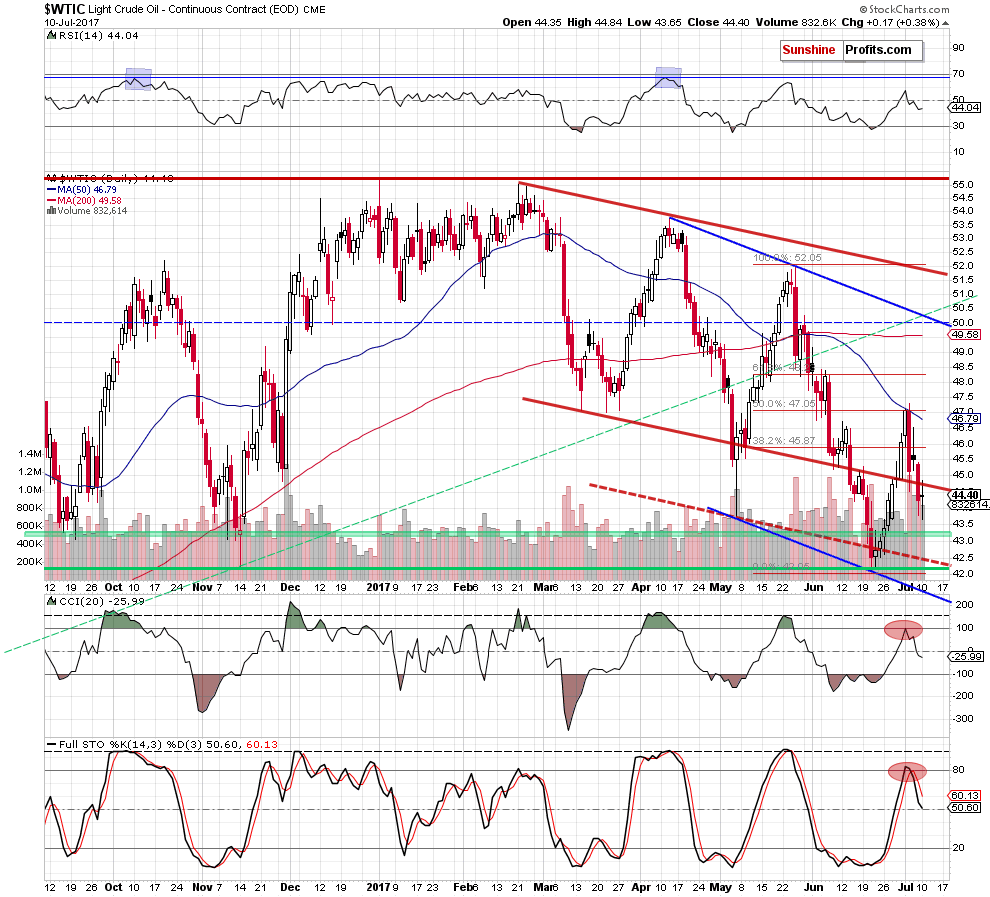
Looking at the daily chart, we see that the combination of the 50% Fibonacci retracement and the 50-day moving average stopped oil bulls, triggering a sharp pullback. On Friday, crude oil extended losses and closed session under the previously-broken lower border of the red declining trend channel, invalidating the earlier breakout, which was a bearish development.
Additionally, the CCI and the Stochastic Oscillator generated the sell signals, which suggest further deterioration in the coming week. Nevertheless, yesterday, oil bulls pushed the black gold to the lower border of the red declining trend channel. Despite this move, they didn’t manage to hold light crude above this line, which resulted in a pullback and a daily closure below this resistance.
What does yesterday’s price action mean for crude oil? In our opinion, such price action looks like a verification of the earlier breakdown, which suggests further deterioration in the following days. If this is the case and light crude declines from yesterday’s levels, we’ll likely see a test the green support zone (or even the recent lows) in the coming week.
Finishing this section, let’s zoom out our picture and take a closer look at the long-term chart. What can we infer from it?
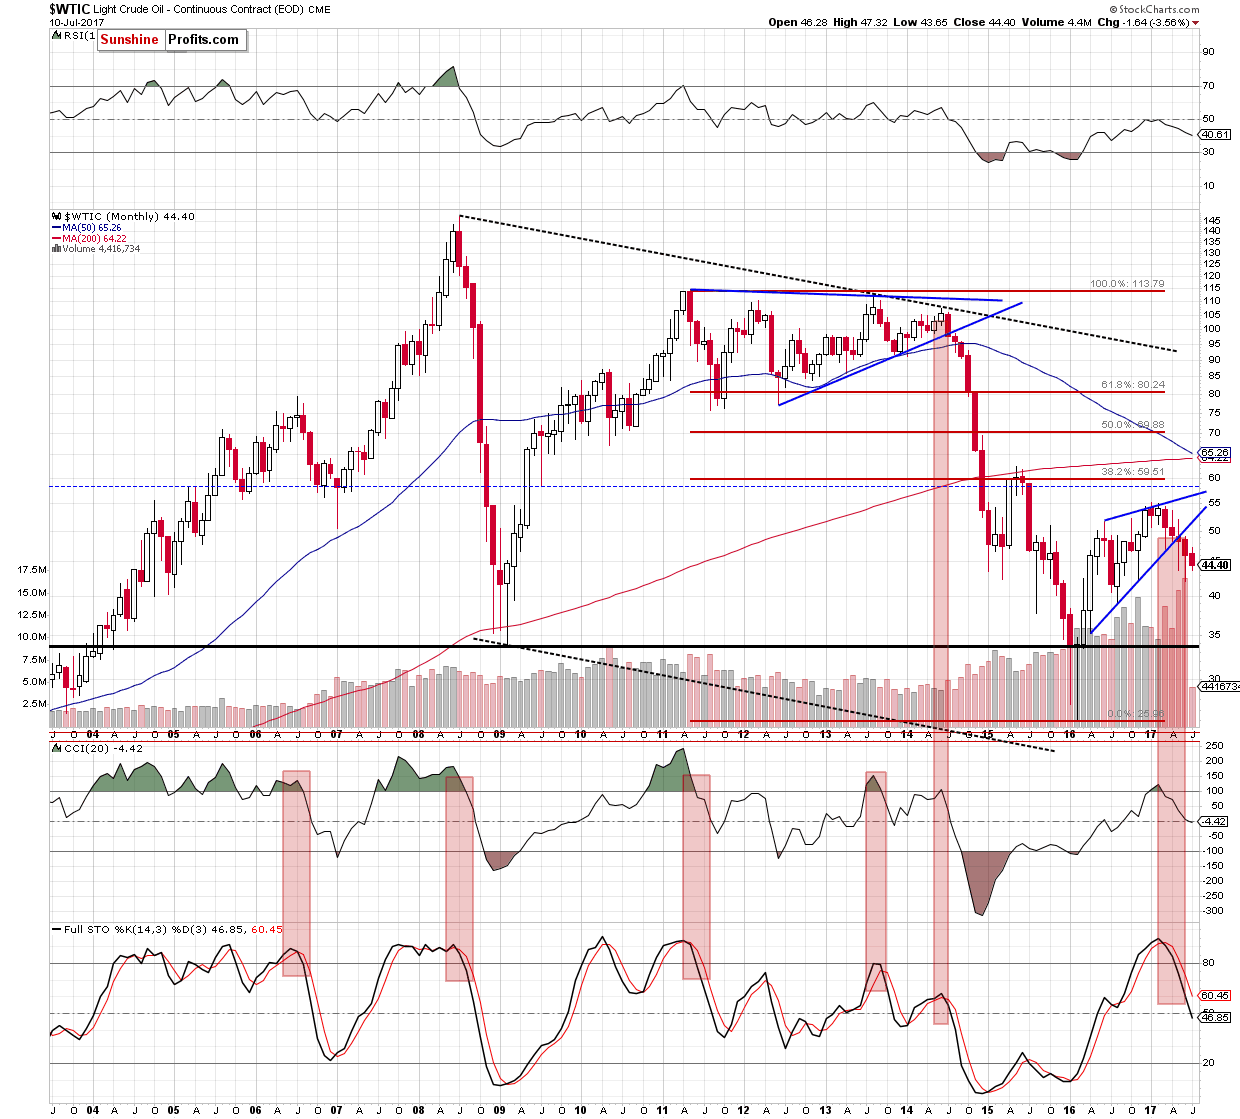
Looking at the monthly chart, we see that the overall situation hasn’t changed much since our previous commentary as crude oil remains between the last week high and low. Therefore what we wrote in June remains up-to-date also today:
(…) crude oil closed May under the previously-broken lower border of the rising wedge, which doesn’t bode well for oil bulls – especially when we factor in the sell signals generated by the indicators.
At this point, it is worth noting that the long-term sell signals together with the breakdown under the blue support line (the lower border of the blue triangle) preceded huge declines in 2014, which increases the probability of further deterioration in the coming weeks – even if we see a short-term (and short-lived) rebounds.
Having said the above, let’s examine the current situation in our interesting ratios. What can we infer from them?
Ratio Analysis
Quoting our last Oil Investment Update:
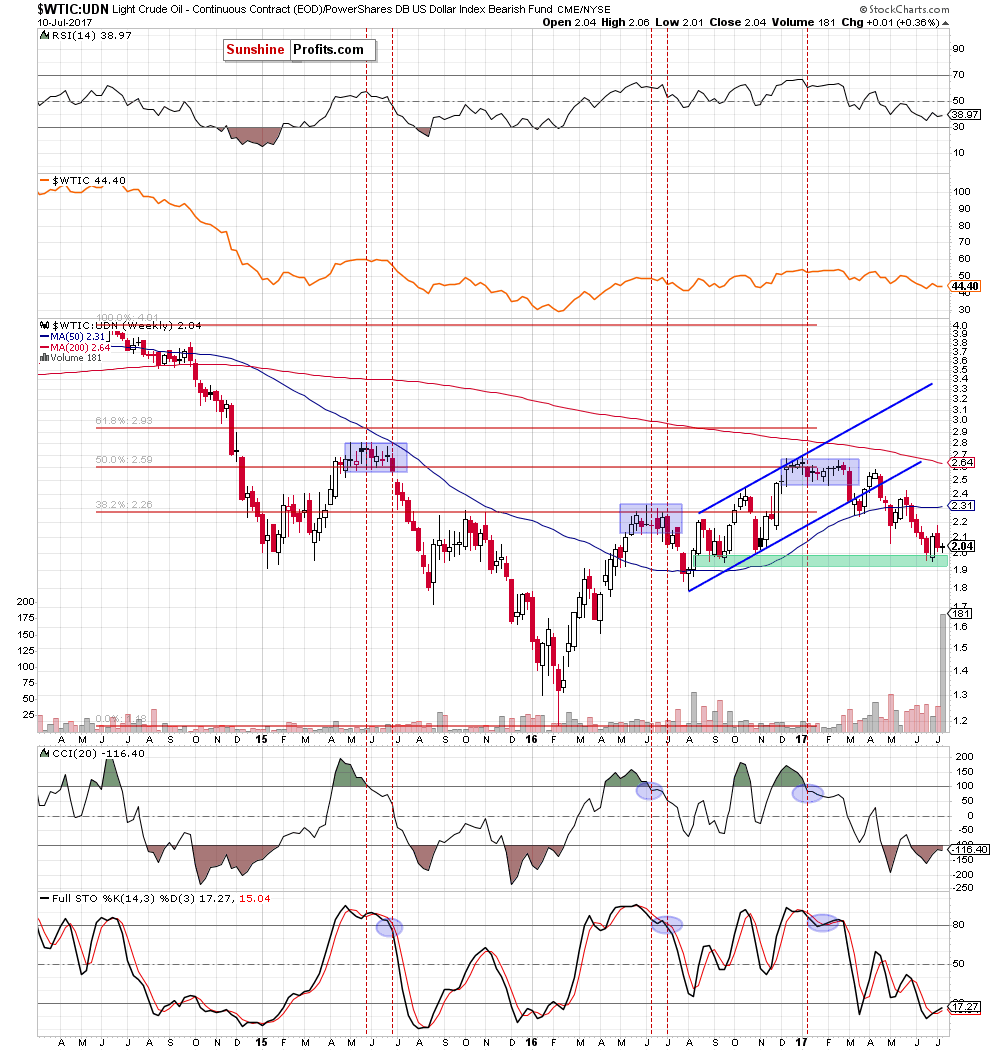
(…) although the ratio moved higher in the previous weeks, the combination of the key red resistance zone and the blue dashed line based on the previous highs stopped oil bulls once again. As a result, the ratio reversed and declined last week, which resulted in a comeback to the previously-broken 50-week moving average.
What’s next? Although this support could trigger a rebound, we clearly see that in all previous similar situations it wasn’t strong enough to stop oil bears for longer. Therefore, in our opinion, further declines are just around the corner. If this is the case and the ratio extends losses, the initial downside target for the bears will be around 0.0390, where the long-term green support line is.
Looking at the above chart, we see that the ratio extended losses (as we had expected) and slipped slightly below our downside target. Despite this drop, oil bulls managed to stop further deterioration and pushed the ratio above the long-term green support line, invalidating the earlier breakdown.
This positive event triggered further increases, but the key red resistance zone stopped the rally once again. Thanks to the recent price action, we saw a repeat of what we saw in June, which suggests a re-test of the green line or even the recent low.
What does it mean for crude oil? The positive correlation between the ratio and crude oil remain in place, which means that declines in the ratio will likely translate into lower prices of crude oil in the coming week(s). Nevertheless, in our opinion, a sizable move to the downside (in the case of the ratio and the black gold) will be more likely and reliable only if we see a weekly closure under the long-term green support line. Until this time, another rebound and an increase to the key red resistance zone is likely (similarly to what in many cases in the past year).
Once we know the relationship between oil and oil stocks let’s examine the oil-gold link.
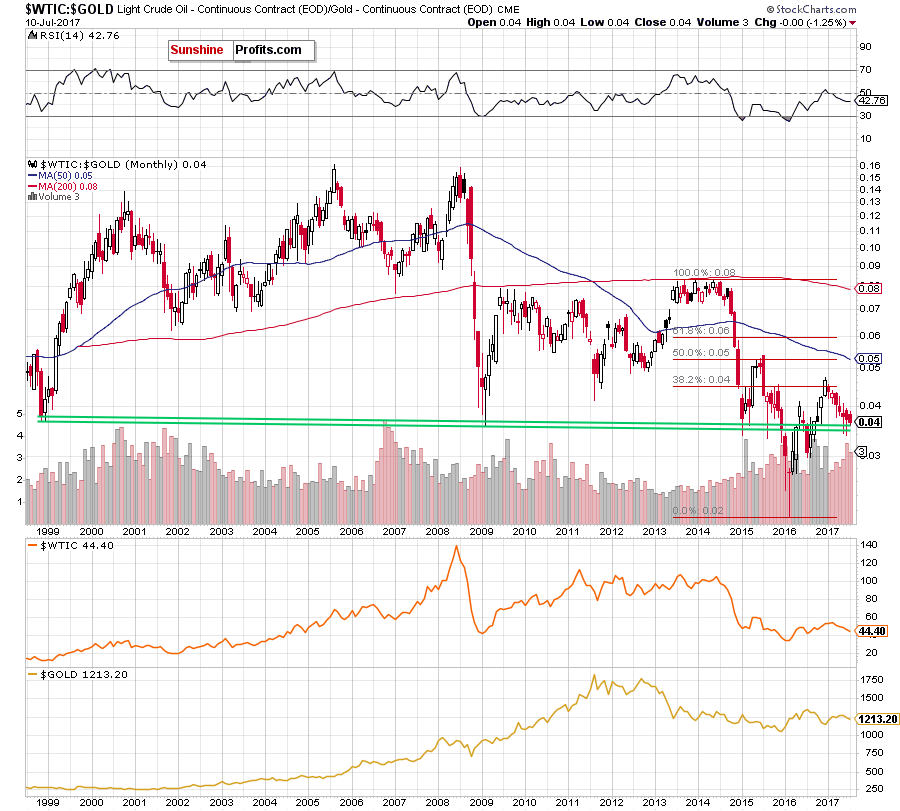
From the long-term perspective, we see that the overall situation remains almost unchained as the ratio is trading in a narrow range between the May high and low, slightly above the long-term green support lines, which stopped the bears two times in the previous months. Such situation suggests that as long as there is no breakdown and a monthly closure below this support zone another sizable move to the downside is not likely to be seen.
But will we see a test of the recent lows in the coming weeks? Let’s take a closer look at the weekly chart and try to find the answer.
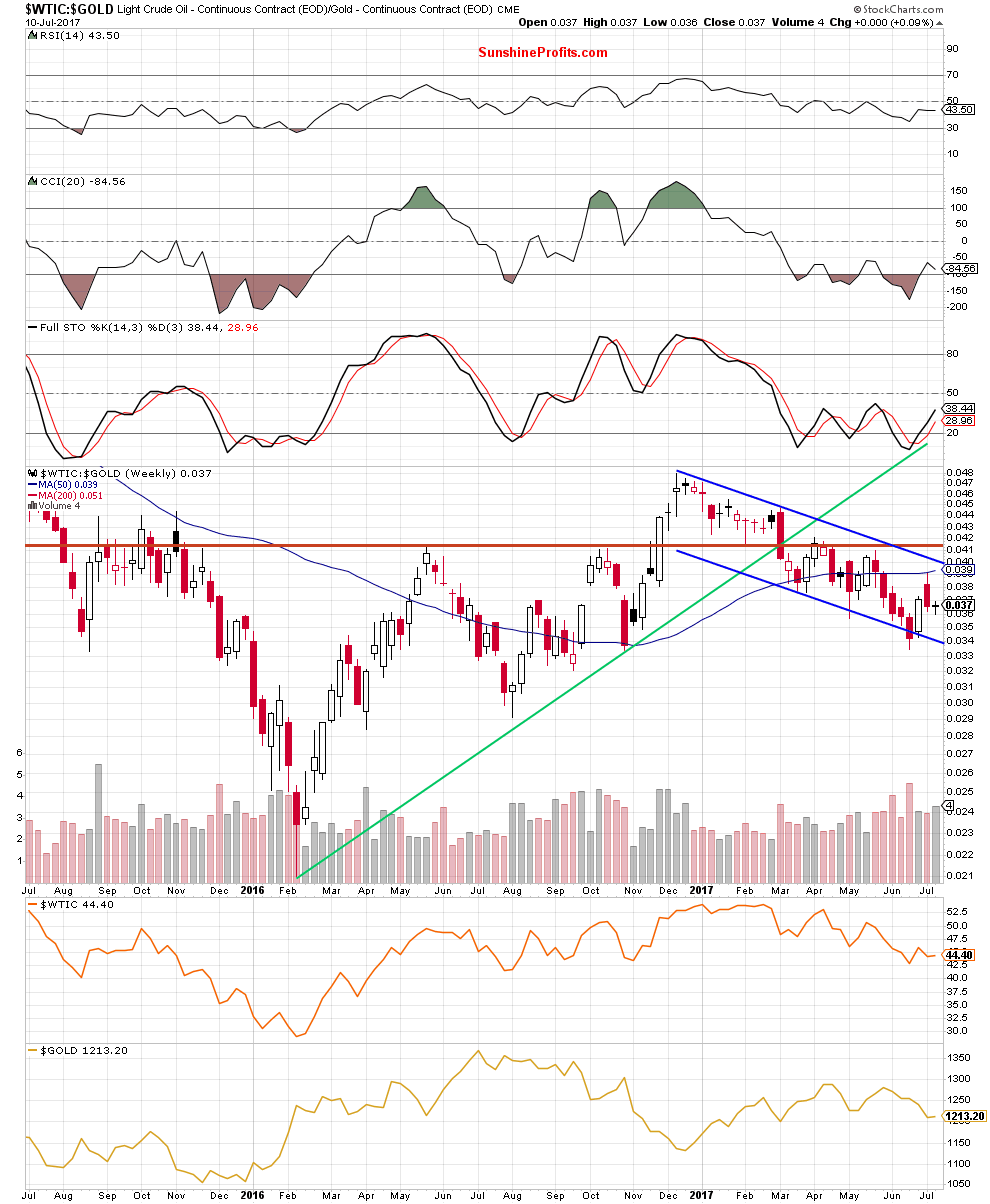
A month ago, we wrote:
(…) the ratio erased almost all of the earlier gains, which suggests another test of the lower border of the blue declining trend channel in the coming week(s). Additionally, the size of volume, which accompanied recent moves was bigger than what we saw during increases, which suggests that the bears are stronger than their opponents, which increases the probability of another downswing.
As you see on the weekly chart, the situation developed in tune with our assumptions and the ratio slipped slightly below our downside target. Despite this move, the bull took control and invalidated the breakdown – similarly to what we saw in the case of oil-to-oil stocks ratio. Thanks to this positive event the ratio climbed to the 50-week moving average, which together with the late May high triggered another downswing.
Will we see another test of the lower border of the blue declining trend channel? Let’s zoom in our picture and find out.
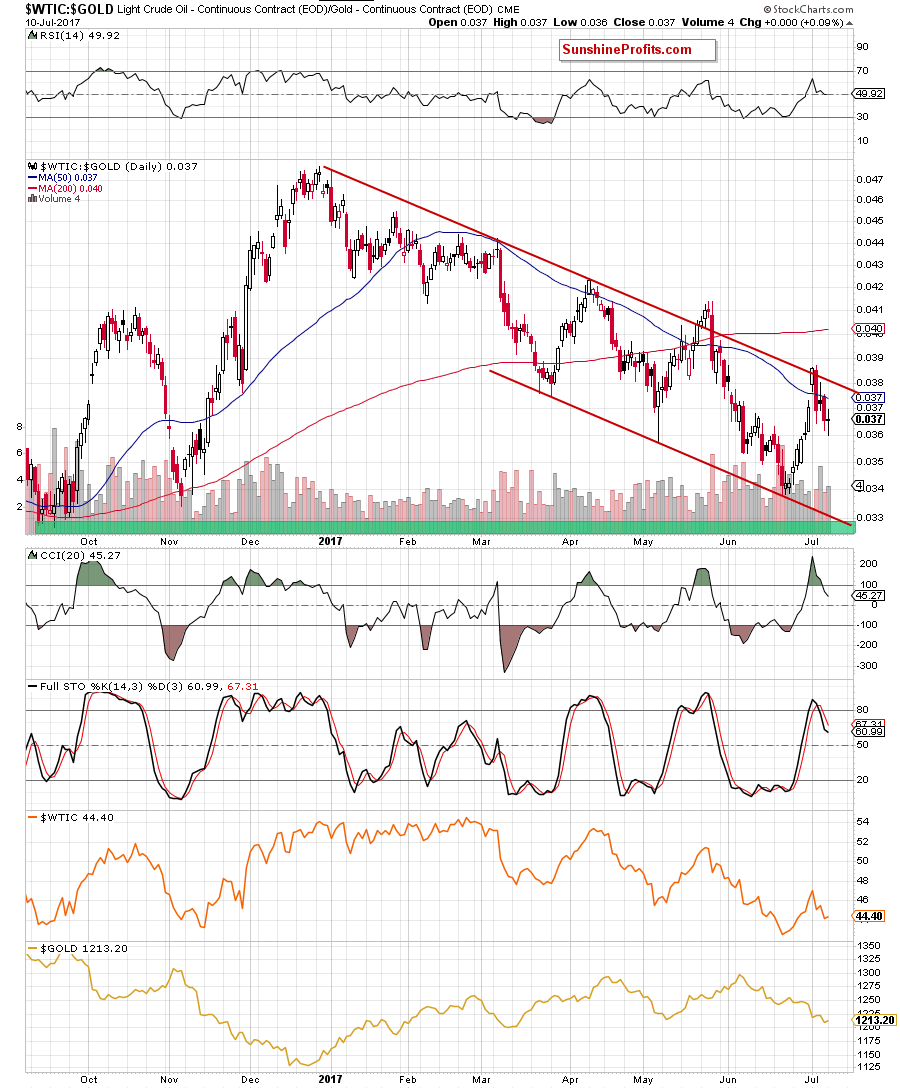
The first thing that caches the eye on the daily chart is an invalidation of the breakout above the upper border of the red declining trend channel. As you see, similar situation at the end of May triggered a sharp decline, which took the ratio and crude oil to fresh 2017 lows. Additionally, the CCI and the Stochastic Oscillator generated the sell signals, increasing the probability of further declines and a test of the medium-term support or even the green support zone marked on the daily chart.
How such price action could affect the price of crude oil? Taking into account the fact that positive correlation between the ratio and the commodity is still in cards, we can writ exactly the same what we already wrote in the case of the oil-to-oil stocks ratio: “declines in the ratio will likely translate into lower prices of crude oil in the coming week(s).”
Non-USD Crude Oil Price
Finishing this section let’s focus on the non-USD (WTIC:UDN ratio) chart of crude oil. As a reminder, UDN is the symbol for the PowerShares DB US Dollar Index Bearish Fund, which moves in the exact opposite direction to the USD Index. Since the USD Index is a weighted average of the dollar's exchange rates with world's most important currencies, the WTIC:UDN ratio displays the value of crude oil priced in "other currencies".
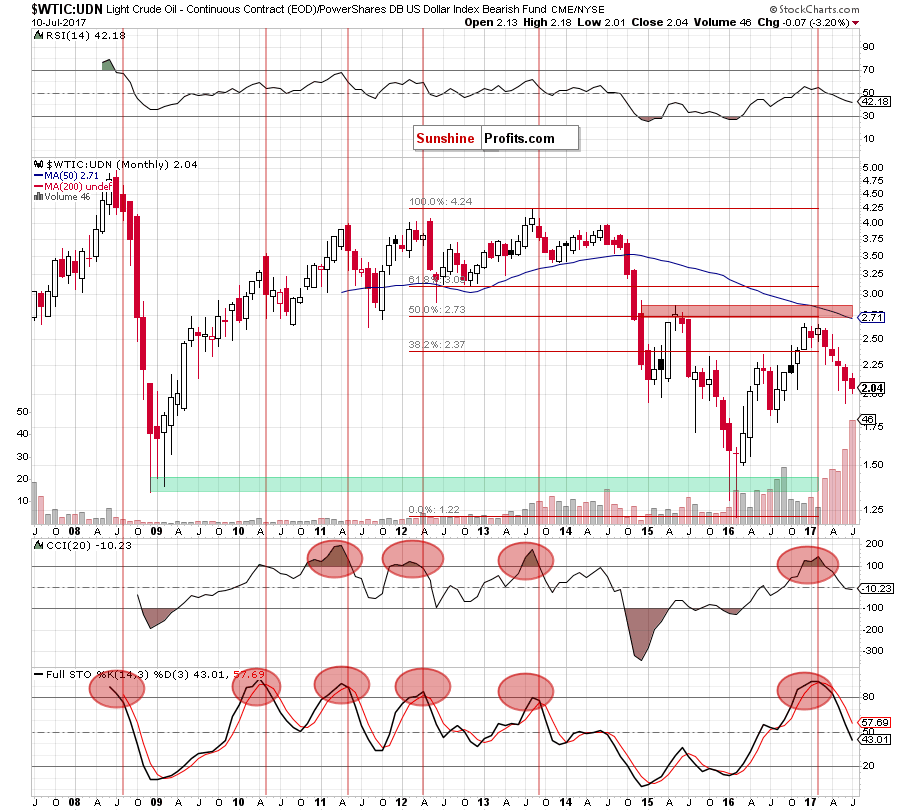
The first thing that caches the eye on the long-term chart is growing size of volume during declines. As you see from month to month declines are confirmed by higher volume, which confirms oil bears strength in the long term, suggesting that even if we see another rebound from current levels, lower values of the ratio and the black gold are still ahead us.
When can we expect another sizable move to the downside? Let’s examine the medium-term chart and look for answers.
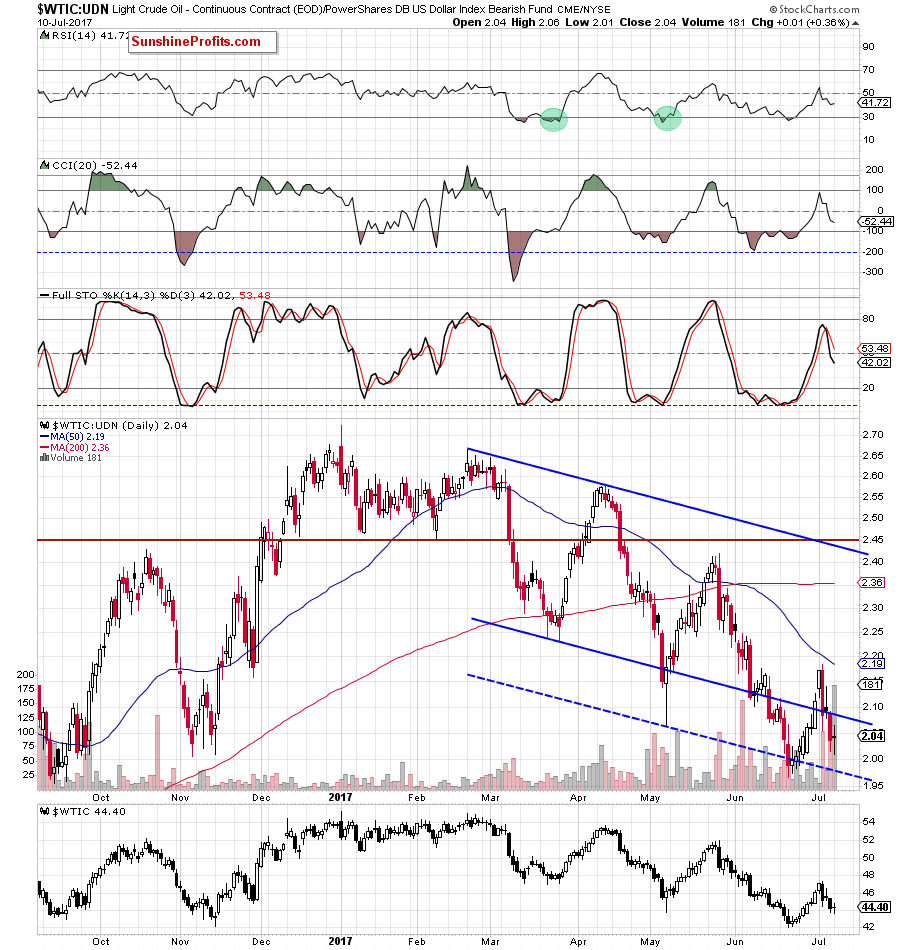
From this perspective, we see that although the ratio bounced off the green support zone, the bears pushed it lower once again. When we take a closer look at the above chart, we notice that there were similar situations in the past – in September and at the end of October 2016. Back then, the support area was strong enough to stop further declines, which suggests that as long as there is no breakdown (and the weekly closure) below it another sizable move to the downside is not likely to be seen and another short-lived rebound from here in the following weeks can’t be ruled out.
Nevertheless, before the bulls will receive the chance to show strength, we’ll likely see a test of the blue dashed support line and recent lows seen on the daily chart (please keep in mind that this scenario is currently reinforced by an invalidation of the breakout above the lower border of the blue declining trend channel and the sell signals generated by the daily indicators).
Oil Stocks
Finishing this month’s Oil Investment Update let’s examine the NYSE Arca Oil Index (XOI) to find out what the current outlook for oil stocks is.
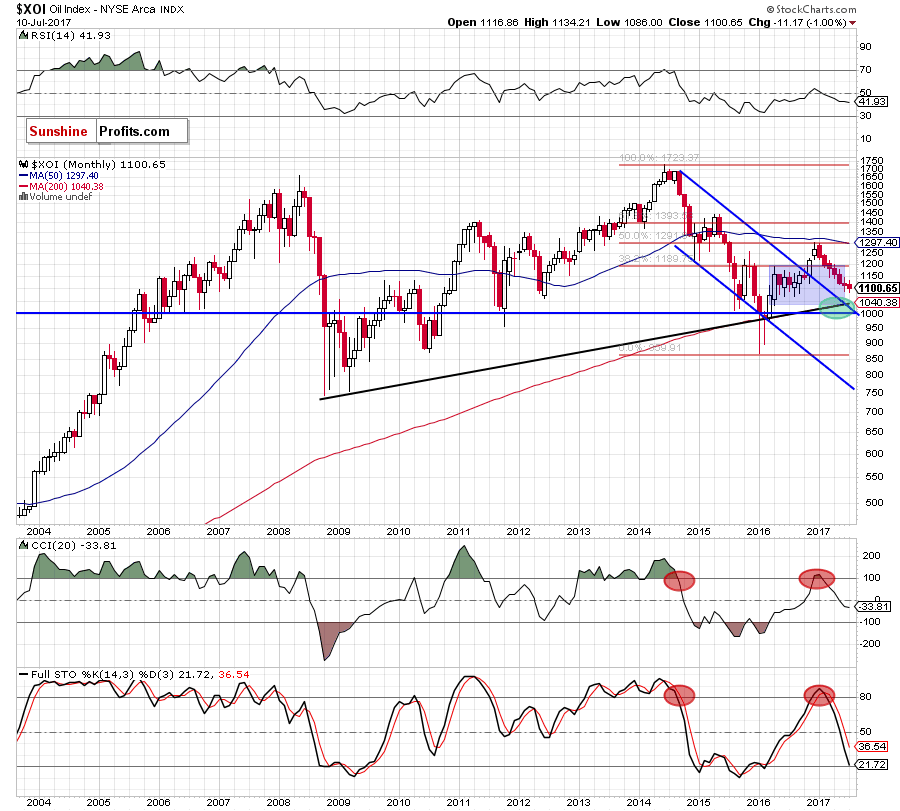
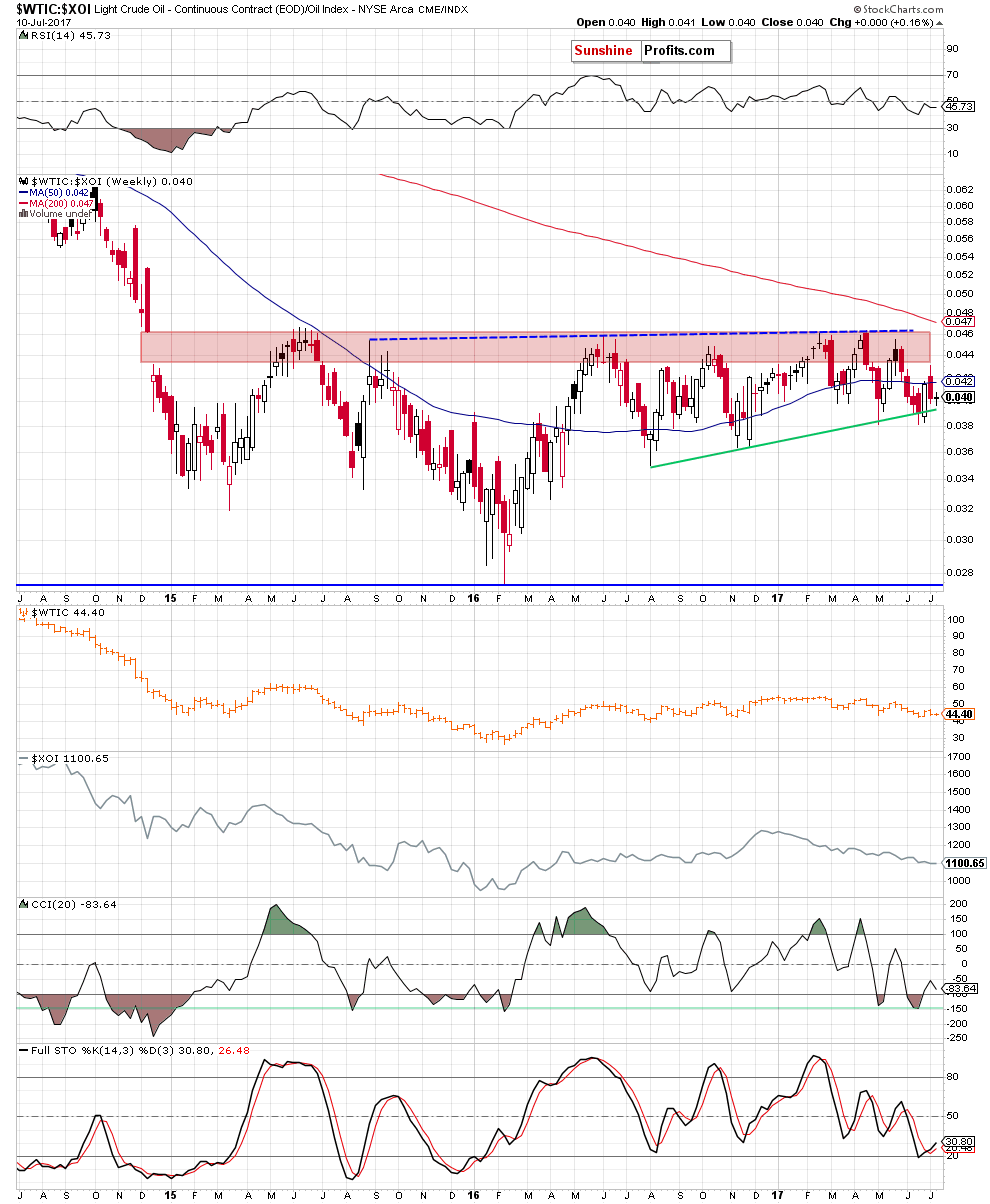
Looking at the long-term chart, we see that although oil stocks are still trading in the blue consolidation, the XOI extended losses and hit a fresh 2017 low earlier this month. Additionally, the sell signals generated by the CCI and the Stochastic Oscillator remain in place, suggesting another attempt to move lower and a test of our downside target marked with the green ellipse.
But will we see such price action in the coming weeks? Let’s examine the medium-term chart and find out.
From this perspective, we see that the XOI declined once again and re-tested the strength of the green support zone and the 50% Fibonacci retracement in the previous week. As you see, this area withstood the selling pressure, which together with the current position of the indicators suggests that another attempt to move higher may be just around the corner.
Will the short-term chart confirm this scenario? Let’s check.
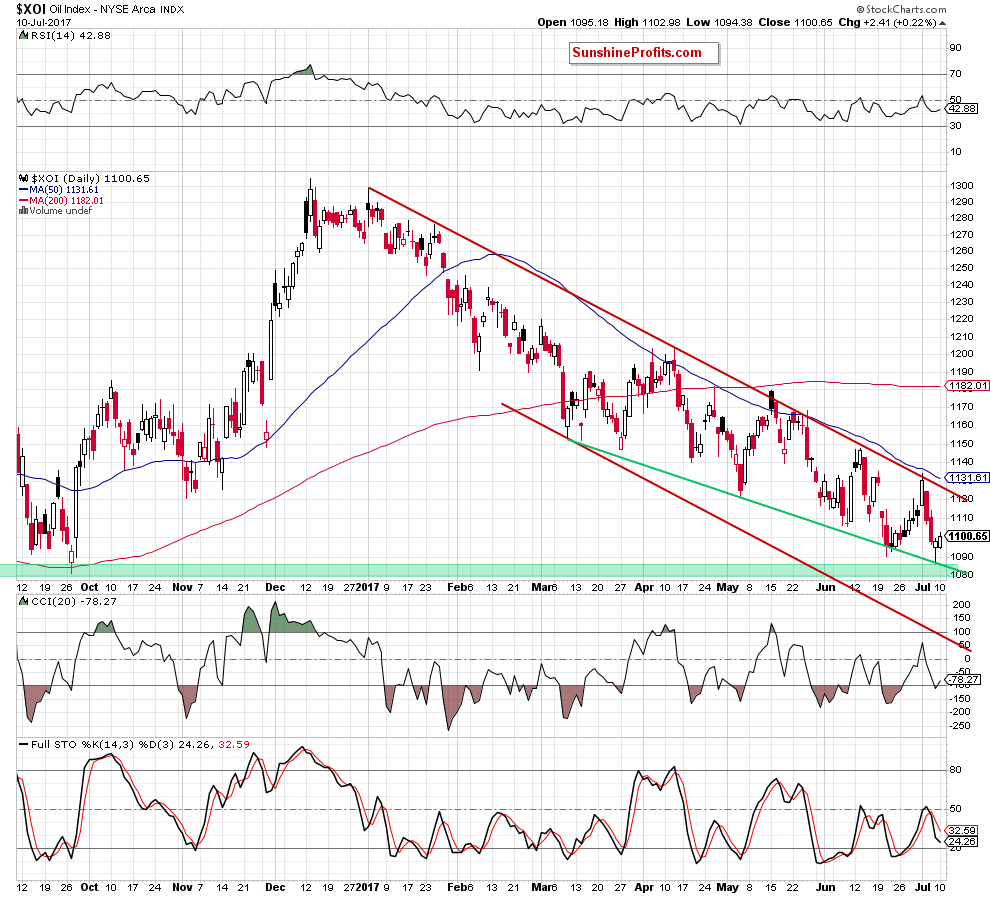
A month ago, we wrote the following:
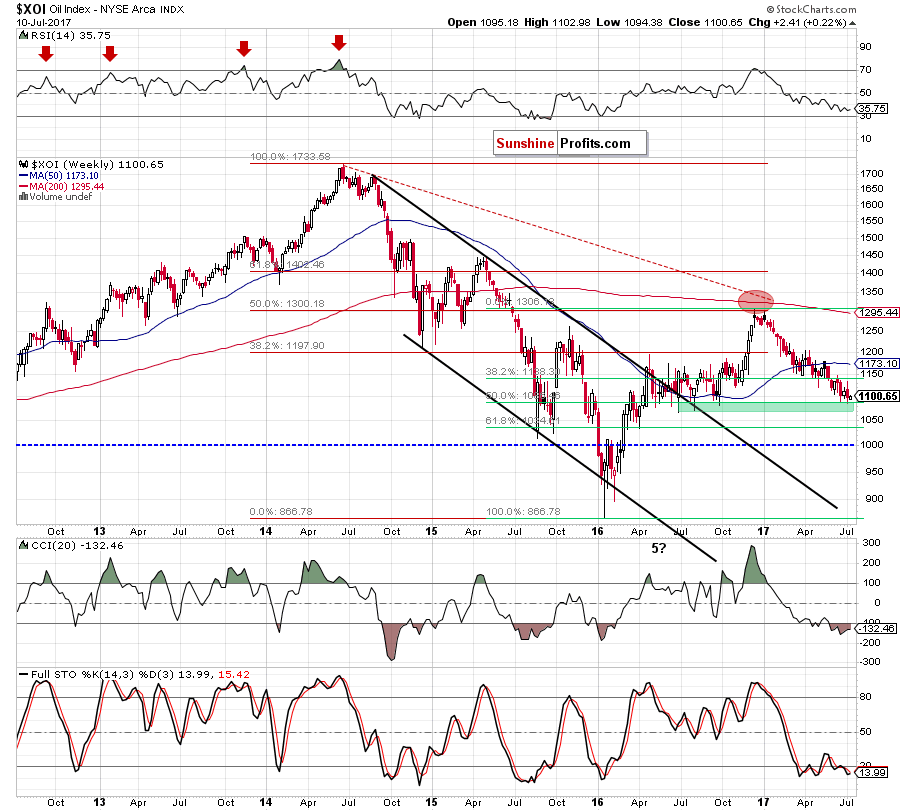
(…) we see further deterioration and a drop to (at least) the green support line based on the previous lows (currently around 1,105.13). Nevertheless, if this support is broken, oil bears could took the XOI even to the green support zone based on the late September lows (around 1,081-1,089).
From today’s point of view, we see that the situation developed in line with the above scenario and oil stocks dropped to our downside target. What’s next for the XOI? Taking into account the medium-term picture and the green support line based on the previous lows, it seems to us that the green area will trigger a rebound to the upper border of the red declining trend channel in the coming weeks. Nevertheless, the sell signal generated by the Stochastic Oscillator suggests that we’ll likely see another re-test of the green zone before the next move to the upside.
Scenarios
Just like a month ago, today’s Oil Investment Update includes scenarios of what could happen in the coming weeks. Naturally, we will continue to monitor the market in the coming days and if anything invalidates our long-term outlook we will send you an additional message.
- Bullish scenario
If crude oil extends gains and invalidates the breakdown under the lower border of the red declining trend channel marked on the daily chart, we’ll see a test of the July high. If this level is broken, the next target for oil bulls will be the 61.8% Fibonacci retracement (around $48.28), the barrier of $50 or even the May high of $52. - Bearish scenario
If the commodity drops under the green support zone created by the September and mid-November lows, we’ll see a test of the 2017 lows and the red dashed support line (parallel to the lower border of the red declining trend channel). If this area is broken, the next downside target will be the lower border of the blue declining trend channel (seen on the daily chart, which is currently around $41.47, the 50% Fibonacci retracement based on the entire 2016-2017 upward move ($40.68) or even the barrier of $40.
Summary
Looking at the short-term picture of crude oil (another drop below the lower border of the red declining trend channel and the sell signals generated by the indicators) and the current situation in the above-mentioned ratios, it seems to us that crude oil will test the recent lows and the key support zone in the coming week. Nevertheless, in our opinion, as long as there is no successful breakdown under the mid-November low (in the case of crude oil), weekly closure under the long-term green support line seen on the weekly chart of the oil-to-oil stocks ratio and the breakdown under the green support zone marked on the weekly chart of the WTIC:UDN ratio another sizable move to the downside is not likely to be seen. Therefore, we think that keeping an eye on these areas is the most important task at the moment, because depending on the bullish or bearish signals we will decide whether to open long or short positions.
Very short-term outlook: mixed with bearish bias
Short-term outlook: mixed
MT outlook: mixed
LT outlook: mixed
This completes this month’s Oil Investment Update. Our next Oil Investment Update is scheduled for Tuesday, August 8, 2017. Oil Trading Alerts subscribers will additionally receive similar but shorter alerts on a daily basis (or more than once a day when the situation requires it). You – Oil Investment Updates subscribers – will receive short Investment Alert messages should the outlook for the medium or long term change before the next Update is posted.
Thank you.
Nadia Simmons
Forex & Oil Trading Strategist
Oil Investment Updates
Oil Trading Alerts

