

This month’s Oil Investment Update we begin with the words that we used to summarize the situation in the previous update (on March 9, 2017). We summarized the situation in the following way:
(…) crude oil finally moved lower. (…) the commodity dropped below very important support levels (the lower border of the blue consolidation seen on the daily chart, the lower line of the black rising trend channel, the barrier of $50), which suggests further deterioration and a realization of the bearish scenario (…).
If the commodity drops under the 50% Fibonacci retracement and the 200-day moving average, the way to lower levels will be open. In this case, the next downside target (…) will be around: $47 (the 61.8% retracement)
Looking at the price of crude oil from today’s point of view, we see that the situation developed in line with this scenario and the commodity reached our first downside target. After this event, the black gold rebounded and the key question at the moment is: will we see further improvement or rather the bears will take control and push the price to fresh 2017 lows? Let’s jump right into the charts (charts courtesy of http://stockcharts.com) and try to find an answer to this important question.
Crude Oil
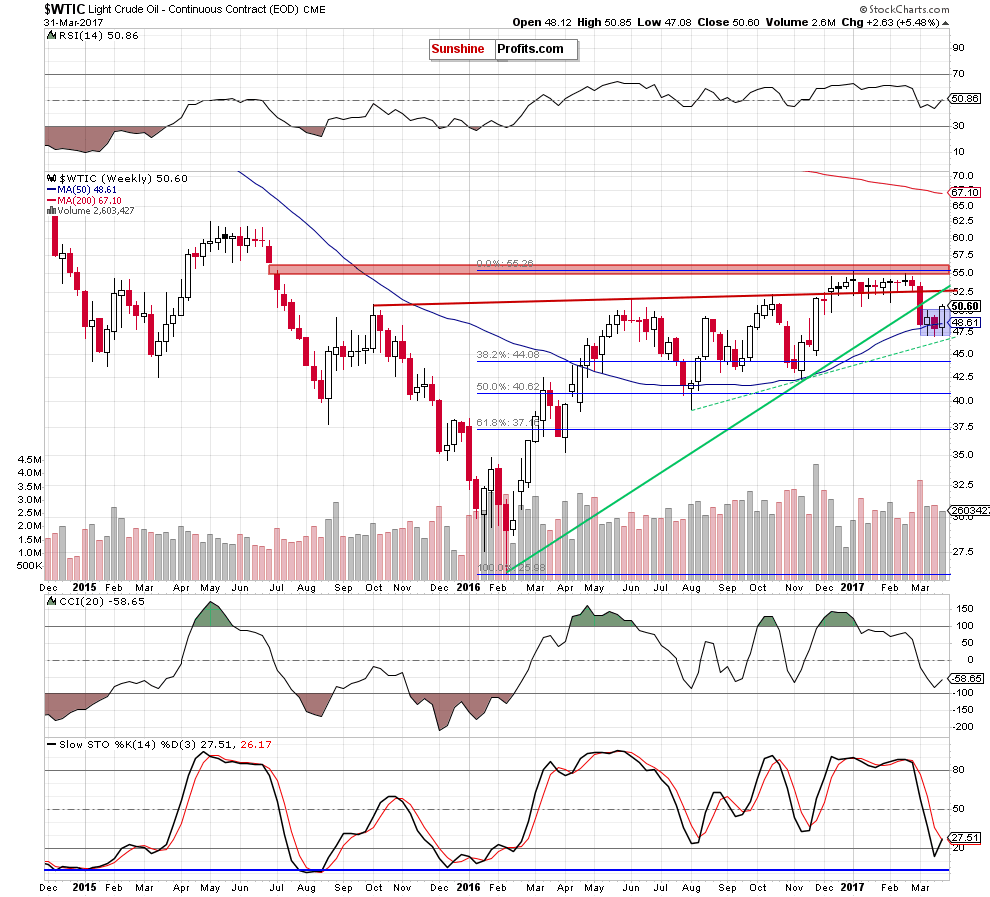
Looking at the weekly chart, we see that crude oil broke above the upper border of the blue consolidation, which is a positive development and suggests further improve. Nevertheless, when we take a closer look at the chart, we notice that the size of volume, which accompanied the last week’s increase, was smaller than what we saw during earlier declines, which suggests that oil bulls may not be as strong as it seems at the first sight. Additionally, despite this move, the black gold remains well below the previously-broken green line, which means that a breakdown and its potential negative impact on the price of the commodity is still in effect.
Will the daily chart give us more clues about future moves? Let’s examine the daily chart and find out.
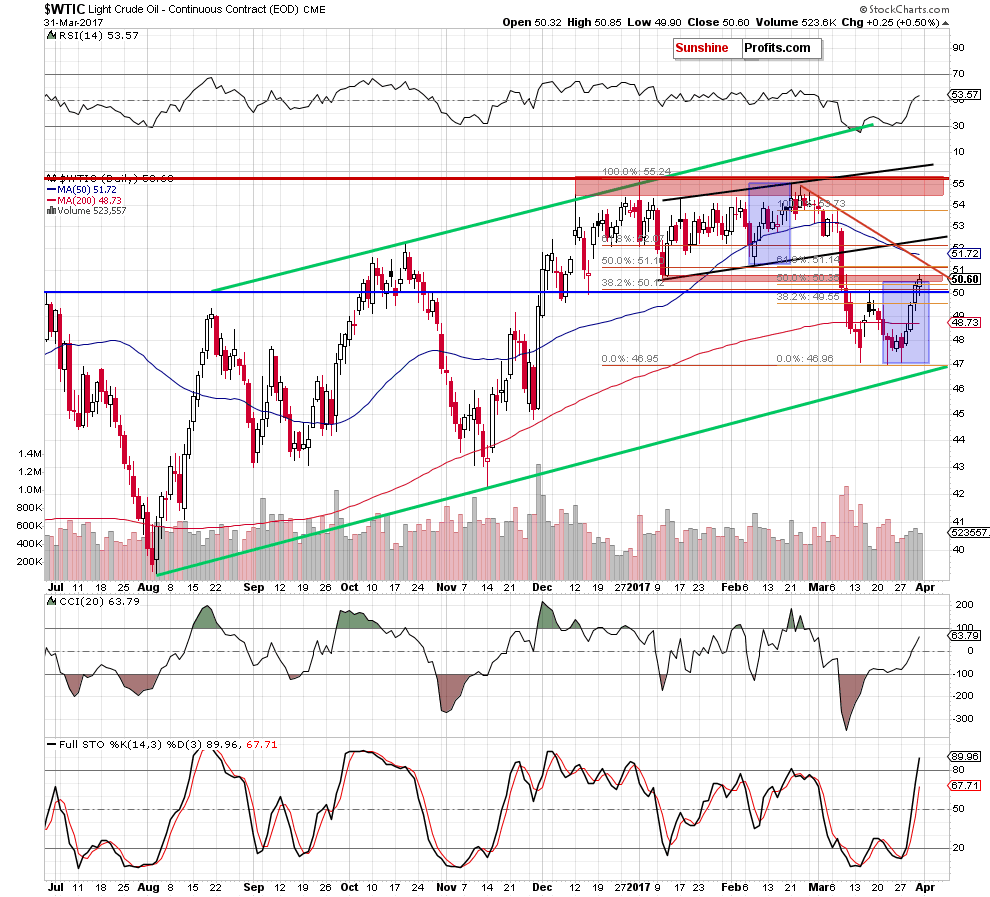
On Friday, crude oil increased slightly above the upper border of the red resistance zone, but then reversed and pulled back, invalidating this tiny breakout and closing the day below the January lows.
Additionally, not far from current levels (around $51.10-$51.14) is also a very strong resistance created by the 50% Fibonacci retracement based on the entire January – March downward move and the 61.8% retracement based on the March declines, which could encourage oil bears to act in the coming day(s). At this point, it is worth noting that similar combination of retracements stopped declines a week ago, which suggests that we may see similar reaction (but in opposite direction) in the very near future.
On top of that, when we take a closer look at the size of volume, which accompanied Friday’s increase, we see it was smaller than day earlier, which may be the first signal suggesting that bulls are losing strength.
Let’s take a look at the long-term perspective.
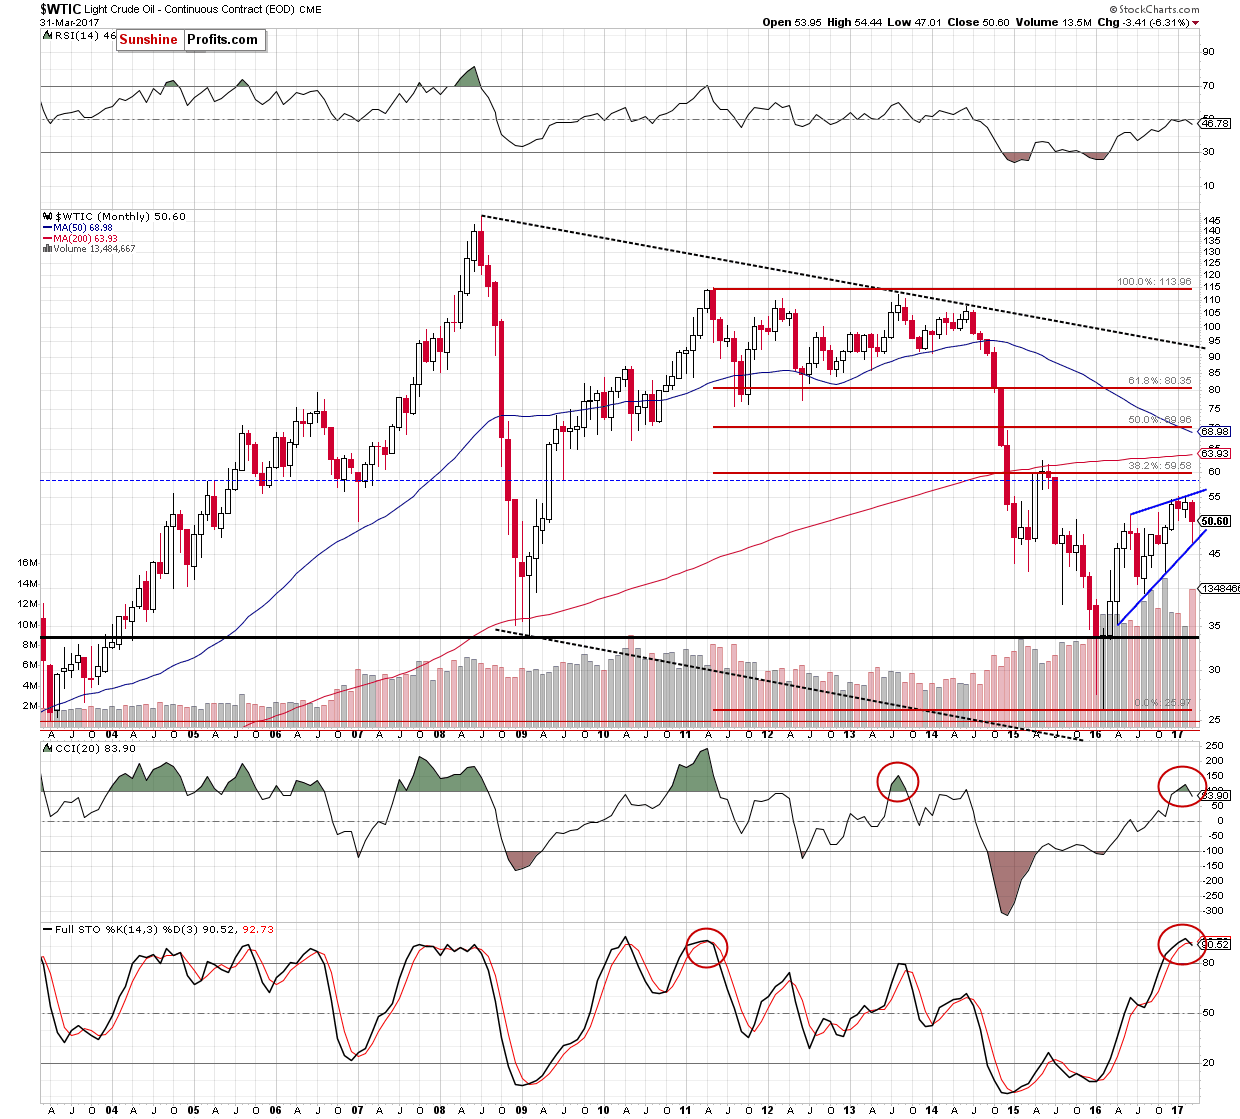
From this perspective, we see that the lower border of the blue rising wedge triggered a rebound in the previous month. Despite this move, sell signals generated by the CCI and the Stochastic Oscillator remain in place, supporting oil bears and another attempt to move lower. At this point, it is worth keeping in mind that we saw a similar situation long time ago – in October 2013 (in the case of the CCI) and June 2011 (in the case of the Stochastic Oscillator). In both cases, the sell signals preceded bigger declines, which increases the probability that we’ll see similar price action in the coming weeks.
The pro bearish scenario is also reinforced by the current situation in our ratios analysis. Let’s take a closer look at them to find out what are they saying about crude oil future moves.
Ratio Analysis
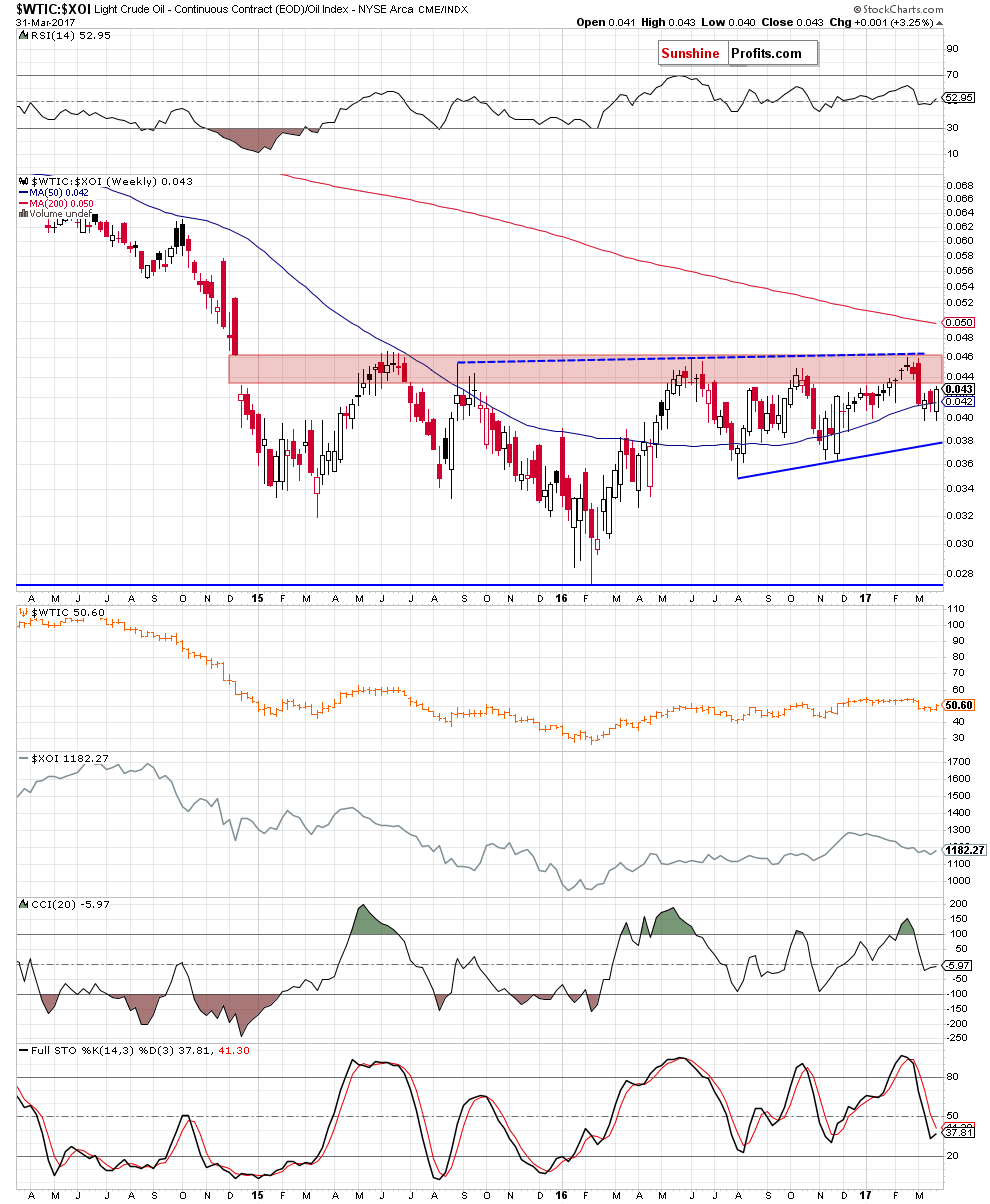
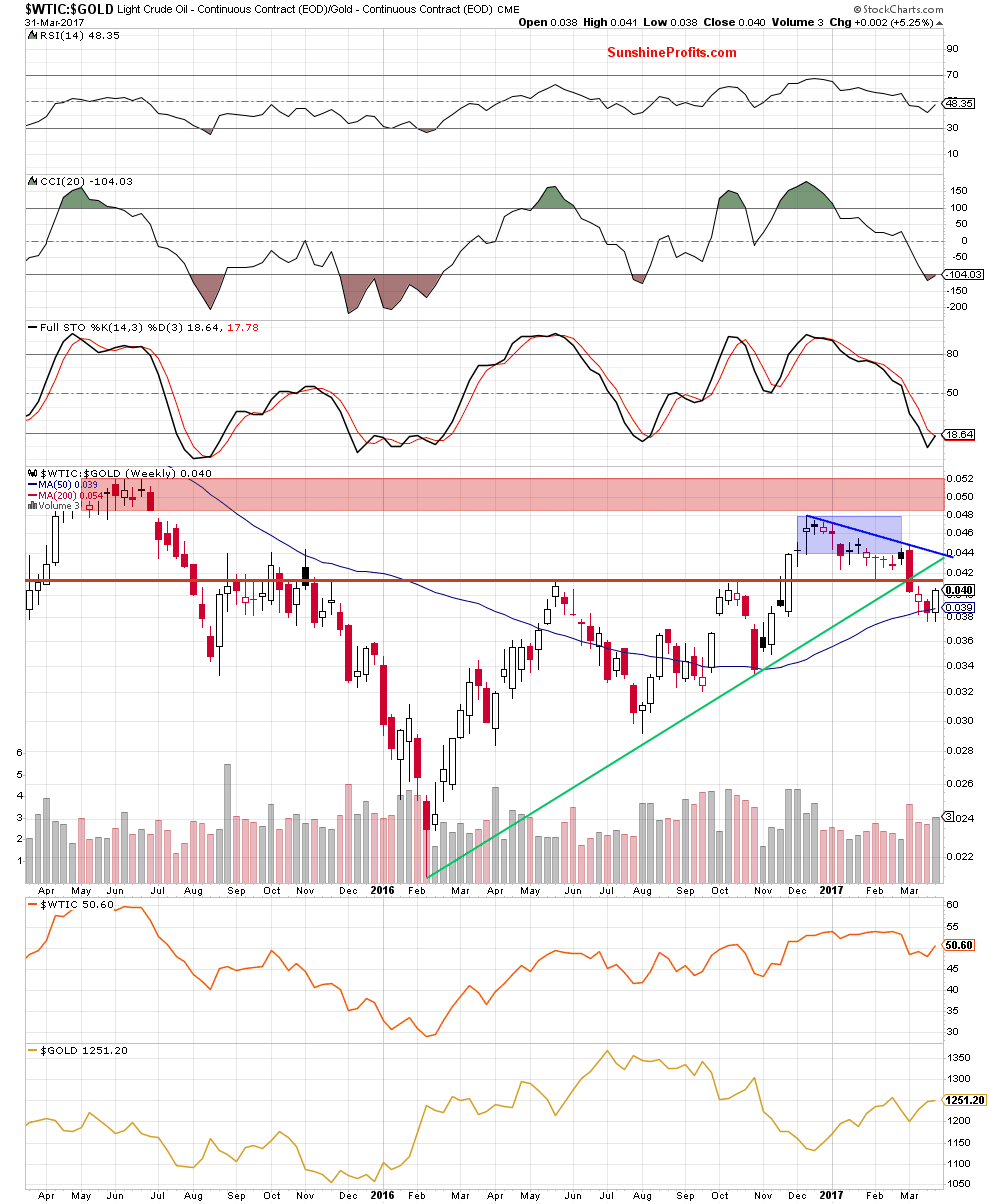
On the weekly chart, we see that although the ratio reversed and rebound, invalidating the earlier breakdown under the 50-week moving average, the key red resistance zone and the blue dashed line based on the previous highs continue to keep gains in check. This suggests that even if the ratio moves a bit higher from current levels, the space for gains seems limited. Why? As you see, in all previous cases, this major resistance zone was strong enough to stop upward moves, which increases the probability that we’ll see a similar price action in the coming week(s).
Will the very short-term chart confirm this scenario? Let’s take a closer look at the daily chart and find out.
From this perspective, we see that the recent upward move took the ratio to the 50% Fibonacci retracement based on the February – March downward move. With this increase, the ratio also climbed to the previously-broken 50-day moving average, which could be a verification of the earlier breakdown. If this is the case and the ratio declines from here in the coming day(s), it will be a negative signal, which will likely translate into another move to the downside. At this point, it is also worth noting that white candles were getting smaller in the previous week, which may signal that oil bulls are getting weaker. What does it mean for crude oil? Taking into account the fact that the positive correlation between the ratio and the commodity is still in play, we believe that lower values of the ratio will also translate into lower prices of the black gold in the coming days.
Will the relationship between crude oil and gold give oil bears another reason to act? Let’s check the charts below and find out.
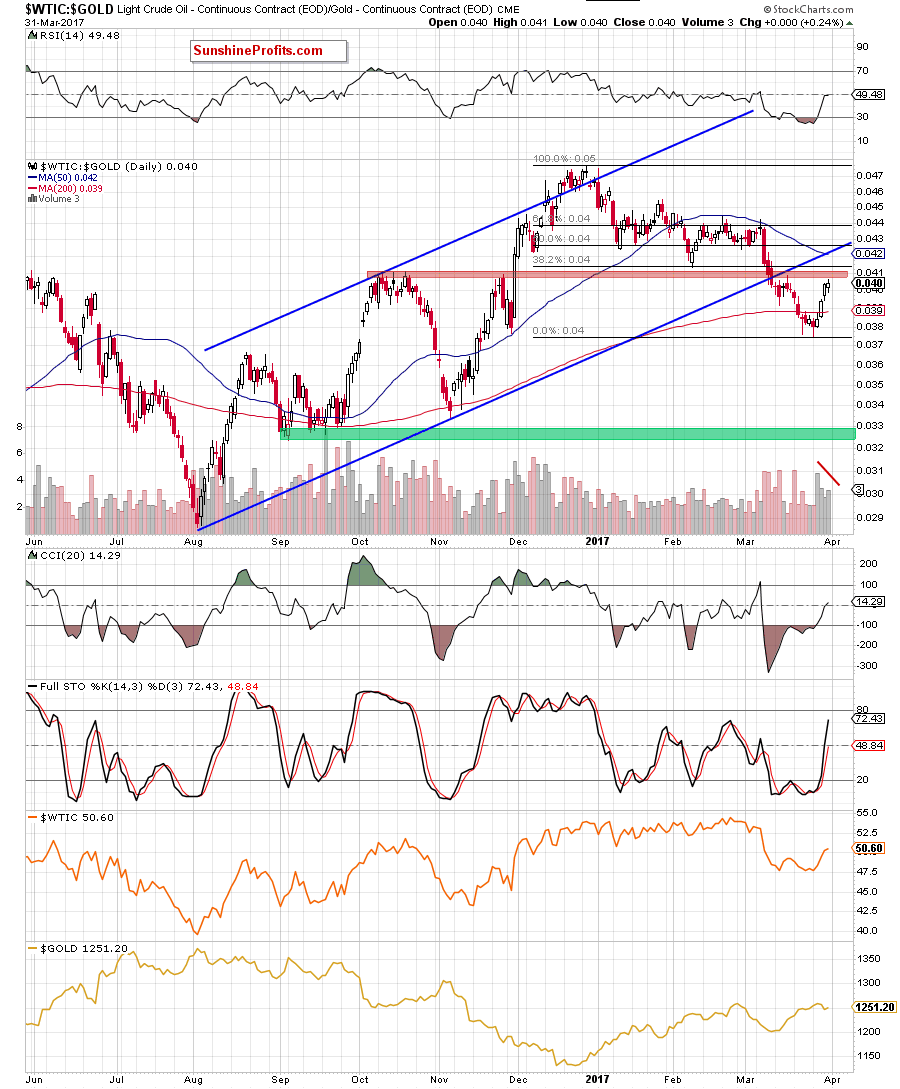
On the daily chart, we see that the ratio rebounded in the previous week, invalidating the breakdown under the 200-day moving average. Although this positive event encouraged the bulls to act, the ratio is still trading under the previously-broken red zone, which serves now as a resistance. As you see on the chart, this area managed to stop oil bulls and trigger a decline in the previous month, which suggests that the recent upward move may be another verification of the breakdown. This scenario is also reinforced by the fact that the last week’s increases were not confirmed by the growing volume, which may suggest that bulls lose strength. If this is the case, the ratio will reverse and decline in line with crude oil in the coming days, because the positive correlation between them is still in cards.
When we zoom out our picture of the ratio, we see that it remains not only below the blue declining resistance line based on the previous highs, but also under the red resistance horizontal line based on the May and October highs and well below the green line based on the February and October lows, which means that as long as there is no breakout above these lines further rally is not likely to be seen.
Having said that, let’s take a closer look at the relationship between crude oil and the general stock market.
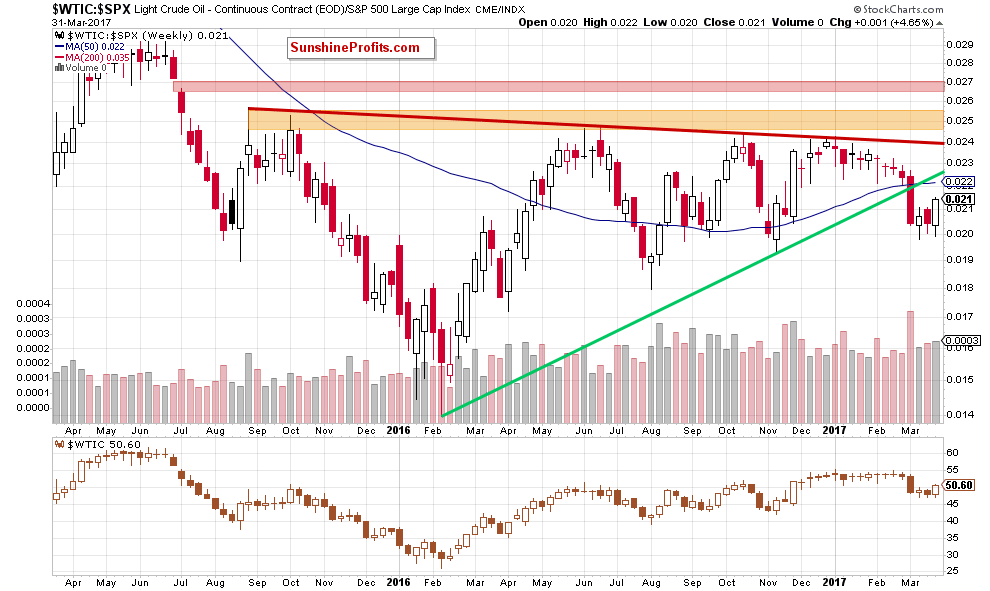
On the weekly chart, we see that despite the last week’s increase, the ratio is still trading under the previously-broken long-term green line based on the February and November lows and the 50-week moving average, which (similarly to what we saw in the case of the oil-to-gold ratio) suggests that as long as there is no breakout above these levels another move to the downside is likely (even if the ratio increases a bit and verifies the earlier breakdowns).
What’s interesting, on the daily chart below, we can notice one more pro bearish factor.
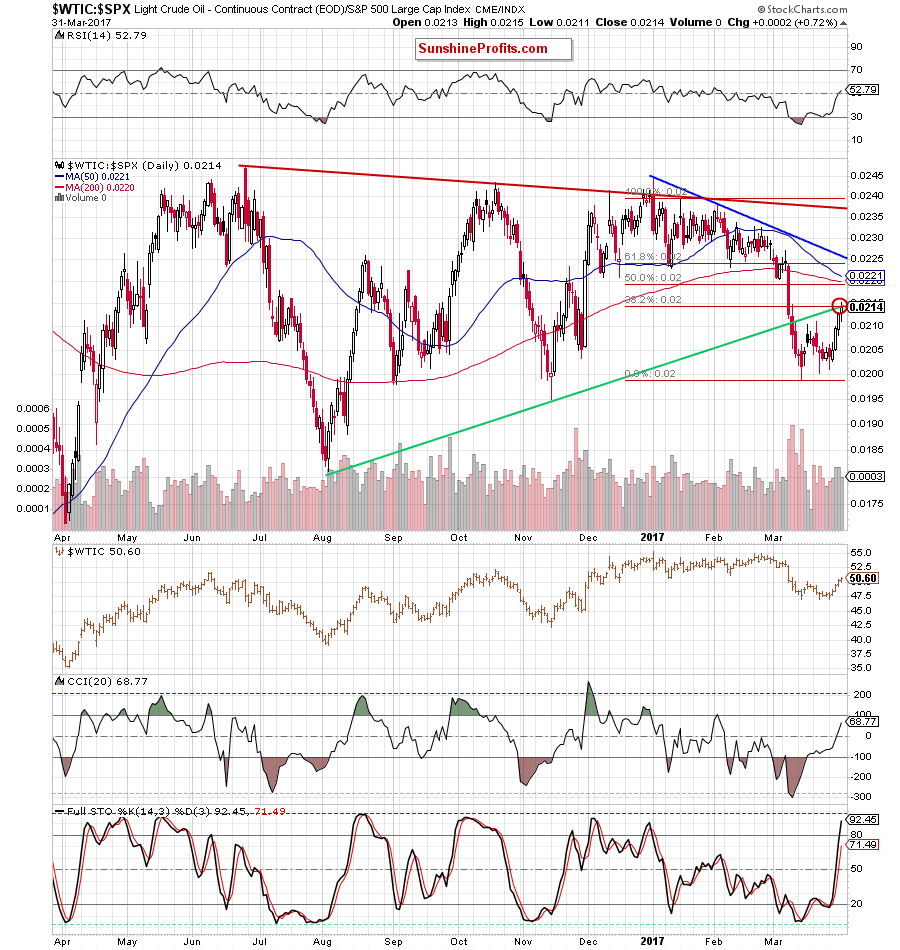
From this perspective, we see that the oil-to-stock ratio bounced off the recent lows and increased to the first strong resistance zone created by the 38.2% Fibonacci retracement and the previously-broken medium-term green line based on the August and November lows. Additionally, Friday’s increase materialized on smaller volume, which raises some doubts about the bulls’ strength. Therefore, if the ratio declines from here, we’ll see a verification of the breakdown below the green line, which will likely trigger another downswing in the black gold in the following days.
Non-USD Crude Oil Price
Before we move to the current situation in oil stocks, let’s take a closer look at the non-USD (WTIC:UDN ratio) chart of crude oil. As a reminder, UDN is the symbol for the PowerShares DB US Dollar Index Bearish Fund, which moves in the exact opposite direction to the USD Index. Since the USD Index is a weighted average of the dollar's exchange rates with world's most important currencies, the WTIC:UDN ratio displays the value of crude oil priced in "other currencies".
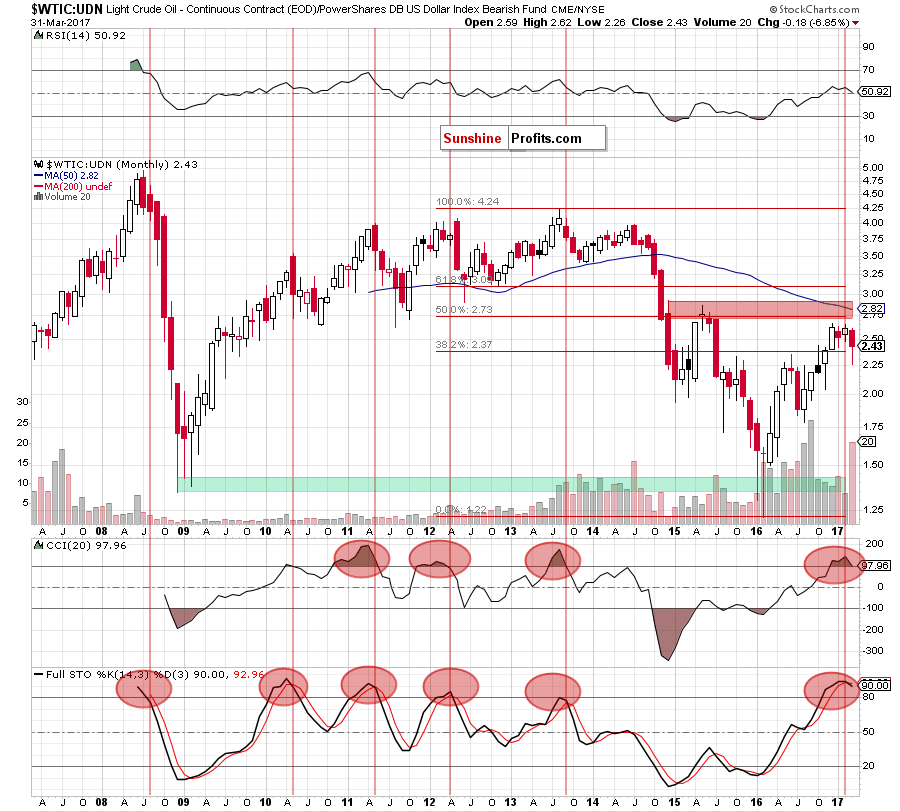
On the long-term chart, we see that although the ratio rebounded, erasing some of earlier losses, the overall situation hasn’t changed much as it is still trading under the red resistance zone and the 50-onth moving average. Additionally, the sell signals generated by the indicators remain in play, suggesting further deterioration in the coming month. At this point, it is worth noting that the CCI and the Stochastic Oscillator generated the sell signals for the first time since 2013, increasing the probability of a bigger decline.
How did this rebound affect the medium-term chart? Let’s examine the weekly chart and find out.
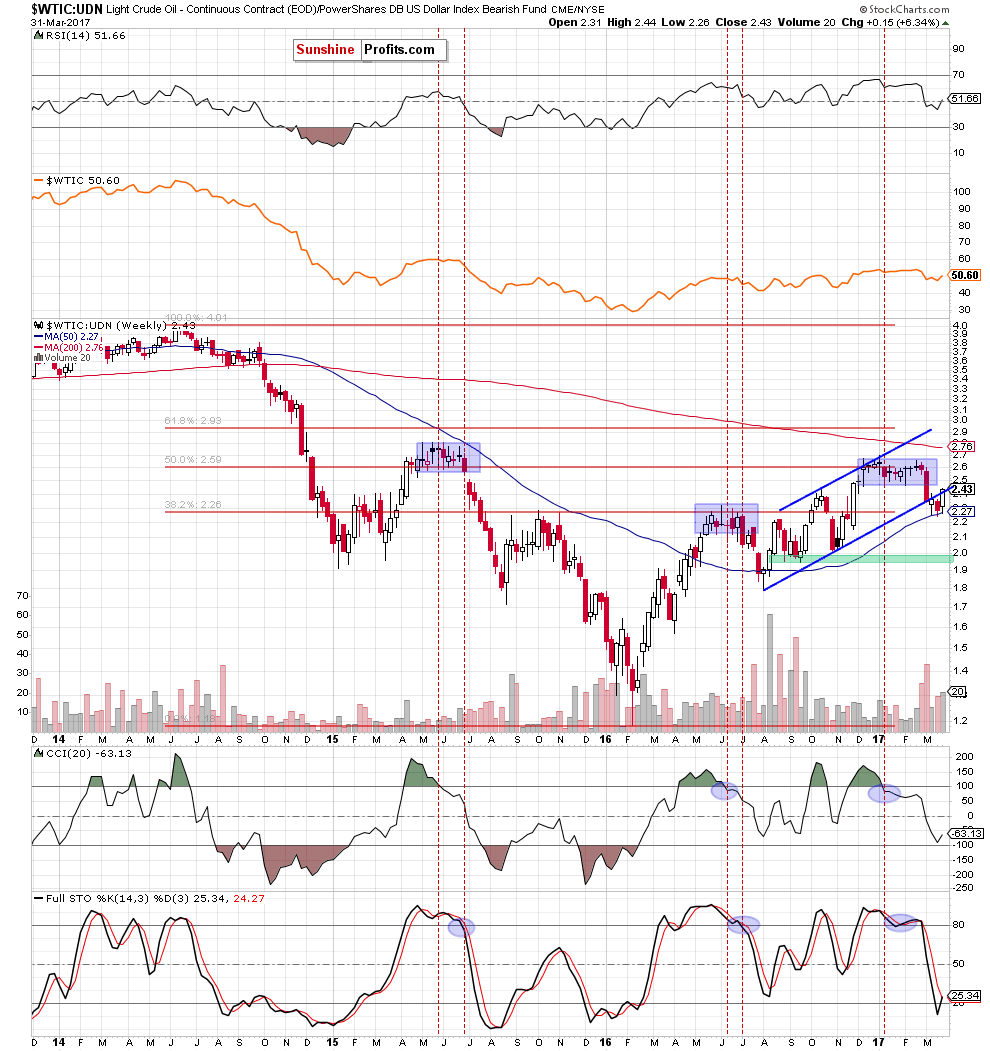
From this perspective, we see that the ratio increased and closed the previous week slightly above the previously-broken lower border of the blue rising trend channel, which is a positive sign. But will it manage to trigger further improvement? Let’s examine the daily chart and find out.
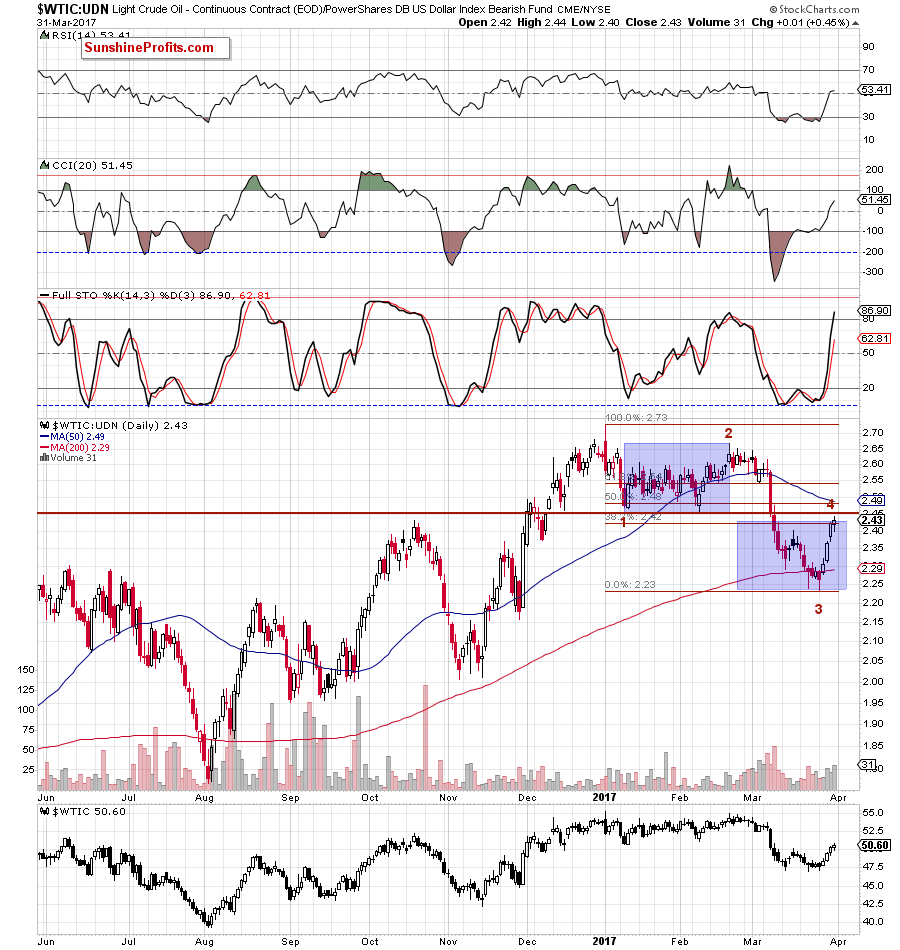
From the daily perspective, we see that the last week’s increases took the ratio slightly above the 38.2% Fibonacci retracement based on the entire 2017 downward move, which could trigger a pullback in the coming week. Additionally, similarly to what we saw in the case of crude oil priced in U.S. dollars, both upswings (the current and the one seen at the beginning of the year) are very similar, which increases the probability of reversal in a very near future.
On top of that, as long as there is no increase above the red horizontal resistance line (the bottom of the potential wave 1), the current move could be considered as the wave 4 in a 5-wave decline (according to the Elliot Wave Theory). If this is the case, and the ratio reverses and moves lower from here, we’ll see a fresh 2017 low not only in the ratio, but also in crude oil (or even another re-test of the recent lows and the green support line, which will be higher in the coming week).
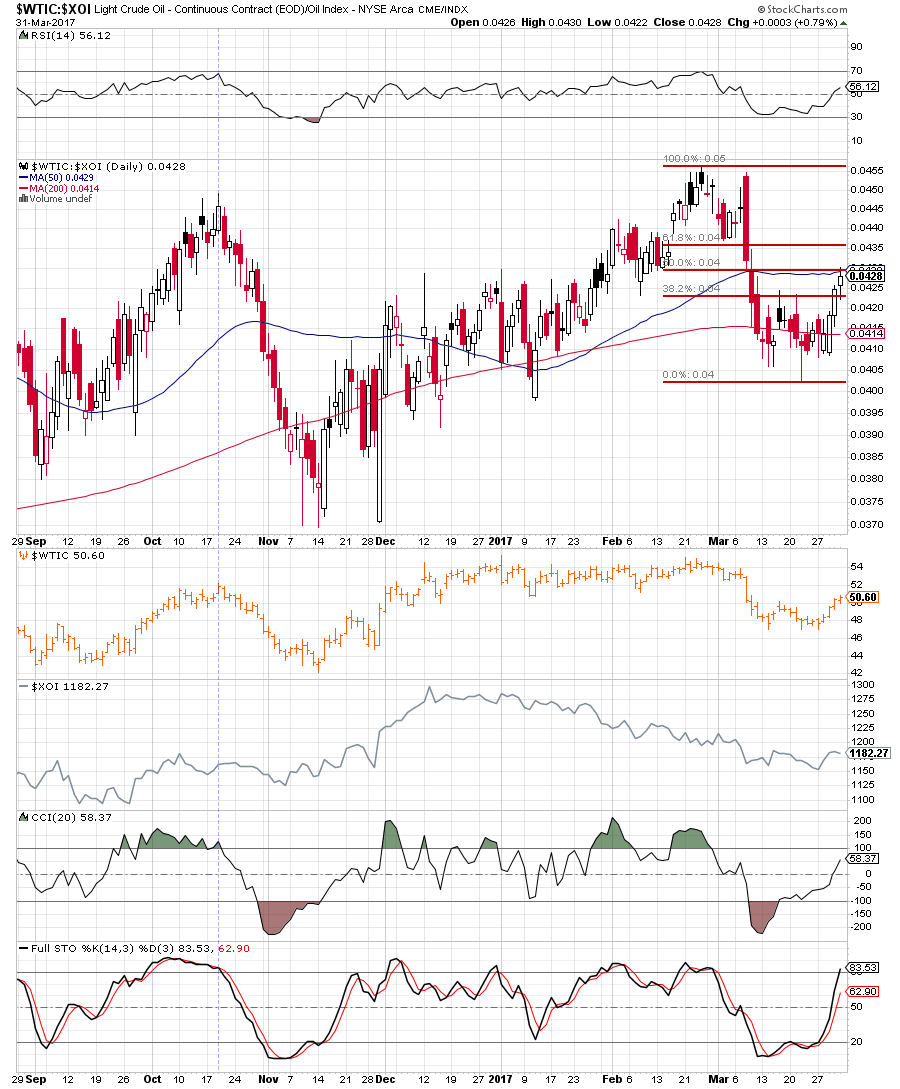
Having discussed the situation in crude oil, let’s examine the NYSE Arca Oil Index (XOI) to find out what the current outlook for oil stocks is.
Oil Stocks
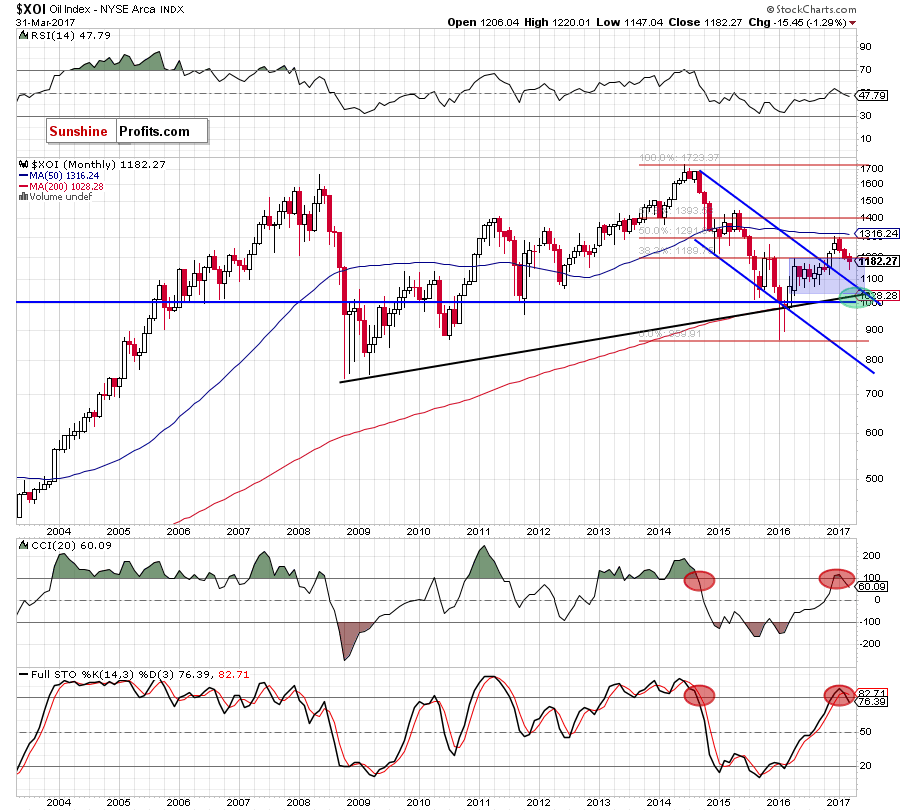
On the long-term chart, we see that oil stocks moved lower in the previous month, which resulted in a drop below the previously-broken upper border of the clue consolidation. This is a negative development, which suggests further deterioration – especially when we factor in the sell signals generated by the CCI and the Stochastic Oscillator.
How did this drop affect the medium-term picture? Let’s check.
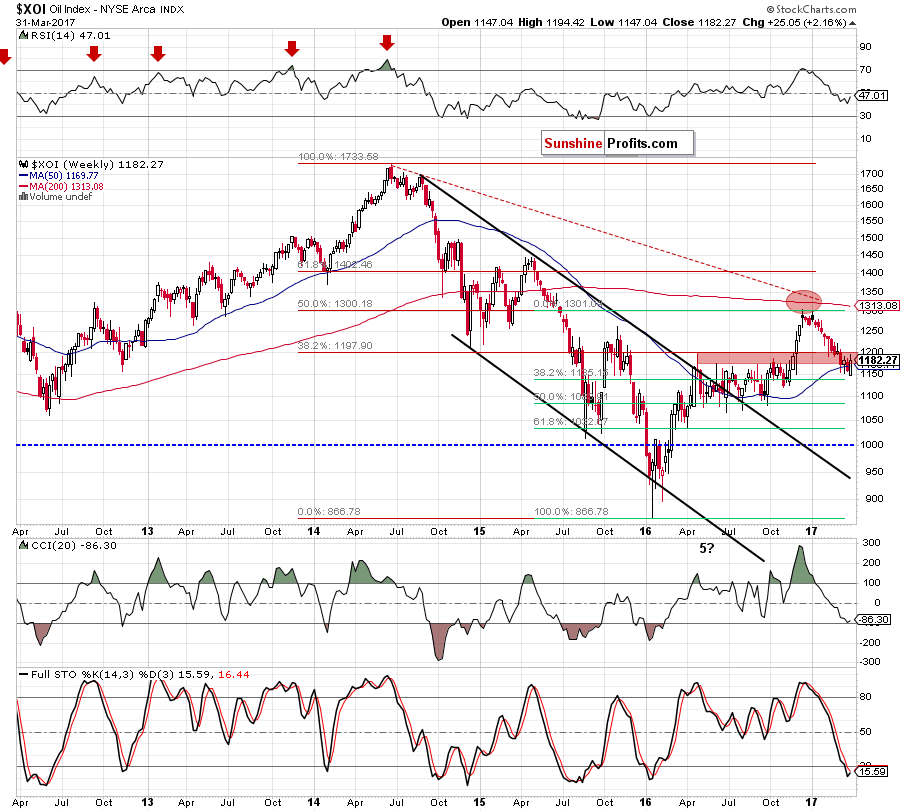
From this perspective, we see that the last month’s decline took the XOI below the April 2016 high and the previously-broken red zone, which serves now as resistance. This suggests that as long as there is no breakout (and a weekly closure) above this area further improvement is questionable.
Will we see another increase in the coming month? Let’s examine the daily chart and look for more clues about future moves.
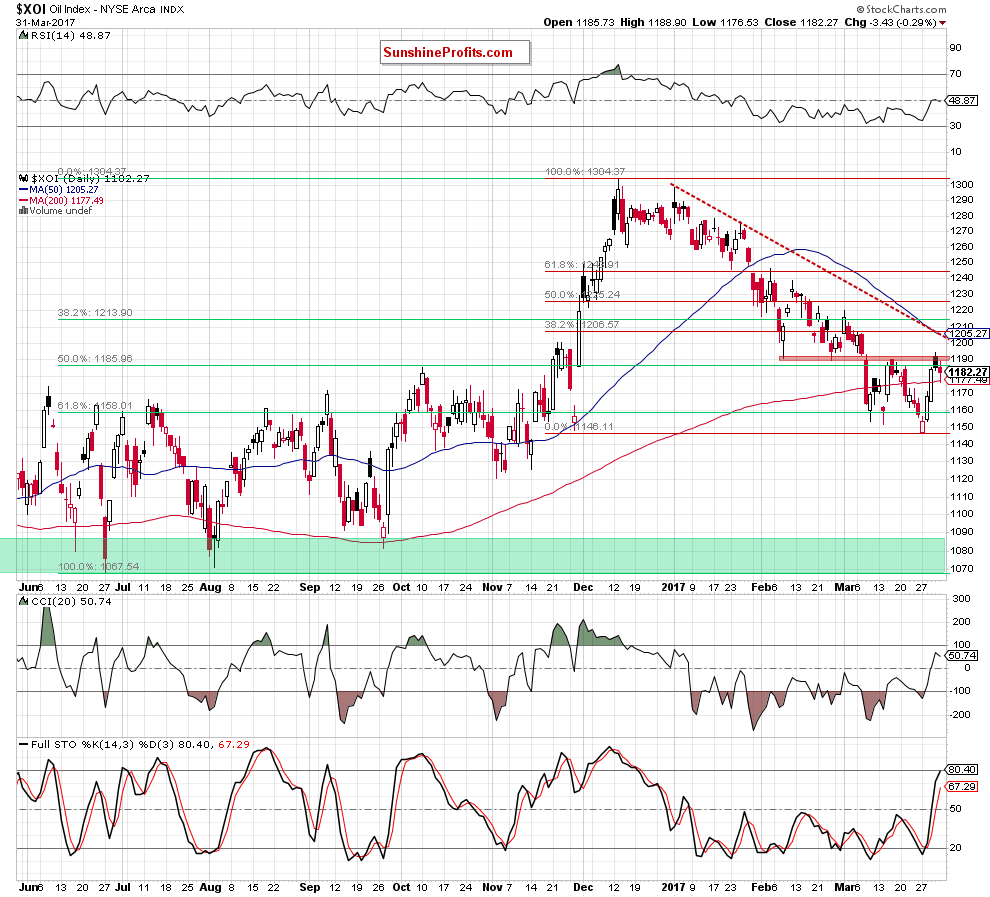
On the daily chart, we see that oil stocks rebounded in the previous week, which resulted in a climb to the red resistance zone based on the February lows. As you see, this area stopped oil bulls in two times in March, which suggests that may see a similar price action in the coming days. Nevertheless, even if the XOI moves a bit higher, the space for increases seems limited as quite close from current levels we can notice the 38.2% Fibonacci retracement based on the entire December – March downward move and the red declining dashed line based on the January highs, which together could encourage oil bears to act.
If this is the case, we’ll see a re-test of the 61.8% Fibonacci retracement and the recent lows in the coming days. If this area is broken, the next downside target will be around 1,120-1,125, (the November lows) or even around 1,067-1,100, where the next psychologically important barrier, the June, July, September 2016 lows and the 50% Fibonacci retracement are. It is also worth noting that this support area is currently also reinforced by the previously-broken upper border of the blue declining trend channel seen on the monthly chart.
Summing up, the outlook for oil stocks is currently bearish as the XOI invalidated the earlier breakout above the upper border of the blue consolidation (seen on the monthly chart) and the red resistance zone (marked on the weekly chart), which suggests another attempt to move lower and a test of the recent lows in the coming days.
Scenarios
Just like a month ago, today’s Oil Investment Update includes scenarios of what could happen in the coming weeks. Naturally, we will continue to monitor the market in the coming days and if anything invalidates our long-term outlook we will send you an additional message.
- Bullish scenario
If crude oil breaks above the red resistance zone and the 50% Fibonacci retracement based on the entire January – March downward move and the 61.8% retracement based on the March declines, we’ll likely see an increase to the lower border of the black rising trend channel (currently around $52.34). If it is broken, the way to the key red resistance zone (created by the January and February highs) will be open. - Bearish scenario
If the commodity drops under the recent lows and the medium-term green support line based on the August and mid-November lows, we’ll see a decline to the late-November lows (around $44.82-$45.22) or even to around $43, where the September and mid-November lows are. If all these supports are broken, oil bears will test the barrier of $40.
Summary
After three weeks of declines, crude oil and the above-mentioned ratios rebounded in the previous week. Despite this move, and the comeback above the barrier of $50, the black gold is still trading under the January lows and slightly below the resistance area created by the two strong Fibonacci retracements. As we mentioned earlier, a week ago, similar combination of retracements stopped declines, which suggests that we may see similar reaction (but in opposite direction) in the very near future. This scenario is also reinforced by the current situation in the ratios, which reached important resistance levels. The oil-to-oil stocks ratio climbed to the 50% retracement and the 50-week moving average, which suggests a verification of the breakdown. The oil-to-gold ratio approached the red resistance zone on decreasing volume, which doesn’t confirm the bulls’ strength, suggesting a reversal. The oil-to-stocks ratio also reached an important resistance area created by the 38.2% Fibonacci retracement and the previously-broken medium-term support/resistance green line, which suggests a verification of the breakdown and declines in the coming days. On top of that, the chart of crude oil priced in “other currencies” suggests that the black gold didn’t complete the five-wave downward move (according to the Elliott Waves Theory). If this is the case, we’ll see reversals and declines to our downside targets (according to our bearish scenario) in the coming week(s).
Very short-term outlook: bearish
Short-term outlook: mixed with bearish bias
MT outlook: mixed with bearish bias
LT outlook: mixed with bearish bias
This completes this month’s Oil Investment Update. Our next Oil Investment Update is scheduled for Thursday, May 11, 2017. Oil Trading Alerts subscribers will additionally receive similar but shorter alerts on a daily basis (or more than once a day when the situation requires it). You – Oil Investment Updates subscribers – will receive short Investment Alert messages should the outlook for the medium or long term change before the next Update is posted.
Thank you.
Nadia Simmons
Forex & Oil Trading Strategist
Oil Investment Updates
Oil Trading Alerts

