

From today’s point of view, we can say with full conviction that April was the best month for oil bulls since June. In the previous month, crude oil erased around 30% of the June-March declines and almost touched the barrier of $60 as the combination of a weaker greenback, the situation in the Middle East (Yemen) and further reductions in the number of oil rigs supported the price. Additionally, in the first days of the new month, light crude extended rally and climbed to a fresh 2015 high of $62.58, reaching the key resistance zone. Yesterday, this area paused further rally, but is it strong enough to trigger further deterioration?
Before we jump into the world of charts and check all technical factors that could drive the price of light crude higher or lower, we would like to draw your attention to the key fundamental factor, which pushed the commodity to a fresh 2015 high.
In our previous Oil Investment Update, we wrote the following:
(…) from the technical point of view crude oil is “ready” for further improvement. Nevertheless, as we have pointed out before, as long as there are no significant signs that a supply glut is getting smaller (for example, by reducing domestic inventories), sizable rally (…) is questionable.
In the recent months market players have been paying close attention to the shrinking rig count for signs it would eventually reduce the glut of crude flowing into the market. Last Friday, Baker Hughes showed in its weekly report that oil rigs fell by 24 last week to 679. With this drop, the number of active rigs has fallen for a record 21 weeks in a row to the lowest level since September 2010. Although the pace of slowdown continued to decrease (which raised some worries over another increase in domestic crude oil supplies), the U.S. Energy Information Administration showed in its yesterday’s report that U.S. crude oil inventories fell by 3.9 million barrels in the week ended May 1, significantly below expectations of a 1.5 million build. The report also showed that supplies at Cushing, Oklahoma, declined by 12,000 barrels last week, easing concerns that stockpiles could reach full storage capacity by the start of the summer.
In these circumstances, the commodity extended gains and climbed above $62. How did this increase affect the picture of light crude? Let’s examine charts to find out what are they saying about future moves (charts courtesy of http://stockcharts.com).
Crude Oil
In our previous Oil Investment Update, we wrote the following:
(…) taking into account buy signals generated by the indicators and the size of the recent rally (it was the biggest upward move since June), it seems to us that higher values of the commodity are just around the corner (even if we see a short-term or even very short-term pullback in the coming days).
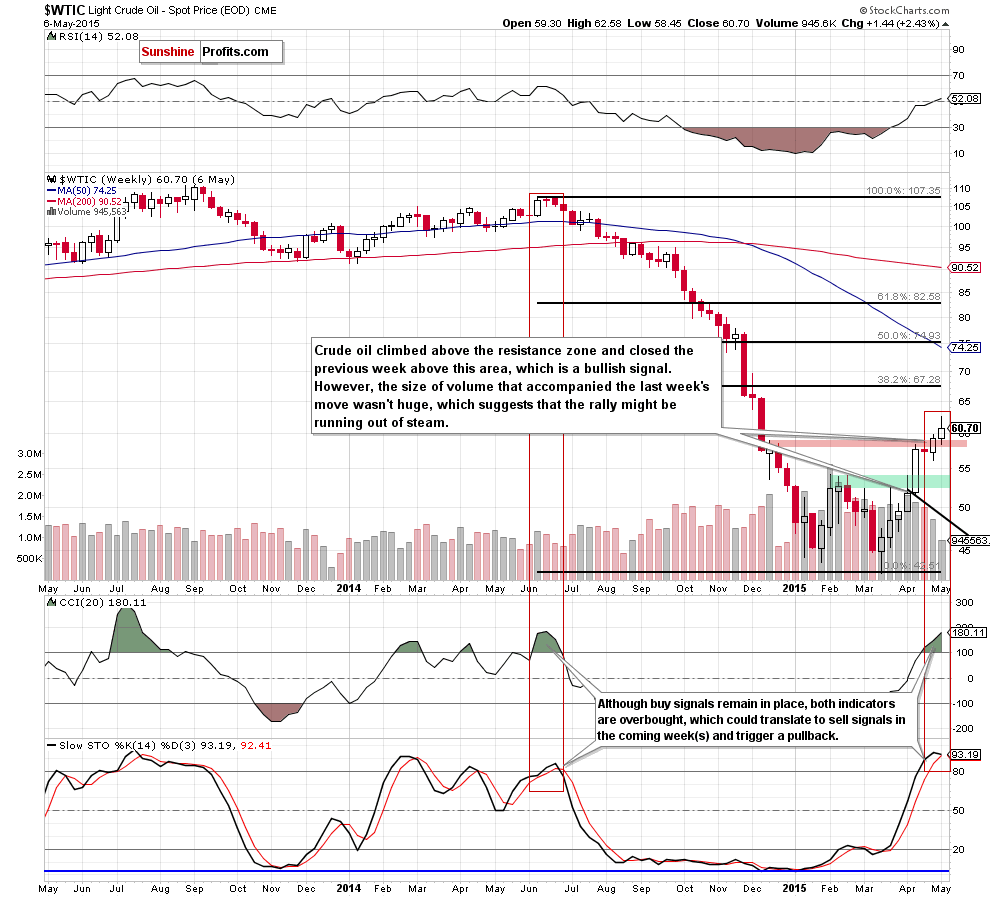
Looking at the weekly chart, we see that oil bulls pushed the commodity higher as we expected. With this upward move the commodity climbed above the red resistance zone and closed the previous week above it, which is a bullish signal. Nevertheless the size of volume that accompanied the last week’s move wasn’t huge (in fact the volume level has decreased since the beginning of Apr), which suggests that the rally might be running out of steam.
Additionally, we would like to draw your attention to fact that although buy signals remain in place, the CCI and Stochastic Oscillator are overbought, which could translate to sell signals in the coming week(s) and trigger a pullback.
Are there any other technical factors that could encourage oil bears to act? Let’s examine the monthly chart and find out.
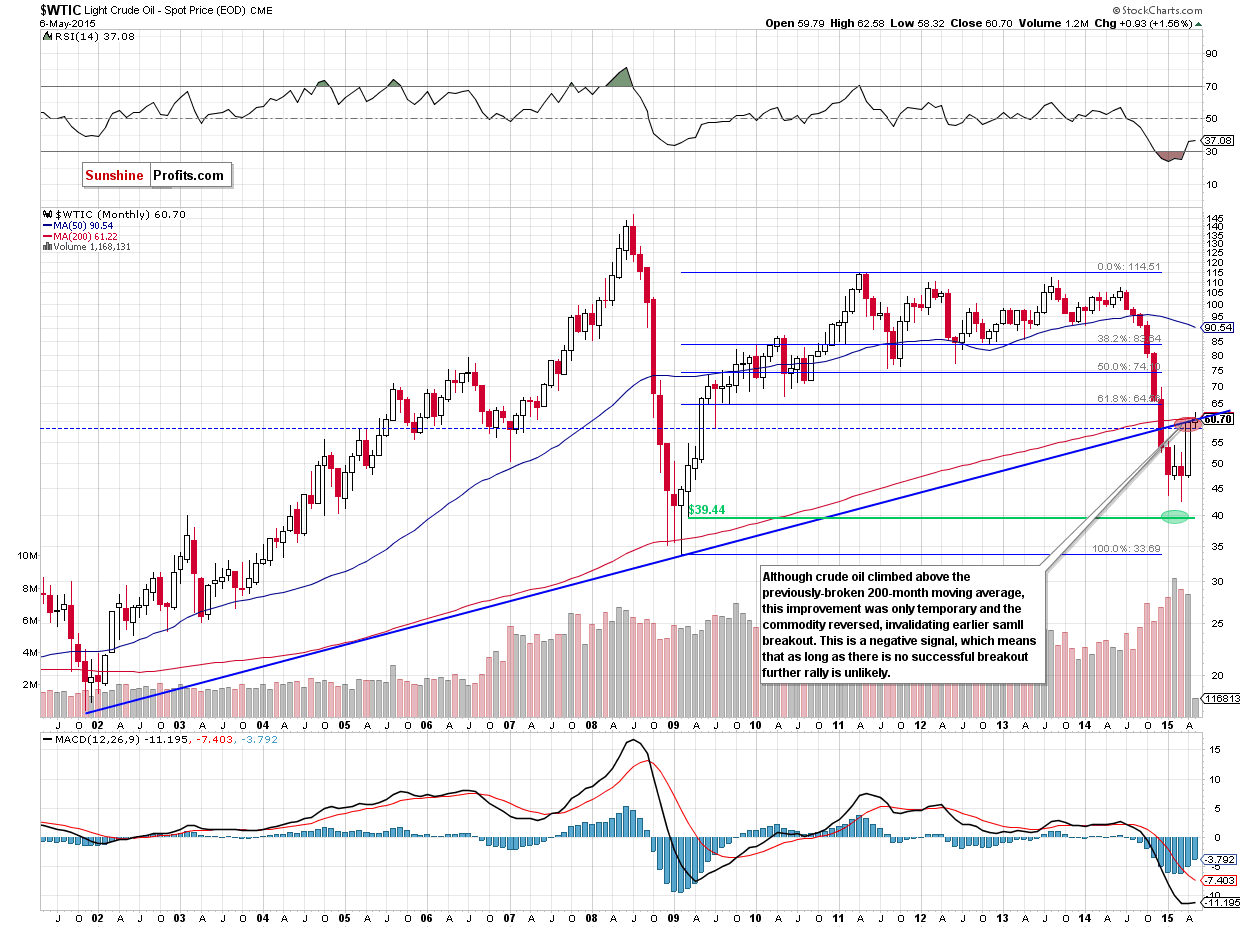
On the long-term chart we see that although crude oil climbed above the 200-month moving average, this improvement was only temporary and the commodity reversed, invalidating earlier small breakout. This s a negative signal which means that as long as there is no successful breakout above this key resistance further rally is unlikely.
How did this downswing affect the very short-term picture? Let’s take a closer look at the daily chart and find out.
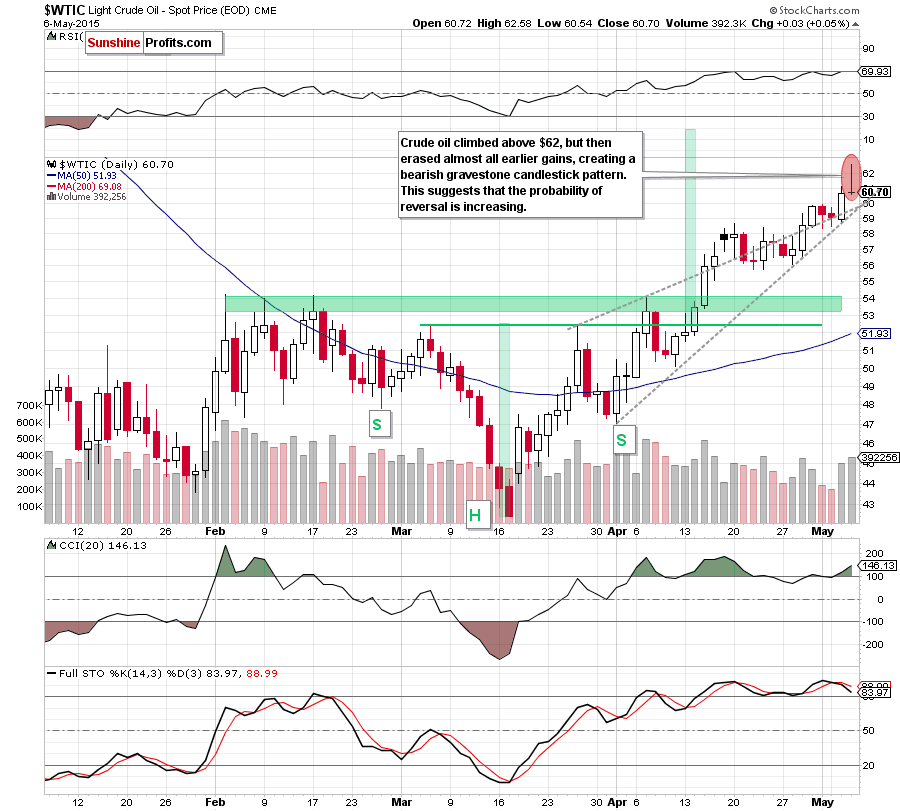
Looking at the very short-term chart, we see that crude oil extended rally and hit a fresh 2015 high of $62.58. Despite this improvement, the commodity reversed and erased almost all earlier gains creating a gravestone candlestick pattern on the above chart (please note that this is a common reversal pattern, which suggests that a bullish rally or trend is about to reverse), which is a negative sign.
On top of that, the RSI climbed to the level of 70, the CCI is overbought, while Stochastic Oscillator generated a sell signal (there are also negative divergences between indicators and light crude). Additionally, the size of volume that accompanied yesterday’s increase wasn’t huge (compared to what we saw in mid-Apr and only slightly higher than the day before), which suggests that correction of the recent rally is just around the corner.
If this is the case, and the commodity moves lower, the initial downside target would be around $60, where the previously-broken grey support lines are. If this support level is broken, the next target would be around $55.73-$56 (where the bottom of the previous bigger pullback is) or we might see a test of the green support zone created by the Feb highs ($54-$54.24) in the coming days.
Summing up,crude oil extended gains and hit a fresh 2015 high. Although this is a positive signal, the current position of the weekly and daily indicators in combination with the size of volume that accompanied yesterday’s upswing (and falling volume levels, which we've seen since the beginning of April) and the invalidation of small breakout above the 200-month moving average suggests that correction of the recent rally is just around the corner.
Having discussed the situation in crude oil, let’s examine the NYSE Arca Oil Index (XOI) to find out what the current outlook for oil stocks is.
Oil Stocks
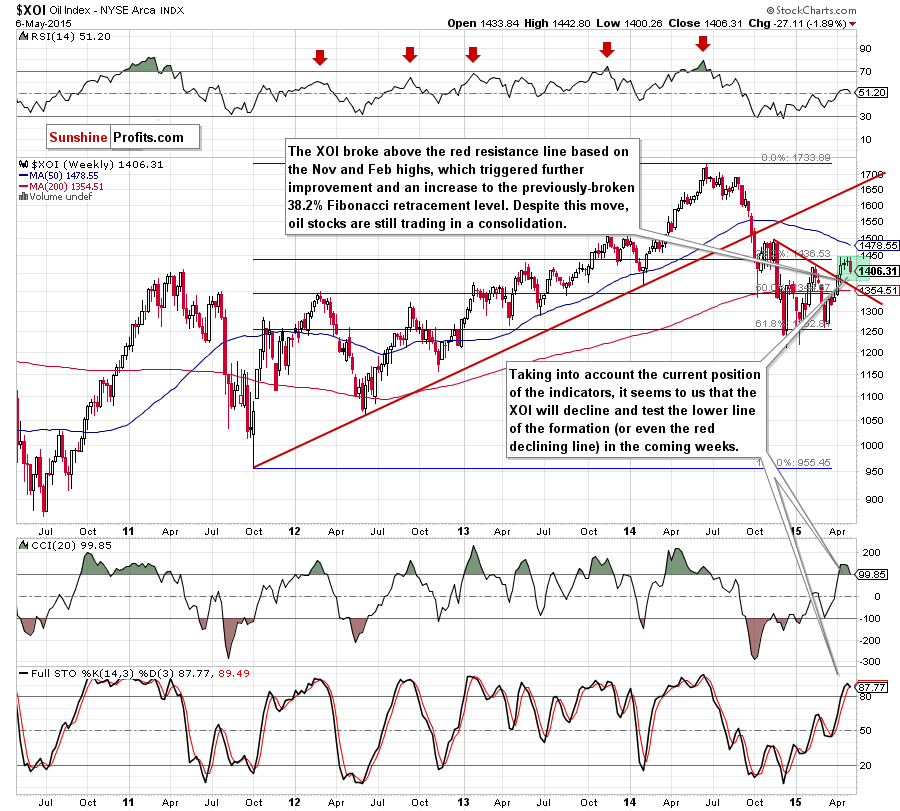
On the above chart, we see that the XOI broke above the medium-term red resistance line based on the Nov and Feb highs, which triggered further improvement and an increase to the previously-broken 38.2% Fibonacci retracement level. Despite this move, oil stocks are still trading in a consolidation (marked with green).
Although the XOI could go both north and south from here, we think that the current position of the indicators (the CCI and Stochastic Oscillator generated sell signals) will encourage oil bears to act in the coming week(s). If this is the case, the initial downside target would be the lower line of the formation around 1,375. If it is broken, we might see a drop to around 1,360, where the medium-term declining red line (which serves as a support now) is.
Having said that, let’s focus on the daily chart and find out what can we infer from it about future moves.
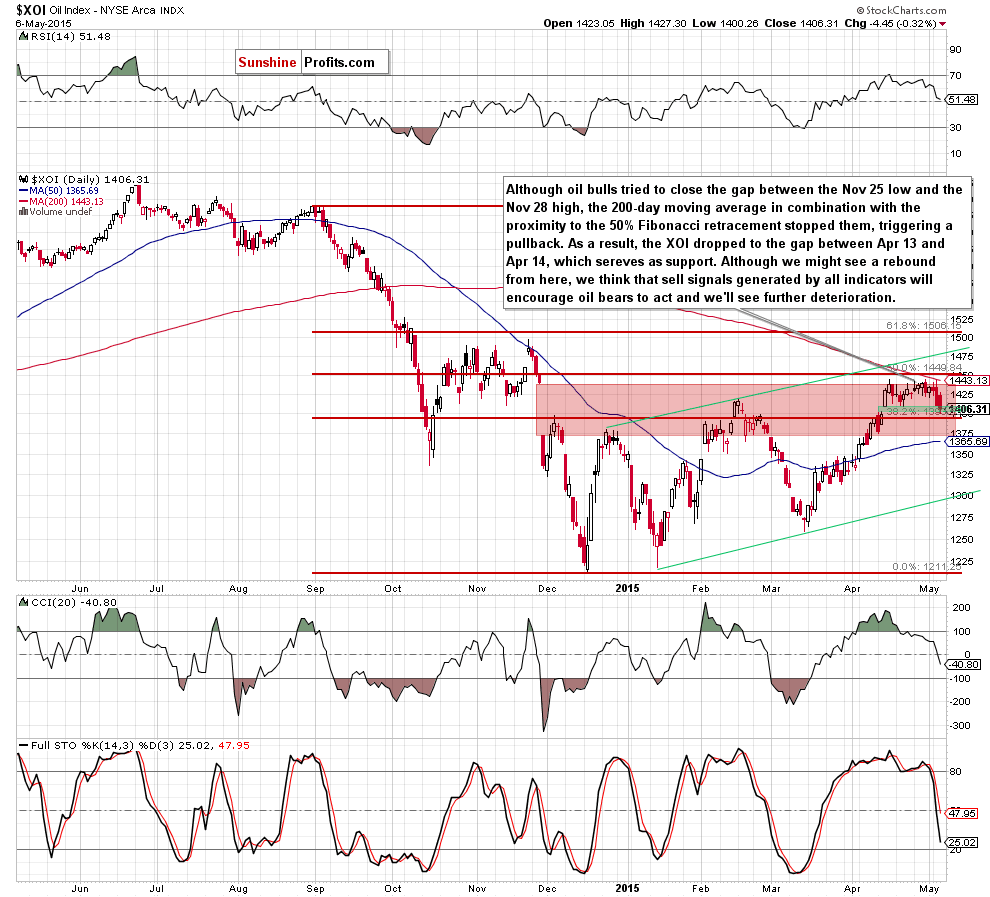
From this perspective, we see that although oil bulls tried to close the gap between the Nov 25 low and the Nov 28 high, the 200-day moving average in combination with the proximity to the 50% Fibonacci retracement level stopped them, triggering a pullback. As a result, the XOI reversed and declined to the green gap between the Apr 14 low and the Apr 13 high, which serves as support. Although we might see a rebound from here, we think that sell signals generated by the indicators in combination with the medium-term picture will encourage oil bears to act and we’ll see further deterioration.
If this is the case, the initial downside target would be around 1,365, where the 50-day moving average is. If this support is broken, the next downside target would be the 38.2% Fibonacci retracement based on the entire Dec-Apr rally (around 1,355), 50% retracement (around 1,327) or even 61.8% retracement (around 1,300), which currently intersects the green support line based on the Jan and March lows.
Before we summarize this section, let’s take a look at the relation between oil stocks and the general stock market. Will it confirm the above bearish scenario?
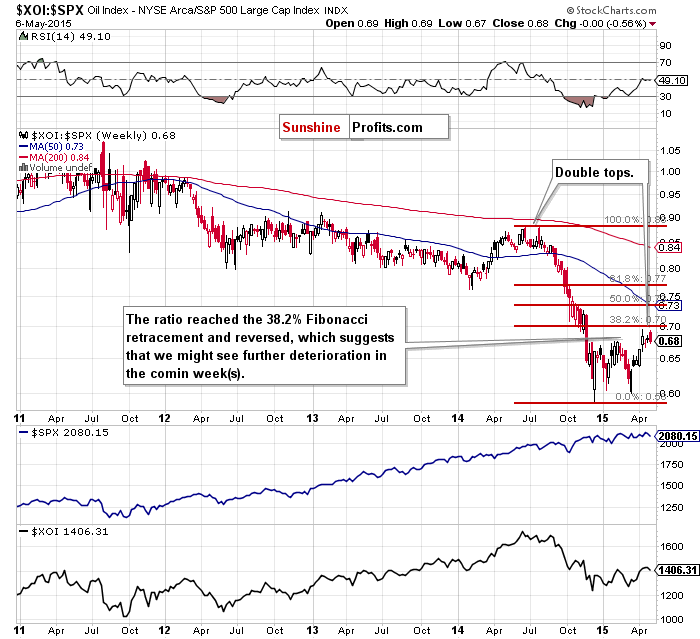
As you see on the chart, the ratio reached the 38.2% Fibonacci retracement and reversed, which suggests that we might see further deterioration in the coming week(s). Additionally, we can notice a double top formation. We saw similar situation in Aug. Back then, a double top formation preceded a sharp and significant decline, which suggests that lower values of the ratio (and also oil stocks) are ahead us.
Can we infer something more about future oil stocks’ moves from the inverse of this ratio? Let’s check.
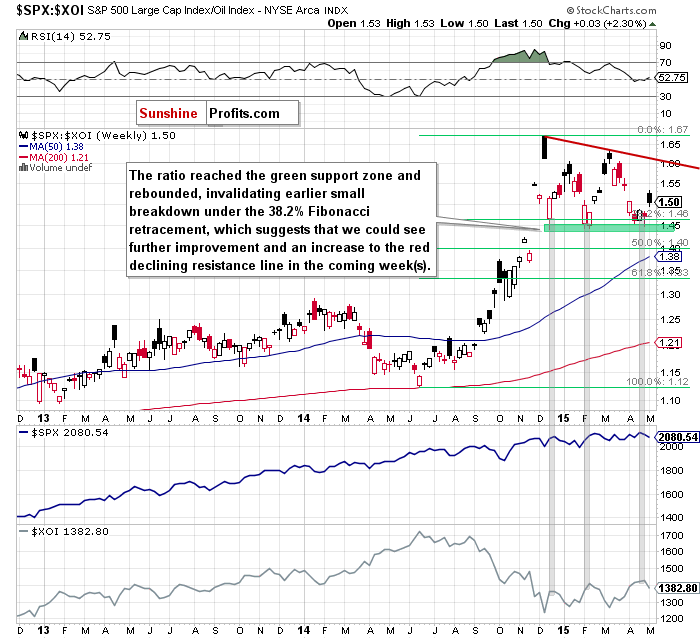
From this perspective, we see that the ratio bounced off the green support zone once again. In previous cases, local bottoms in the ratio have corresponded to local tops in the XOI. Therefore, we believe that further improvement in the ratio (and an increase to the red declining resistance line) will push oil stocks lower in the coming weeks.
Summing up, although the XOI is trading in a narrow range (the consolidation marked on the weekly chart), we think that the current position of weekly and daily indicators in combination with the situation in the XOI:SPX ratio (and its inverse) will encourage oil bears to act and translate to lower values of the XOI in the coming weeks.
Ratio Analysis
Once we know the current situation in crude oil and oil stocks, let’s focus on the relationship between them. What can we infer from the chart below?
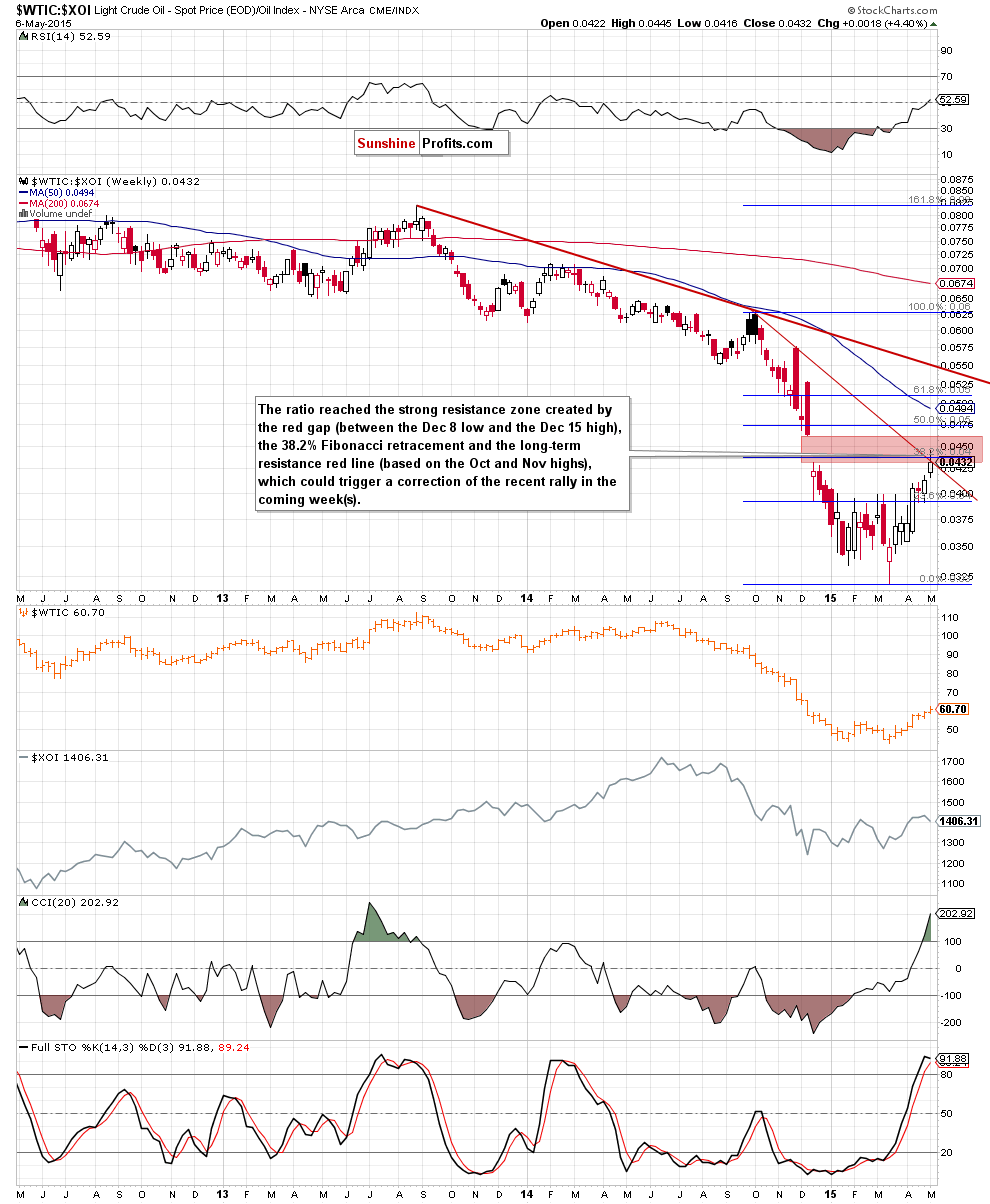
Looking at the above chart, we see that the ratio moved higher in the previous weeks and reached the strong resistance zone created by the red gap (between the Dec 8 low and the Dec 15 high), the 38.2% Fibonacci retracement and the long-term red resistance line (based on the Oct and Nov highs), which could trigger a correction of the recent rally in the coming week(s). If this is the case, lower values of the ratio will likely translate to a pullback in light crude – similarly to what we saw in the previous months.
In our previous Oil Investment Update we examined the oil-to- stocks ratio (a reverse head and shoulders formation triggered further improvement in the ratio and higher values of crude oil). Today, we decided to check whether we can infer something more about future crude oil’s moves from the ratio's inverse or not.
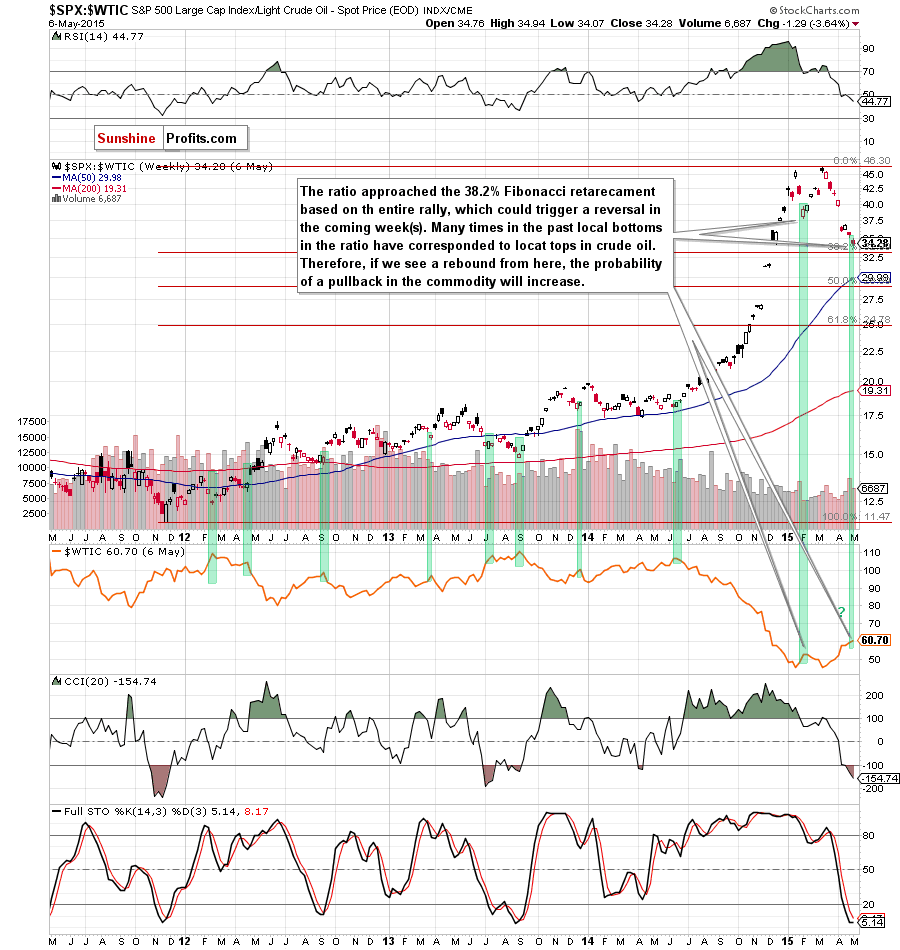
From this perspective, we see that the ratio approached the 38.2% Fibonacci retracement based on the entire rally, which could trigger a reversal in the coming week(s). As you see on the above chart, many times in the past (we marked them with green) local bottoms in the ratio have corresponded to local tops in crude oil. Therefore, if we see a rebound from here, the probability of a pullback in the commodity will increase.
Once we know the current situation in the stocks-to-oil ratio, let’s analyze the oil-to-gold ratio.
A month ago, we wrote the following:
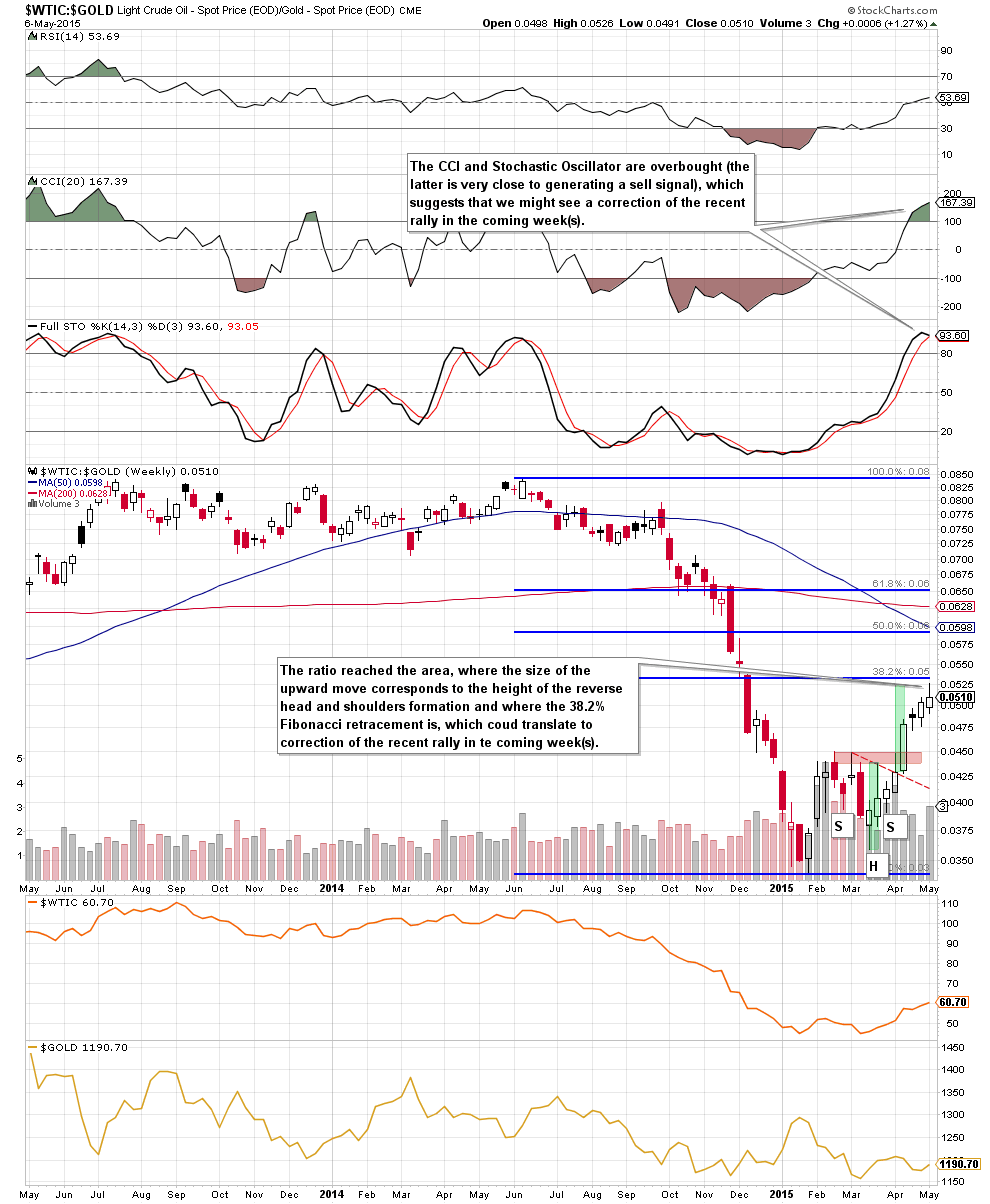
Looking at the oil-to-gold weekly chart, we can also see a potential pro-growth formation. However, (…) further rally will be likely only if we see a successful breakout above the red resistance zone created by the Feb and Mar highs. If we see such price action, it would be a strong bullish signal, which will trigger a rally to around 0.0525, where the size of the upward move will correspond to the height of the formation and where the 38.2% Fibonacci retracement based on the Jun-Jan declines are (please note that buy signals generated by the indicators still support the above-mentioned bullish scenario).
As you see on the chart, the situation developed in line with the above scenario and the ratio reached our upside target. Taking into account the current position of the indicators (the CCI and Stochastic Oscillator are overbought (the latter is very close to generating a sell signal) and the Fibonacci resistance level, it seems to us that we might see a correction of the recent rally in the coming week(s). If we see such price action, crude oil will likely also move lower – similarly to what we saw in the past.
However, to have a more complete picture of the relationship between crude oil and gold, we also decided to examine the reversal of the above-described ratio. Will we receive any valuable clues about future moves? Let’s find out.
Quoting our last commentary on this ratio:
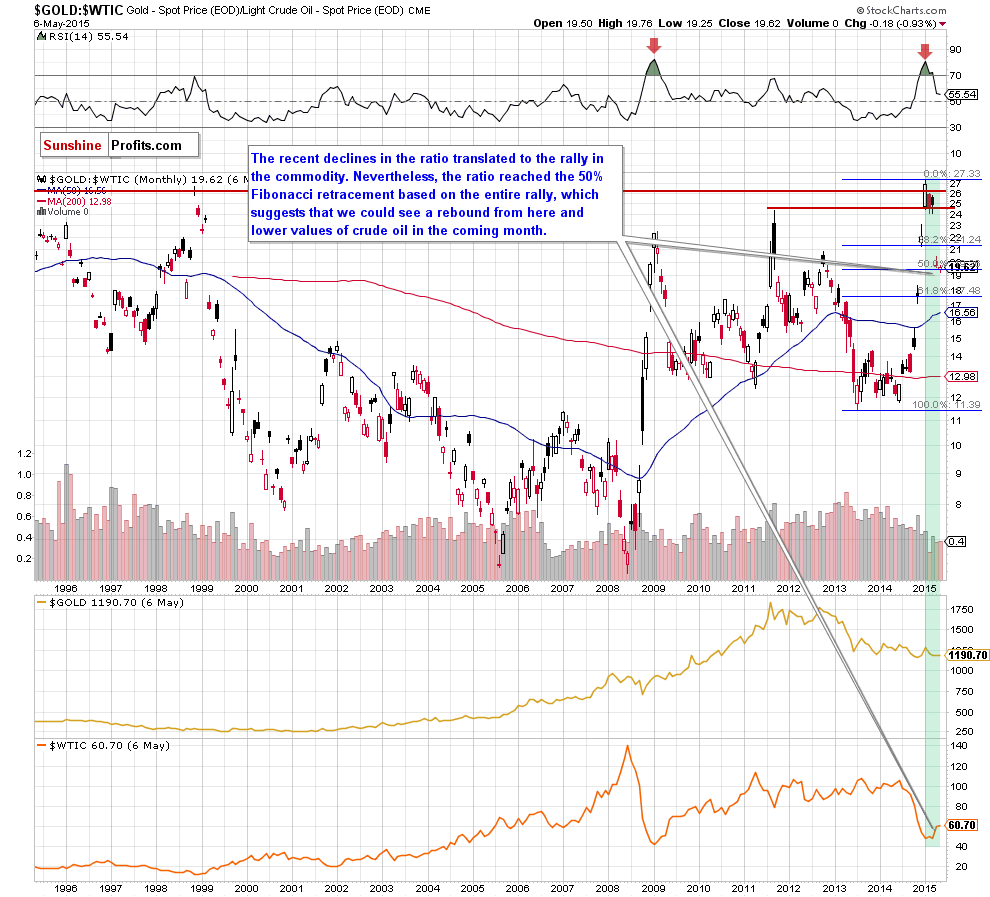
(…) the ratio declined under the 2011 high once again. Taking this invalidation of the breakout into account and combining it with the sell signal generated by the RSI, we think that further deterioration in GOLD:WTIC in the coming month is more likely than not. If this is the case, we’ll see higher prices of crude oil in the coming weeks.
Looking at the above chart, we see that the ratio moved lower (as we had expected), which translated to rally in the commodity. Nevertheless, the ratio reached the 50% Fibonacci retracement based on the entire 2013-2015 rally, which suggests that we could see a rebound from here, which will push crude oil lower in the coming month.
Non-USD Crude Oil Price
Know the situation for the above ratios, let’s move on to the non-USD (WTIC:UDN ratio) chart of crude oil. As a reminder, UDN is the symbol for the PowerShares DB US Dollar Index Bearish Fund, which moves in the exact opposite direction to the USD Index. Since the USD Index is a weighted average of the dollar's exchange rates with world's most important currencies, the WTIC:UDN ratio displays the value of crude oil priced in "other currencies".
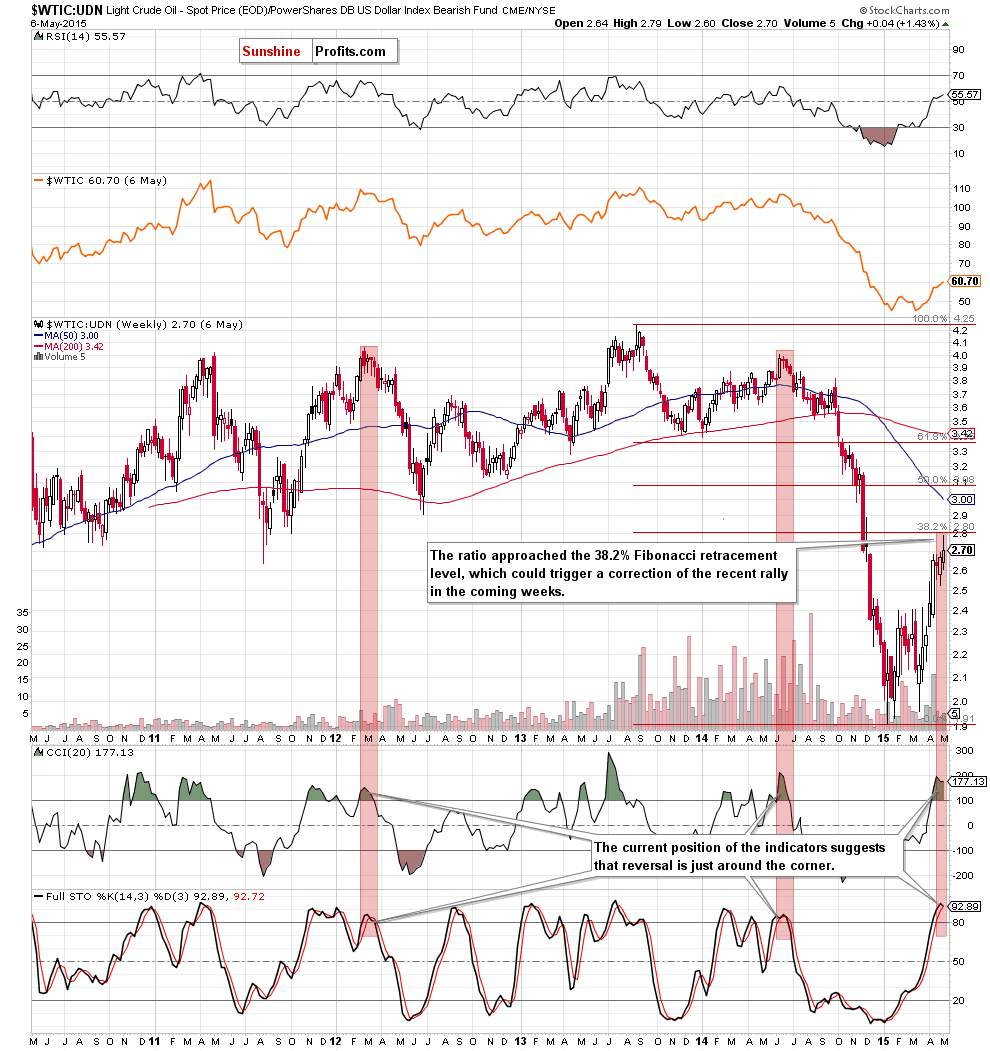
As you see on the weekly chart, the ratio moved higher in the recent weeks and approached the 38.2% Fibonacci retracement level based on the entire Aug-Jan decline. Taking this resistance level into account, and combining it with the current position of the indicators (the CCI and Stochastic Oscillator are extremely overbought), we think that correction of the recent rally is just around the corner (please note that similar readings of these indicators have preceded declines in the past, which increases the probability of reversal).
Scenarios
Just like a month ago, today’s Oil Investment Update includes scenarios of what could happen in the coming weeks. Naturally, we will continue to monitor the market in the coming days and if anything invalidates our long-term outlook we will send you an additional message.
- Bullish scenario
If crude oil breaks above the major resistance zone created by the long-term blue resistance line and the 200-month moving average (marked on the monthly chart), it would be a strong bullish signal, which will trigger further improvement and an increase to the initial upside target around $67, where the 38, 2% Fibonacci retracement based on the entire Jun-Jan declines is. If it is broken, the next target for oil bulls would be around $75 (the 50% Fibonacci retracement and the 50-week moving average). - Bearish scenario
If the commodity declines below $60, and we see an invalidation of earlier breakout above the grey support lines (marked n the daily chart) and the red resistance zone (created by the Dec 15 and Dec 22 highs and seen on the weekly chart), it would be a negative signal, which will trigger a pullback to the green support zone created by the Feb highs ($54-$54.24). Please note that if this area is broken, the next targets would be around: $52.40 (the 50% Fibonacci retracement based on the entire Mar-May rally), $50 (the 61.8% retracement) or we might see a test of the Apr low of $47.
Summary
Although crude oil broke above the Feb and mid-Dec highs, hitting a fresh 2015 high of $62.58, the commodity still remains below the key resistance zone created by the long-term blue resistance line and the 200-month moving average. Yesterday, this area triggered a pullback, which resulted in an invalidation of small breakout above the 200-month moving average and a bearish gravestone candlestick pattern (marked on the daily chart). Additionally, declining size of volume that accompanied recent upward move (marked on the weekly chart) suggests that the rally might be running out of steam and correction is just around the corner. This scenario is also reinforced by the current position of the above-mentioned ratio, which reached important support/resistance levels (in all cases their reversals will translate to lower values of crude oil). Therefore, in our opinion, before we see further improvement in the oil market, the commodity will correct the recent rally.
Very short-term outlook: mixed with bearish bias
Short-term outlook: mixed
MT outlook: mixed
LT outlook: bullish
Trading position (our opinion):No positions are justified from the risk/reward perspective at the moment. We will keep you informed should anything change.
This completes this month’s Oil Investment Update. Our next Oil Investment Update is scheduled for Monday, June 8, 2015. Oil Trading Alerts subscribers will additionally receive similar but shorter alerts on a daily basis (or more than once a day when the situation requires it). You – Oil Investment Updates subscribers – will receive short Investment Alert messages should the outlook for the medium or long term change before the next Update is posted.
Thank you.
Nadia Simmons
Forex & Oil Trading Strategist
Oil Investment Updates
Oil Trading Alerts

