

In Dec crude oil lost over 18% as ongoing expectations of growing supplies and concerns over the pace of global growth weighed on the price. As a result, the commodity dropped below the 61.8% Fibonacci retracement (around $65 per barrel), which accelerated declines and took light crude to the support zone created by the 76.4% and 78.6% Fibonacci retracement levels (based on the entire 2009-2011 rally). Unfortunately for oil bulls the beginning of the year brought a breakdown under these levels, which resulted in a drop to the next support area created by the Apr 2009 lows. Will we see a rebound from here? Or maybe this is another pause before new lows?
Although it might seem that the decline in oil prices should give a boost to many economies (for example in the eurozone, which is a big energy importer), the current situation in currencies of oil-producing nations clearly shows that recent declines have more negative effects than positive. In Russia, where oil and gas exports account for about half of federal budget revenues, the ruble declined against the greenback to the lowest level in more than 10 years (although the Bank of Russia spent an additional $11.9 billion in December in an attempt to stop the ruble's decline). The Canadian dollar fell against its U.S. counterpart to its lowest level since May 2009, while the Norwegian krone declined against the euro to its lowest level since Dec 2008. As a result, oil-exporting nations have to struggling to balance their fiscal budgets at current oil prices. Additionally, at the beginning of the week, sharp drop in crude oil pushed lower stock markets around the word, fuelling fears about deflation. At this point, it’s also worth noting that Moscow's RTS stock index fell in Dec to the levels that we have seen for the last time in March 2009. On top of that, Standard & Poor's warned that it may consider to cut Russia's credit rating to below investment grade In January.
Despite this situation, the Organization of Petroleum Exporting Countries is not going to lower production to support the market. Instead, on Monday, Saudi Arabia, lowered the price of its benchmark light oil in the U.S. once again, which pushed the commodity below $50 for the first time since 2009. This move raised worries that kingdom may be trying to regain market share and push crude oil low enough that U.S. shale-oil production becomes unprofitable. Although some U.S. energy companies have already cut back on spending in response to low prices, in many cases, they have to keep producing because they need cash to repay their debts. Therefore, it’s hard to expect that production will slow from month to month, reducing supplies.
Despite these bearish circumstances, yesterday’s EIA weekly report showed that U.S. crude oil inventories decreased by 3.1 million barrels in the week ended January 2, beating expectations for an increase of 0.9 million barrels. Although it was bullish news for the commodity, the report also showed that supplies of refined petroleum products rose more than expected (gasoline inventories increased by 8.1 million barrels, above expectations for a gain of 3.4 million, while distillate stockpiles rose by 11.2 million barrels). This extraordinary build (the largest since August 1982) could be due to a moderate winter lowering heating-oil consumption, however, it raises worries that the glut of crude oil is turning into a glut of refined products. It also suggests that although the U.S. economy remained resilient amid slowing global growth, demand hasn't risen enough to absorb growing supplies. On top of that, oil supplies in Cushing, Okla. rose by 1.3 million barrels and stand now at their highest level since February 2014, which together stopped gains below the previously-broken level of $50. Will we see a comeback above it in the coming weeks? Before we try the answer to this question, let’s examine charts to find out what are they saying about future moves (charts courtesy of http://stockcharts.com).
Crude Oil
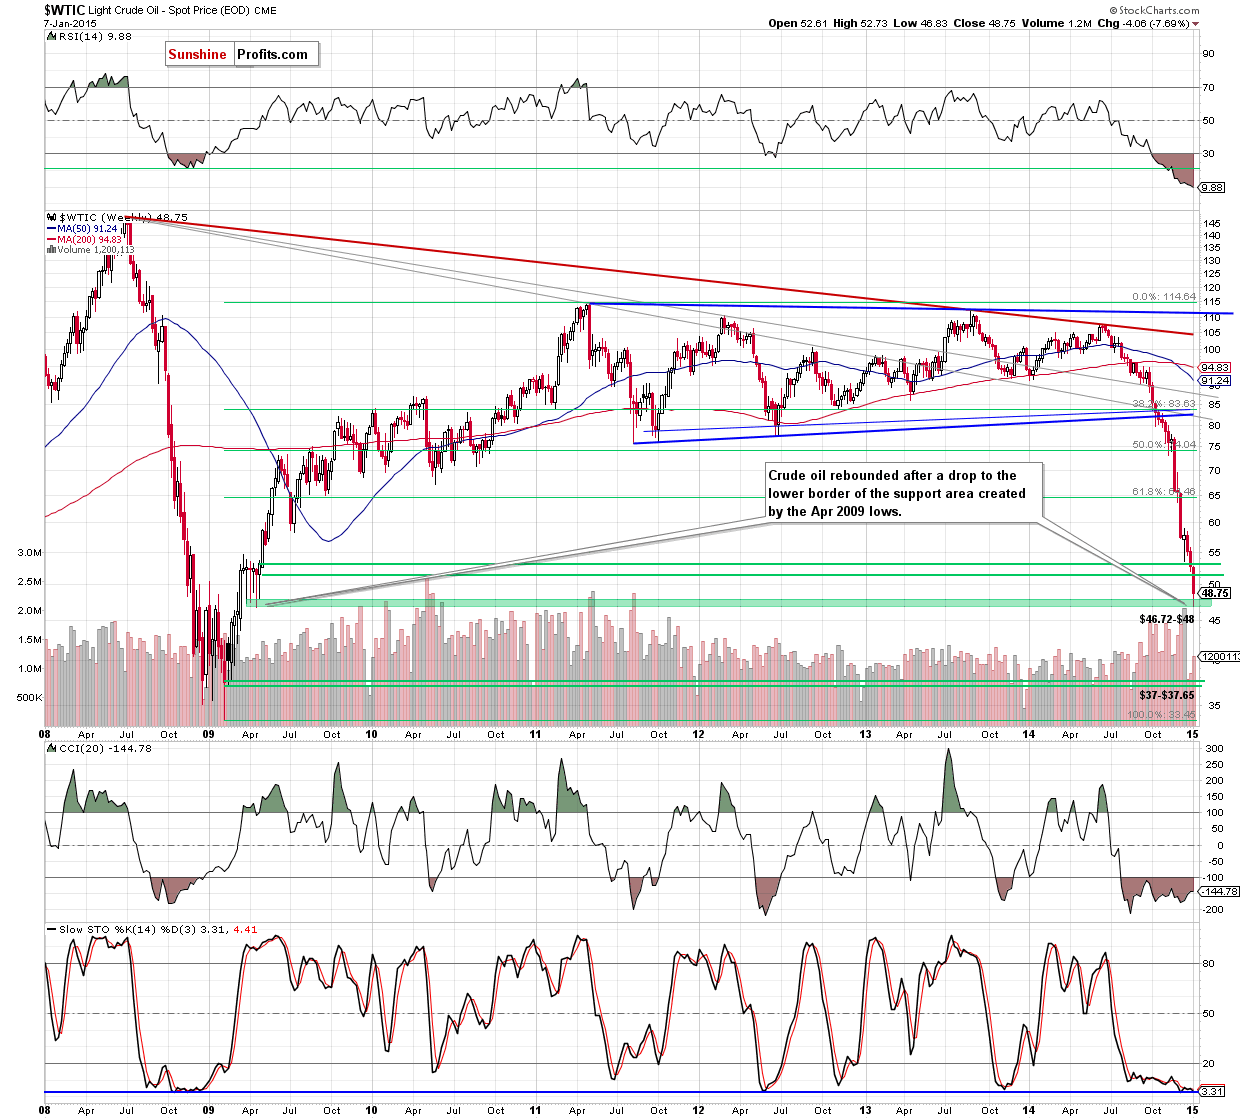
Looking at crude oil from the medium-term perspective, we see that the commodity rebounded after a drop to the lower border of the support zone (marked with green) created by the Apr 2009 lows. Although this is a positive signal, we should keep in mind that light crude is still trading below the previously-broken level of $50. What doest it mean for the commodity? Let’s take a closer look at the daily chart and find out.
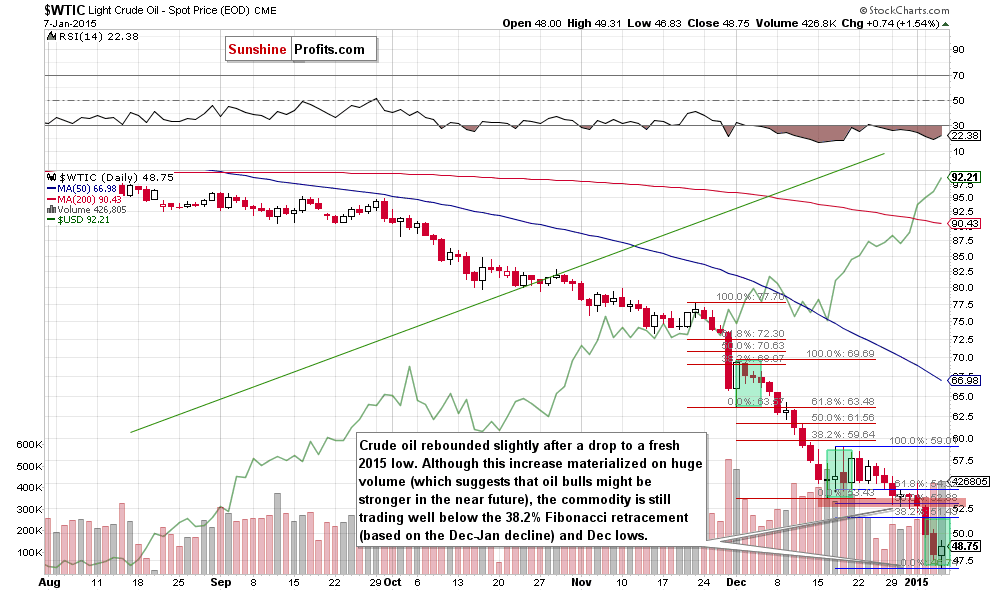
On the above chart, we see that although yesterday’s upswing materialized on huge volume (which suggests that oil bulls might be stronger in the near future), the commodity is still trading well below the 38.2% Fibonacci retracement (based on the Dec-Jan decline) and the Dec lows. As you see on the daily chart, we saw similar situation in mid-Dec. Back then, a rebound confirmed by huge volume resulted in a doji candlestick, which triggered only a short-lived corrective upswing that took crude oil to the first important Fibonacci resistance. Despite this increase, oil bulls were unable to push the commodity higher (similarly to what we noticed at the beginning of Dec), which translated to a fresh multi-year low. Taking all the above into account, we think that as long as there is no bigger upswing (bigger than $5.85, which won’t be followed by a fresh multi-year low) and a successful breakout above the 38.2% Fibonacci retracement (based on the Dec-Jan decline), a sizable upward move is not likely to be seen and another test of the lower border of the support zone (at $46.72) can’t be ruled out. At this point you may ask what could happen if light crude drops below this support. In our opinion, the best answer to this question will be the long-term chart.
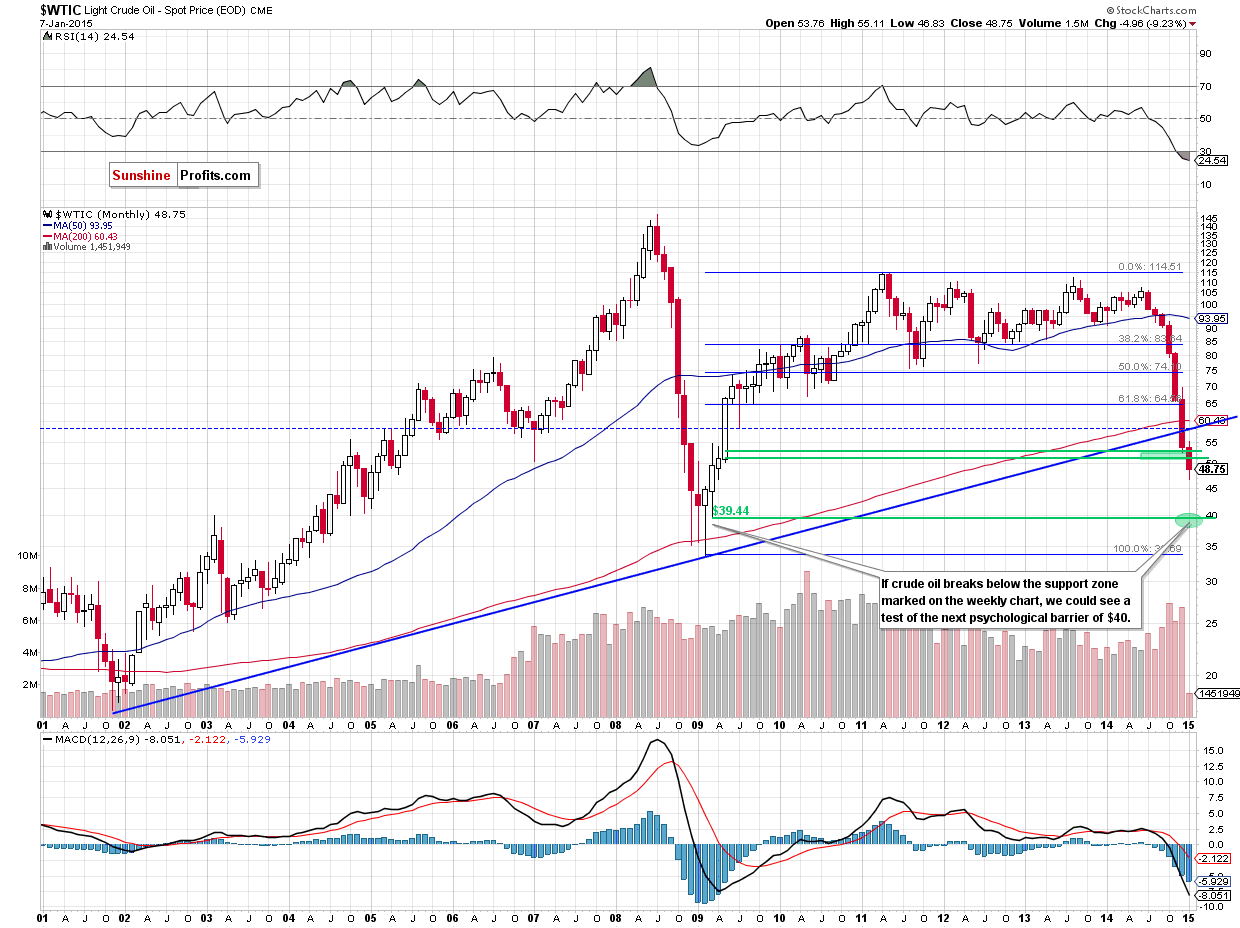
As you see on the monthly chart, if crude oil extends losses, we could see a test of the strength of the next psychologically important barier of $40 in the coming month (this area is supported by the Mar 2009 low of $39.44).
Will we see fresh lows? Before we try to answer this question, we’ll analyze the current situation in the oil stocks index and examine interesting ratios to have a more complete picture of the oil market.
Summing up, crude oil moved lower once again and almost touched the lower border of the support zone based on the Apr lows. Despite this drop, the commodity rebounded later in the day, but is still trading below the 38.2% Fibonacci retracement (based on the Dec-Jan decline) and the Dec lows. Taking this fact into account, and combining it with price action that we saw in the previous month (two unsuccessful attempts to break above this first important Fibonacci resistance), we believe that as long as there is no bigger upswing (bigger than $5.85, which won’t be followed by a fresh multi-year low) and a successful breakout above the 38.2% Fibonacci retracement, a sizable upward move is not likely to be seen and another test of the lower border of the support zone (at $46.72) can’t be ruled out.
Having discussed the situation in crude oil, let’s examine the NYSE Arca Oil Index (XOI) to find out what the current outlook for oil stocks is.
Oil Stocks
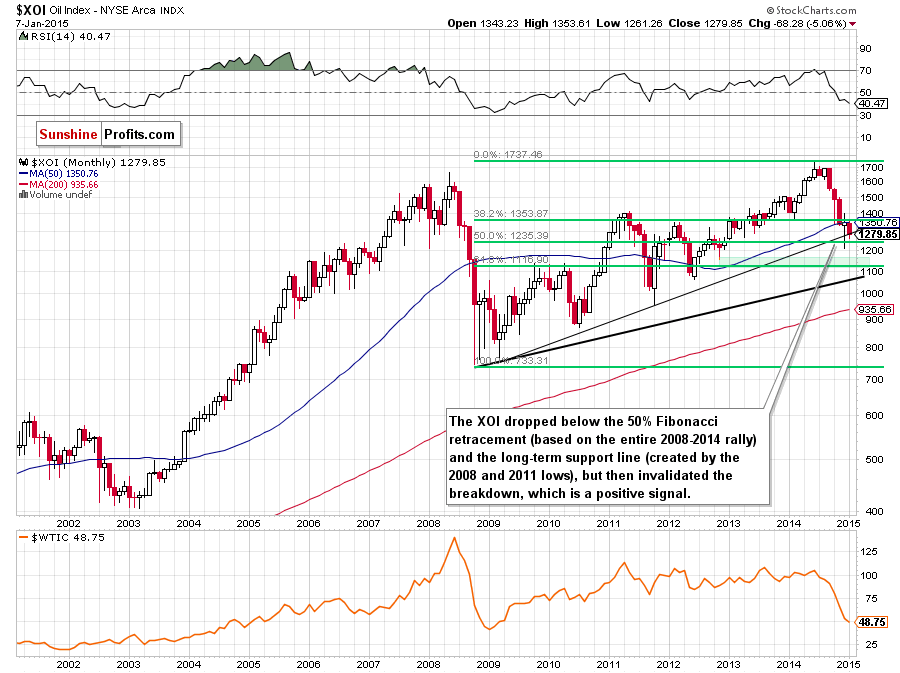
From the long-term perspective, we see that the XOI moved sharply lower in Dec, which resulted in a fresh multi-month low of 1,211. Despite this deterioration, the proximity to the psychologically important barrier of 1,200 triggered an upward move, which invalidated earlier breakdown below the 50% Fibonacci retracement (based on the entire 2008-2014 rally). With this increase, oil stocks invalidated also the breakdown under the long-term support/resistance line (based on the Mar 2009 and Oct 2011 lows), which is an additional positive sign. At this point, it’s worth noting that although oil bulls received these events, the previously-broken 50-month moving average in combination with the 38.2% Fibonacci retracement (based on the entire 2008-2014 rally) stopped further improvement, triggering a pullback. As you see on the above chart, this move took the XOI to the long-term support/resistance line once again, which suggests that we could see a rebound from here – similarly to what we saw in the previous month. If this is the case, and oil stocks climb above the last month’s resistance zone, we’ll see further improvement.
How high could the XOI go? Let’s examine the weekly chart and look for more clues about future moves.
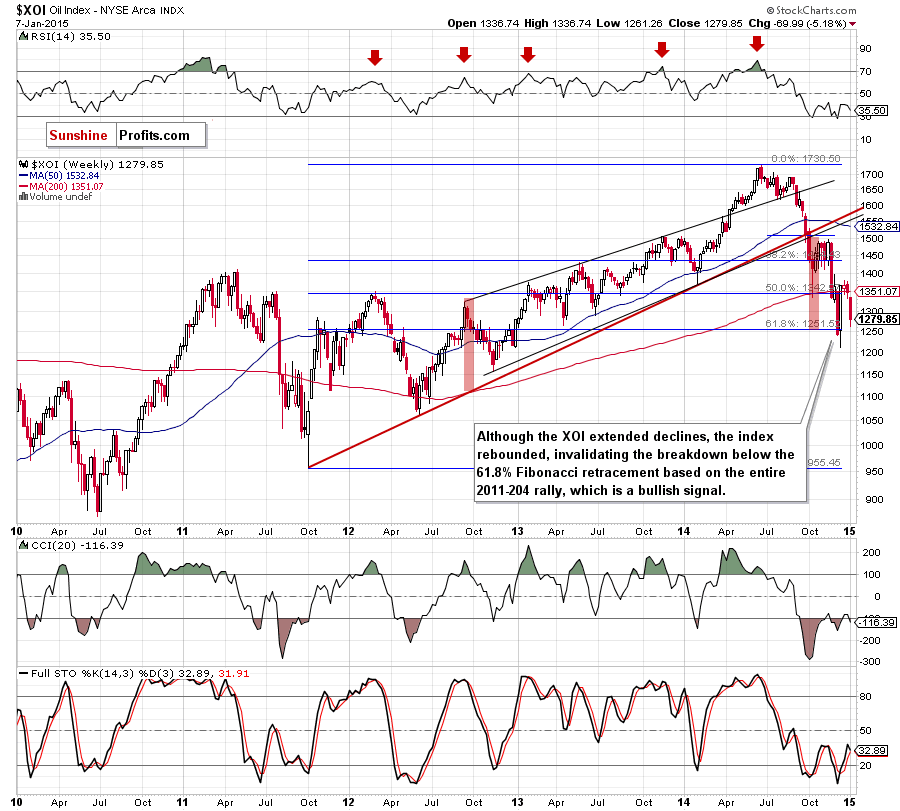
The first thing that catches the eye on the above chart is an invalidation of the breakdown below the 61.8% Fibonacci retracement (based on the 2011-2014 increase). Although this is a bullish signal, we should keep in mind that the XOI slipped below the 200-week moving average, which took the index to the 70.7% Fibonacci retracement (based on the Dec increase). With this move, oil stocks approached the 61.8% Fibonacci retracement (based on the 2011-2014 rally) once again, which could result in a rebound in the coming week(s). If this is the case, the initial upside target would be the resistance zone created by the Dec 22 high and the 200-week moving average (around 1,351-1,380). What could happen if the XOI breaks below Dec low? In our opinion, we’ll likely see a test of the support zone (marked on the monthly chart) created by the Nov 2012 and the 61.8% Fibonacci retracement based on the 2008-2014 rally (around 1,117-1,155).
Having say that, let’s focus on the daily chart.
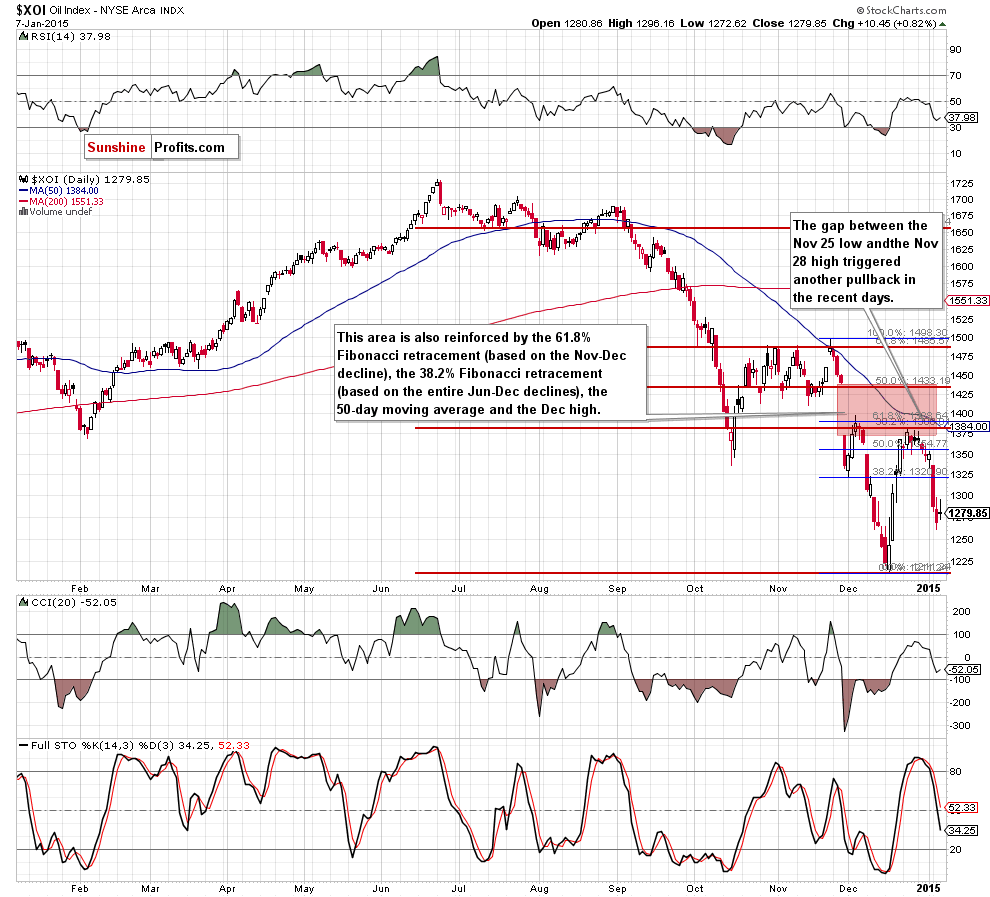
As you see on the above chart, the combination of the 38.2% Fibonacci retracement (based on the Jun-Oct decline), the 61.8% Fibonacci retracement (based on the Nov-Dec decline), the 50-day moving average and the Dec 3 high was strong enough to stop the last month’s rally from the 2014 low and trigger a sharp decline in the XOI. As a result, the index slipped to the above-mentioned 70.7% Fibonacci retracement. Please note that even if oil stocks do not rebound immediately (which seems quite likely when we factor in sell signal generated by the Stochastic Oscillator), we think that the support area (created by the 76.4% and 78.6% Fibonacci retracement levels) around 1,247-1250 will stop further deterioration in the coming days. If this is the case, the XOI will rebound and test the resistance zone marked on the above chart with red.
Before we summarize this part of Oil Investment Update, we would like to draw your attention to the stocks-to-oil stocks ratio.
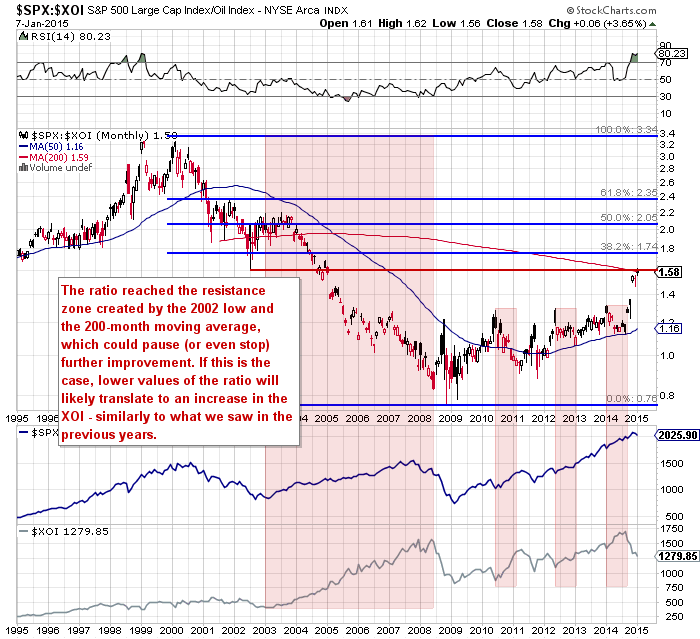
Looking at the above chart, we see that the raio reached the resistance zone created by the 2002 low and the 200-month moving average, which could pause (or even stop) further improvement. What could happen if we see such price action? When we take a closer look at the monthly chart, we see that declining ratio has translated to higher values of the XOI in the past. We saw such relation between 2003 and 2008, from Jun 2010 to Mar 2011, from May 2012 to Jan 2013and from Jan 2014 to Aug 2014. Taking this fact into account, we think that a downward move from here would support the XOI and trigger a rebound in oil stocks in the coming month.
Summing up, although oil stocks moved lower in recent days, the XOI is still trading above the support zone created by the 76.4% and 78.6% Fibonacci retracement levels based on the Dec rally (marked on the daily chart), the 61.8% Fibonacci retracement based on the 2011-2014 increase (marked on the weekly chart) and the long-term support/resistance line (based on the Mar 2009 and Oct 2011 lows. Additionally, the stocks-to-oil stocks ratio reached the strong resistance zone, which could translate to lower values of the ratio and rebound in oil stocks prices in the coming month.
Ratio Analysis
Today, we start this section by focusing on the oil-to-oil stocks ratio. What can we infer from the chart below?
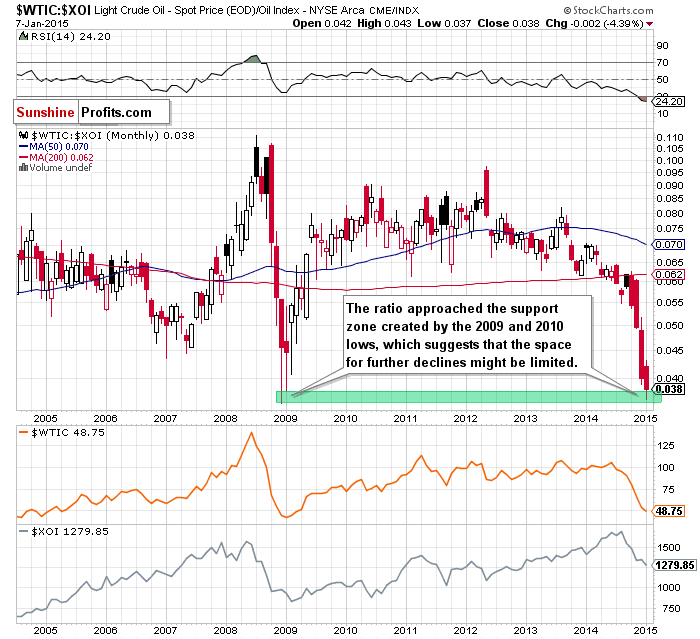
On the above chart, we see that the ratio approached the support zone created by the 2009 and 2010 lows, which suggests that the space for further declines migt be limited. If this is the case, and the ratio rebounds from this area, we could see a post double-bottom rally, which will translate to higher values of crude oil and oil stocks in the coming month.
Having say that, let’s examine the relationship between the general stock market and crude oil to check if it confirms or invalidates the conclusions of the above analysis of the oil-to-oil stocks ratio.
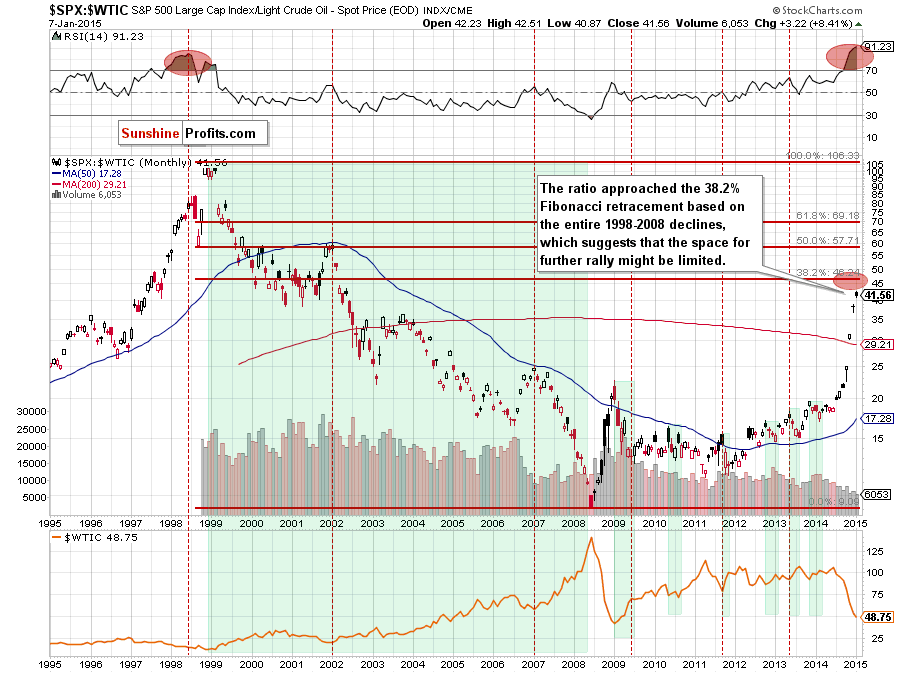
From this perspective, we see that the ratio approached the 38.2% Fibonacci retracement based on the entire 1998-2008 declines, which suggests that the space for further rally might be limited. If this is the case, and the ratio finally declines, we’ll see higher values of the commodity – similarly to what we saw in the past (for example between 1999 and 2008, from Jan 2009 to Jun 2009, from May 2010 to Apr 2011, from Sep 2011 to Nov 2011, from Oct 2012 to Jan 2013, from May 2013 to Aug 2013 and from Nov 2013 to Feb 2014). Taking all the above into account, we believe that it’s worth to keep an eye on this ratio’s moves because a reversal in the ratio will probably indicates a final bottom in crude oil.
Are there any other interesting ratios that could give us any interesting clues about future moves in crude oil? Let’s analyze the gold-to-oil ratio and find out.
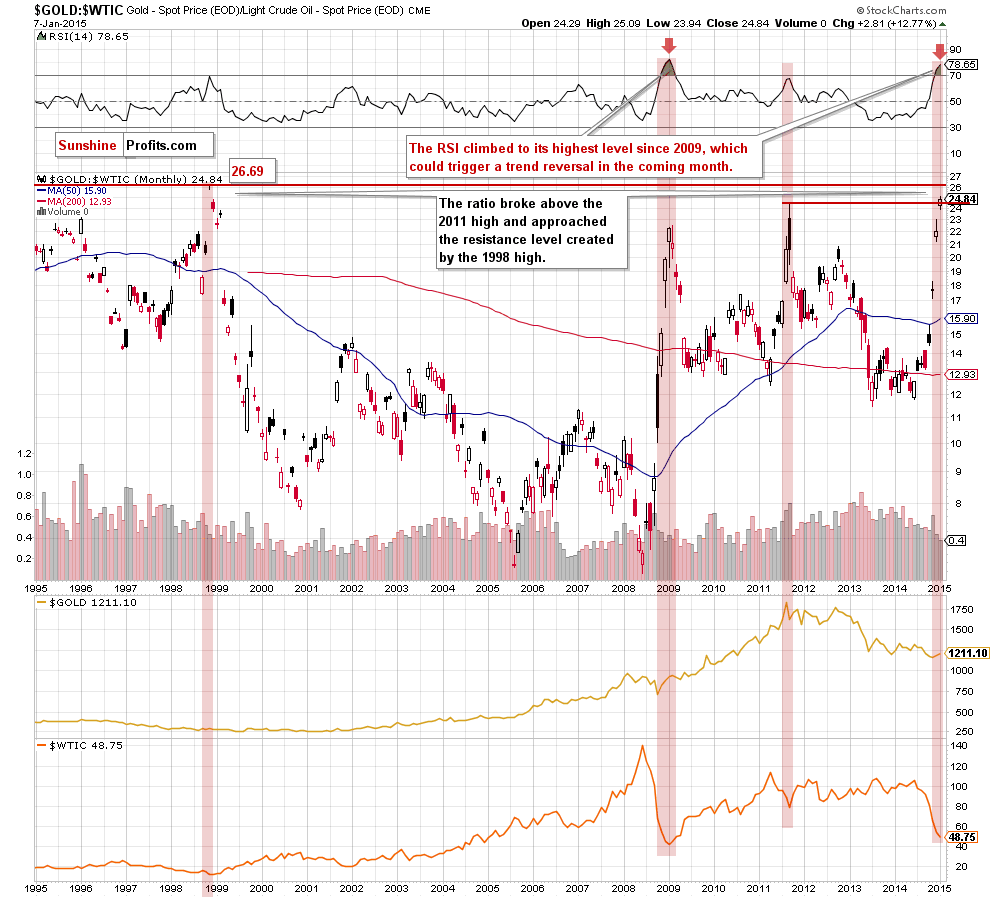
As you see on the monthly chart, the ratio broke above the 2011 high and approached the resistance level created by the 1998 high, which could pause (or even stop) further improvement and trigger a bigger correction in the ratio in the coming weeks. This scenario is currently reinforced by the position of the RSI, which climbed to its highest level since 2009. In the previous years, similar (or even lower) readings of the indicator preceded tops in ratio and local bottoms in crude oil. Therefore, as we have pointed out before, it seems to us that the next move in the ratio will be to the downside, which will push crude oil higher.
Non-USD Crude Oil Price
Know the situation for the above ratios, let’s move on to the non-USD (WTIC:UDN ratio) chart of crude oil. As a reminder, UDN is the symbol for the PowerShares DB US Dollar Index Bearish Fund, which moves in the exact opposite direction to the USD Index. Since the USD Index is a weighted average of the dollar's exchange rates with world's most important currencies, the WTIC:UDN ratio displays the value of crude oil priced in "other currencies".
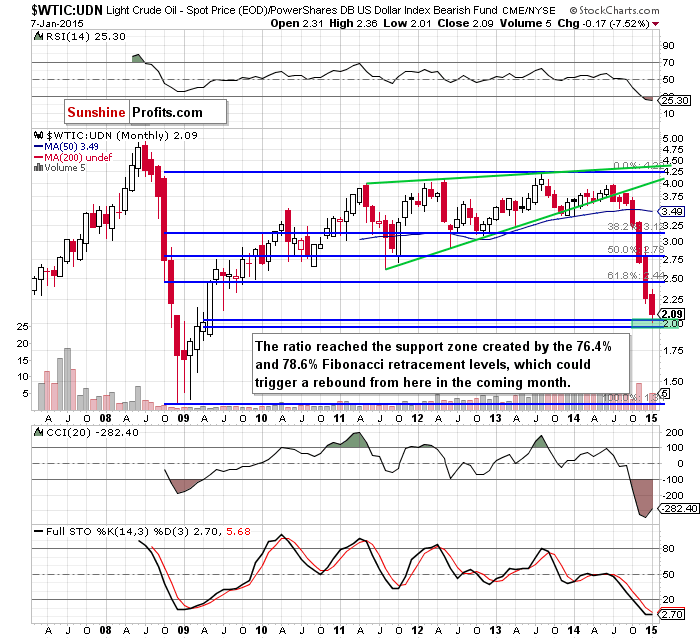
On the above chart, we see that the ratio reached the support zone created by the 76.4% and 78.6% Fibonacci retracement levels (marked with green). In the past, this support/resistance area was strong enough to trigger a trend reverssal. We saw such price action, for example, in Jun 2012 or in Aug 2013 (both marked with red ellipses). Taking this fact into account, and combining it with the current position of the RSI, which dropped to the lowest level since 2009, we thing that another trend reversal is just around the corner and we could see a rebound in crude oil in the coming month.
Crude Oil - US Dollar Link
Before we summarize today’s Oil Investment Update, we would like to draw your attention to the current situation in the USD Index as the U.S. dollar was one of the major forces, which affected the price of the commodity in recent weeks.
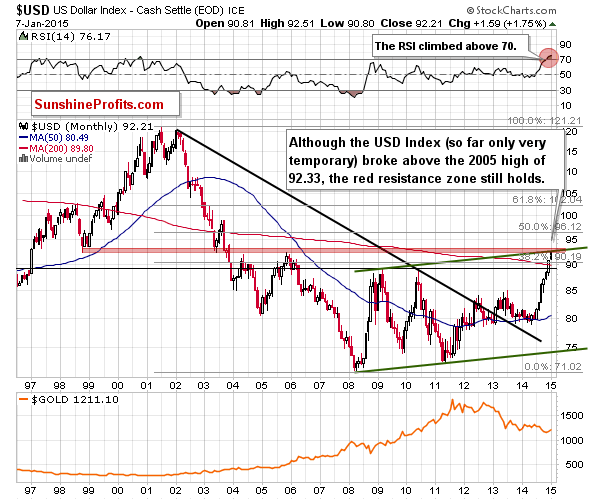
From today’s point of view, we see that although the negative correlation between the commodity and the U.S. currency resulted in a fresh multi-year low in crude oil, the USD Index reached the strong resistance area. As you see, although the U.S. currency climbed above the 2005 high of 92.33 (the breakout was invalidated on the daily basis), the red resistance zone in combination with the long-term resistance line (parallel to the long-term support line based on the 2008 and 2011 lows) still keeps gains in check. In our opinion, this suggests that we will either see a local top in the USD Index very soon or that it’s already in. What does it mean for crude oil? If the index moves lower from here, we’ll likely see a rebound in crude oil as a weaker U.S. dollar makes the commodity less expensive for buyers in other currencies.
Scenarios
Just like a month ago, today’s Oil Investment Update includes scenarios of what could happen in the coming weeks. Naturally, we will continue to monitor the market in the coming days and if anything invalidates our long-term outlook we will send you an additional message.
- Bullish scenario
The solid support zone created by the Apr 2010 lows will stop further deterioration, which will translate to higher crude oil’s prices. In this case, we’ll see a bigger corrective upward move from here to the initial upside target around $59. If mid-Dec highs are broken, the next target for oil bulls would be around $70, where the Dec high and the 38,2% Fibonacci retracement (based on the entire Jun-Jan declines) are. - Bearish scenario
If the commodity extended losses and broke below the above-mentioned support zone, we could see a drop even to around $40, where the next psychologically important barrier is.
Summary
The overall situation in crude oil has deteriorated significantly as the commodity declined below the 61.8% Fibonacci retracement (based on the entire 2009-2011 rally), which opened the way down to the support zone created by the 76.4% and 78.6% Fibonacci retracement levels. Unfortunately for oil bulls the beginning of the year brought a breakdown under these levels, which resulted in a drop to the next support area created by the Apr 2009 lows. As we have pointed out before, this is a very important zone, because a breakdown below it will open the way to the psychological barrier of $40 per barrel. Therefore, it seems to us that oil bulls will not give up without a fight at current levels, which would likely translate to higher values of the commodity in the coming month. This scenario is supported by the current situation in the ratios. The oil-to-oil stocks ratio approached the support zone created by the 2009 and 2010 lows, the stocks-to-oil ratio climbed close to the 38.2% Fibonacci retracement based on the entire 1998-2008 declines, the gold-to-oil ratio approached the resistance level created by the 1998 high, while the WTIC:UDN ratio reached the support zone created by the 76.4% and 78.6% Fibonacci retracement levels. All the above suggests that the space for further moves (up or down depending on the ratio) might be limited and we could see trend reversals in all ratios, which will likely translate to higher values of the commodity – similarly to what we saw in the past. Therefore, we believe that it’s worth to keep an eye on them because such reversals will probably indicates final bottom in crude oil. On top of that, the USD Index climbed to the strong resistance zone, which suggests that we will either see a local top in the U.S. currency very soon or that it’s already in. In other words, if the greenback moves lower, it will make the commodity less expensive for buyers in other currencies, which will be supportive for the price.
Very short-term outlook: mixed
Short-term outlook: mixed
MT outlook: mixed
LT outlook: bullish
Trading position (our opinion): No positions are justified from the risk/reward perspective at the moment. However, if we see a bigger upswing (bigger than $5.85, which won’t be followed by a fresh multi-year low) and a successful breakout above the 38.2% Fibonacci retracement (based on the Dec-Jan declines), we’ll consider opening long positions. Until this time, waiting on the sidelines for the confirmation/invalidation of the above is the best choice. We will keep you informed should anything change.
This completes this month’s Oil Investment Update. Our next Oil Investment Update is scheduled for Thursday, Feb 5, 2015. Oil Trading Alerts subscribers will additionally receive similar but shorter alerts on a daily basis (or more than once a day when the situation requires it). You – Oil Investment Updates subscribers – will receive short Investment Alert messages should the outlook for the medium or long term change before the next Update is posted.
Thank you.
Nadia Simmons
Forex & Oil Trading Strategist
Oil Investment Updates
Oil Trading Alerts

