

Although OPEC and some non-OPEC producers extended an agreement to cut production until March 2018 at the end of the previous month, the price of the commodity reversed and declined under the barrier of $50. Without a doubt, market participants were disappointed that producers hold the cut at 1.8 million bpd – especially when we take into account the fact that the earlier production-cut deal didn’t bring expected impact on global inventory levels. Why? Such situation was mostly caused by growing U.S. drilling activity. The latest Baker Hughes’ report showed that U.S. drillers added rigs for the 20th week in a row, which took the drilling recovery to the highest level since mid-April 2015.
At this point it is also worth noting that although crude oil inventories dropped 6.4 million barrels, exceeding the 4.4 million-barrel drop forecast (which of course is a bullish development by itself if we do not take into account other factors), U.S. crude production was up by nearly 500,000 barrels per day from year-earlier levels and hit 9.34 million bpd, which was the highest level since August 2015.
You should not forget that the U.S. government also reported record exports of 1.3 million barrels of crude oil per day last week - just a half million barrels less than the cuts OPEC and Russia agreed to make to daily production.
Additionally, last Thursday’s President Donald Trump's withdrawal from the Paris climate agreement raised worries that U.S. oil production could expand more rapidly than it is currently. In this environment, light crude extended losses and closed Friday’s session not only under important levels, but also below $48 for the first time since mid-May. Will we see further deterioration and a comeback to the barrier of $40 in the coming weeks? Let’s jump right into the charts (charts courtesy of http://stockcharts.com) and try to find an answer to this important question.
Crude Oil
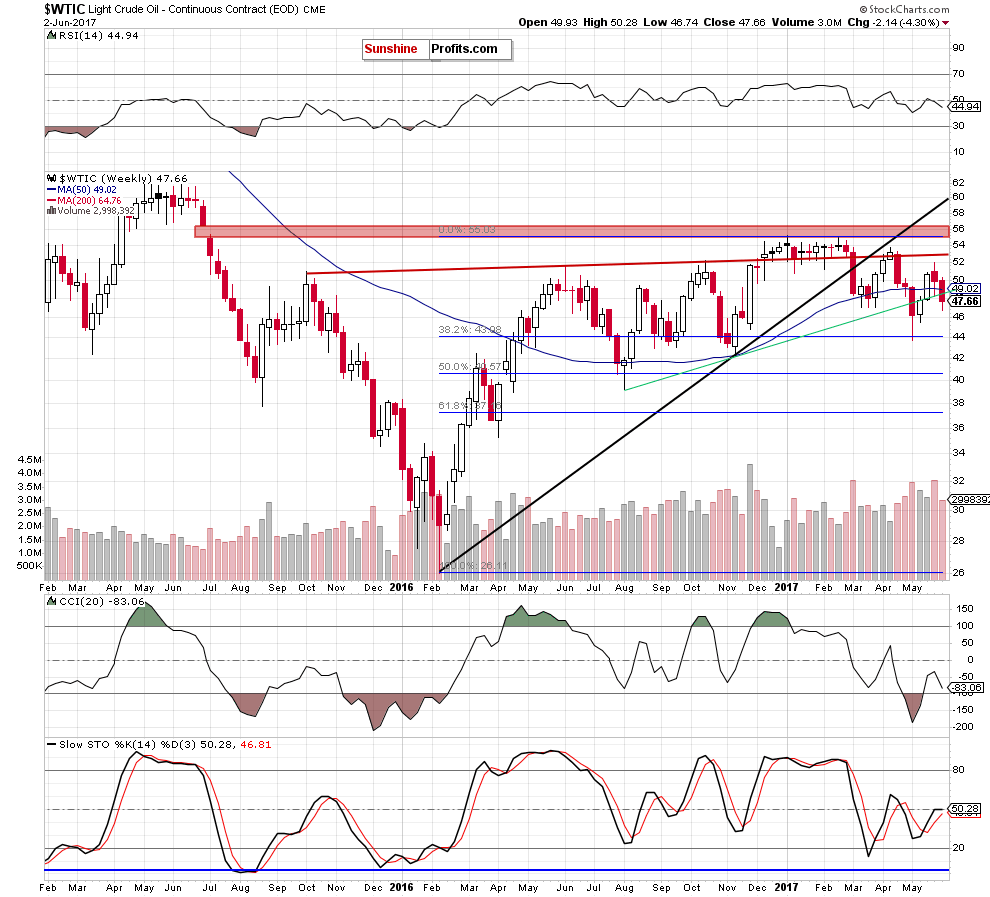
Looking at the medium-term chart, we see that crude oil broke below the green support line based on the August and November lows and closed the week below it, which is a negative event, which could trigger an acceleration of declines and a re-test of the strength of the 38.2% Fibonacci retracement based on the entire February-January upward move in the coming week(s).
Will the very short-term picture of the commodity give us more bearish signals? Let’s examine the daily chart and find out.
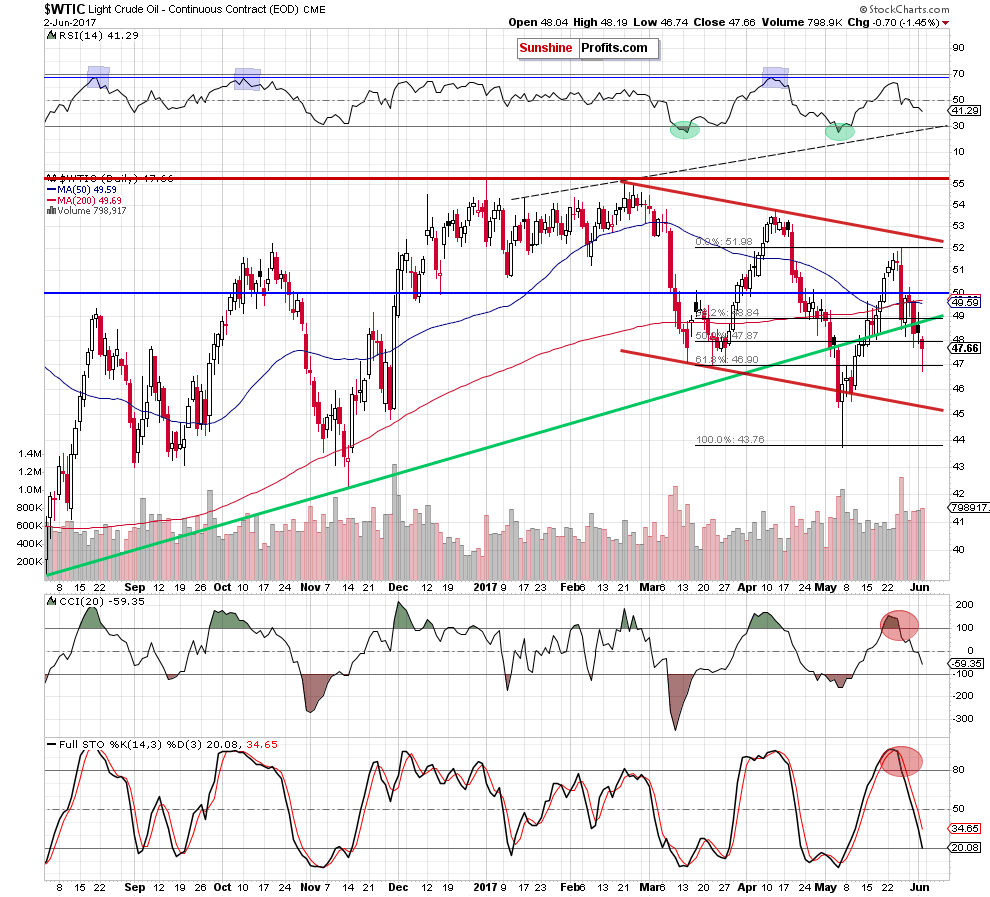
On the above charts, we see that crude oil verified the earlier breakdown under the long-term green support line based on the August and November lows on Thursday. This negative development encouraged oil bears to act, which resulted in a decline to the 61.8% Fibonacci retracement. Although this support triggered a rebound, the black gold closed Friday’s session not only below the long-term green support line based on the August and November lows, but also under the previously-broken 50% retracement and previous lows.
Taking this fact into account and combining it with the sell signals generated by the indicators, we think that further declines are still ahead us. This scenario is also reinforced by the size of volume, which accompanied Friday’s drop – it was bigger than day earlier, which confirms oil bears’ strength.
How low could the commodity go? In our opinion, if crude oil extends declines from Friday’s levels and breaks under the 61.8% Fibonacci retracement, the next target for oil bears will be around $45.40, where the previously-broken lower border of the red declining trend channel is.
Finishing this section, let’s zoom out our picture and take a closer look at the long-term chart. What can we infer from it?
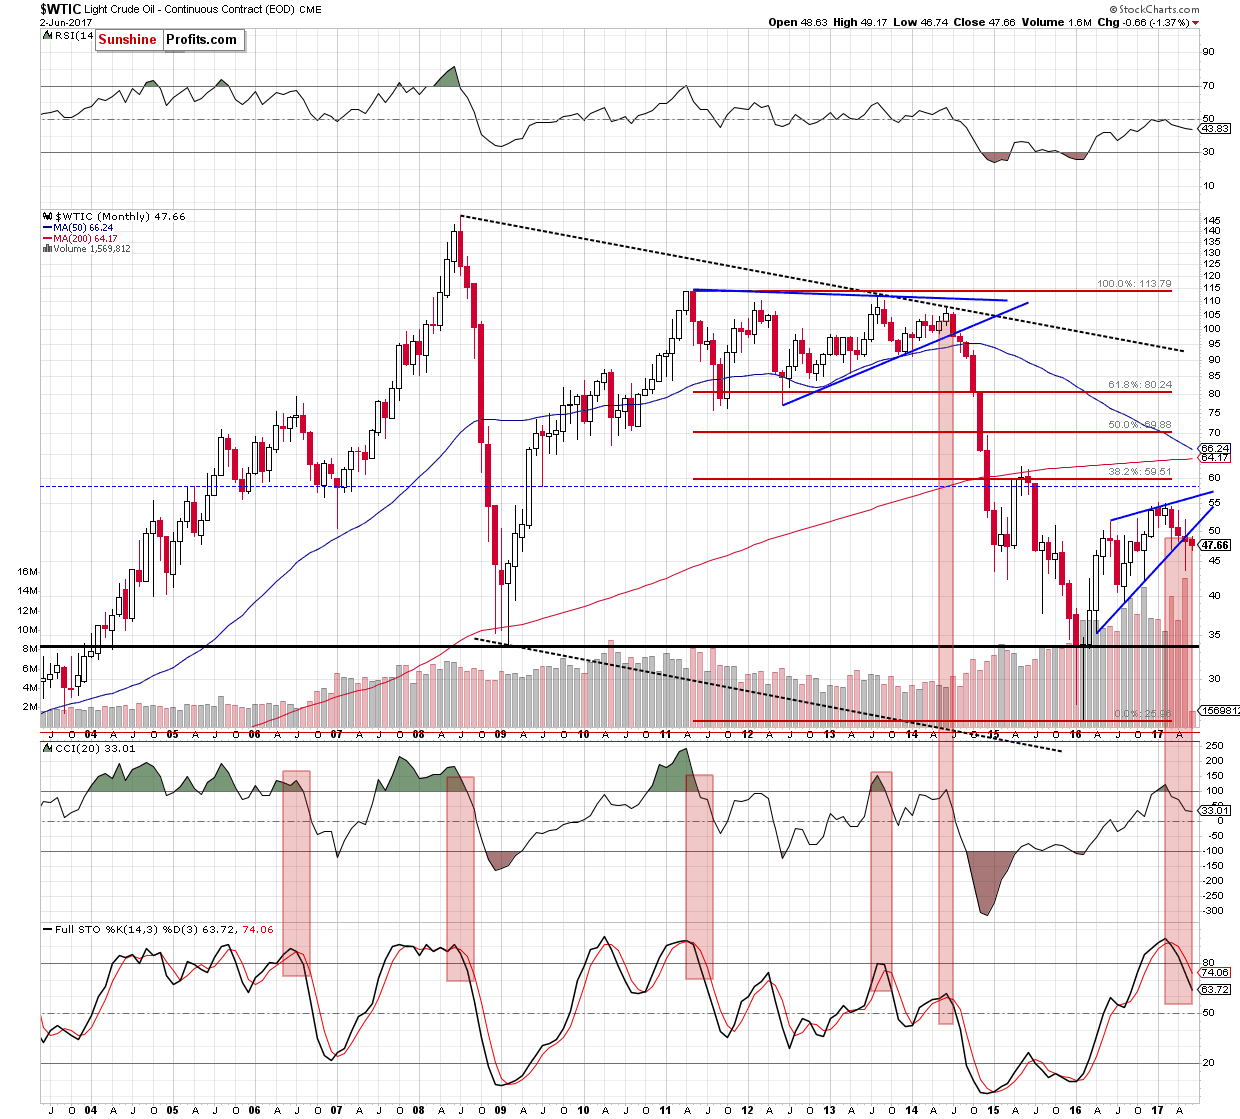
Looking at the monthly chart, we see that crude oil closed May under the previously-broken lower border of the rising wedge, which doesn’t bode well for oil bulls – especially when we factor in the sell signals generated by the indicators.
At this point, it is worth noting that the long-term sell signals together with the breakdown under the blue support line (the lower border of the blue triangle) preceded huge declines in 2014, which increases the probability of further deterioration in the coming weeks – even if we see a short-term (and short-lived) rebounds.
Having discussed the situation in crude oil, let’s examine the NYSE Arca Oil Index (XOI) to find out what the current outlook for oil stocks is.
Oil Stocks
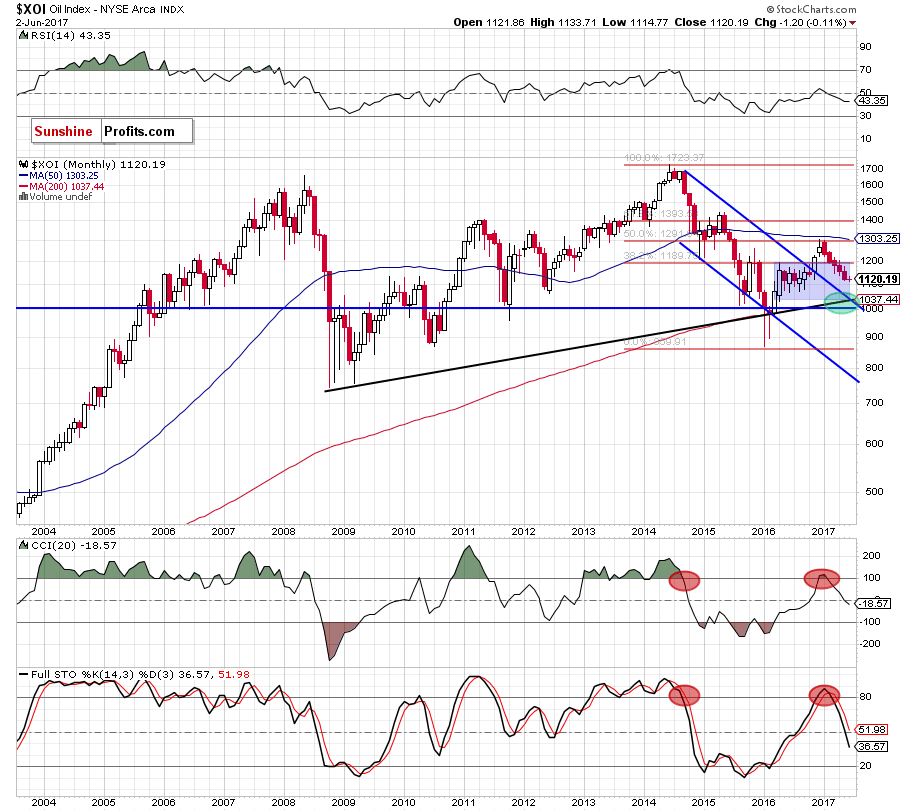
Looking at the long-term chart, we see that although oil stocks are still trading in the blue consolidation, the XOI extended losses below the upper border of the formation in the previous month, which is a bearish development. Additionally, the sell signals generated by the CCI and the Stochastic Oscillator remain in place, suggesting another attempt to move lower.
But will we see such price action in the coming weeks? Let’s examine the medium-term chart and find out.
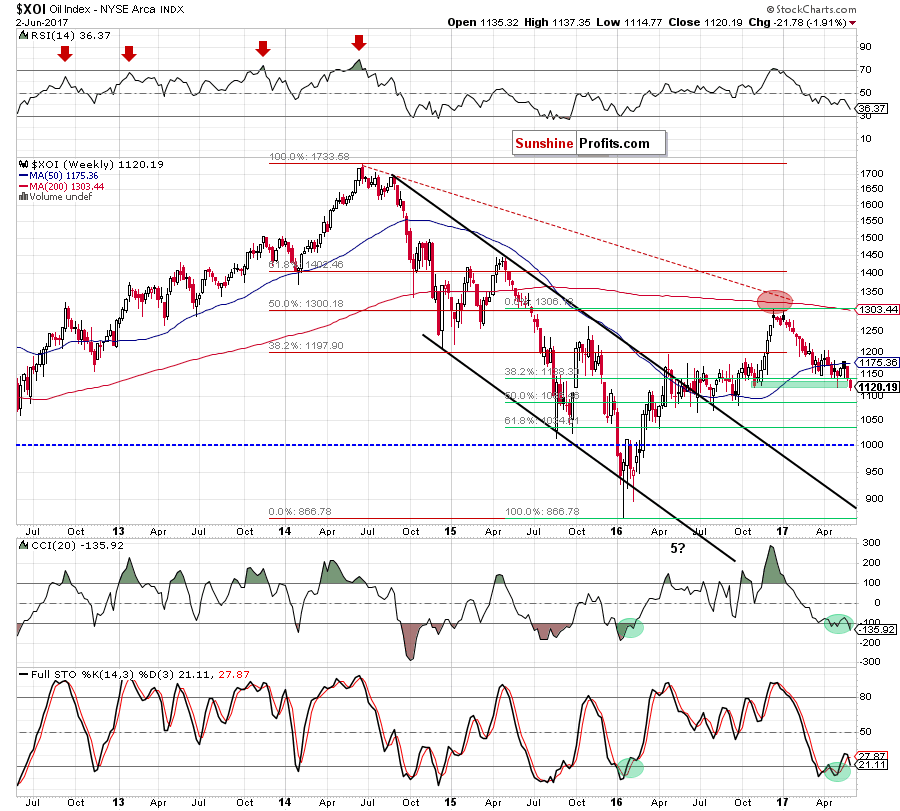
From this perspective, we see that although the green support zone pushed the XOI higher, the 50-week moving average together with the previous highs stopped further improvement. As a result, oil bears came back to the market, triggering decline, which took the index not only under the above-mentioned moving average, but also the 38.2% Fibonacci retracement and the previous low. Additionally, the CCI slipped below -100 and the Stochastic Oscillator generated the sell signal, which suggests further deterioration in the coming weeks.
How high could oil stocks go? Let’s take a closer look at the daily chart.
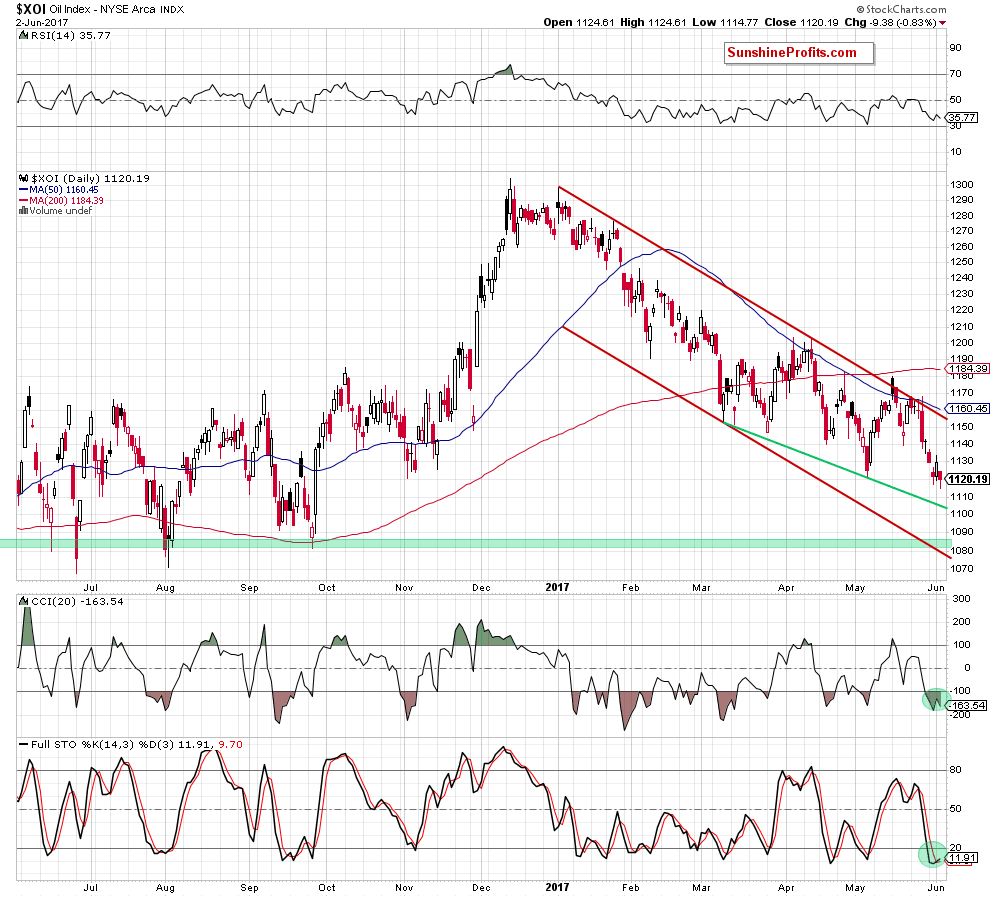
On the daily chart, we see that Friday’s drop took oil stocks to a fresh 2017 low, opening the way to lower levels. If this is the case, we’ll see further deterioration and a drop to (at least) the green support line based on the previous lows (currently around 1,105.13). Nevertheless, if this support is broken, oil bears could took the XOI even to the green support zone based on the late September lows (around 1,081-1,089).
Summing up, the short-term outlook for oil stocks turned into bearish as the XOI invalidated the earlier breakout above the upper border of the red declining trend channel (marked on the daily chart) and dropped to a fresh 2017 low on Friday. Although the index moved a bit higher earlier today, oil stocks remains under the May low, which looks like a verification of the breakdown. If this is the case, we’ll see further declines to our downside target(s) in the coming week.
Ratio Analysis
Today, we start this section by focusing on the oil-to-oil stocks ratio. What can we infer from the chart below?
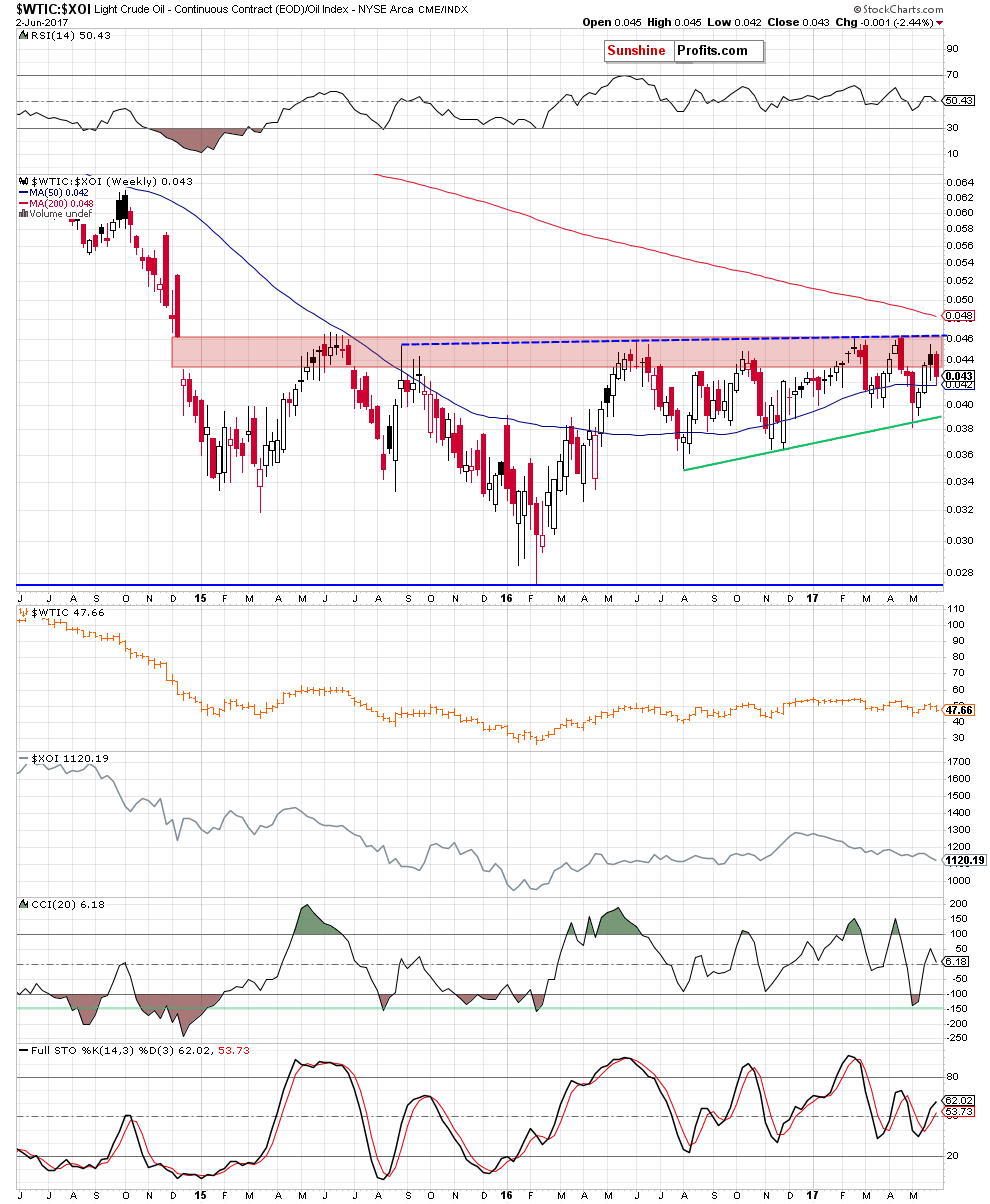
On the weekly chart, we see that although the ratio moved higher in the previous weeks, the combination of the key red resistance zone and the blue dashed line based on the previous highs stopped oil bulls once again. As a result, the ratio reversed and declined last week, which resulted in a comeback to the previously-broken 50-week moving average.
What’s next? Although this support could trigger a rebound, we clearly see that in all previous similar situations it wasn’t strong enough to stop oil bears for longer. Therefore, in our opinion, further declines are just around the corner. If this is the case and the ratio extends losses, the initial downside target for the bears will be around 0.0390, where the long-term green support line is.
What does it mean for crude oil? As you know from our previous updates, there is a positive correlation between the ratio and crude oil which means that declines in the ratio will likely translate into lower prices of crude oil in the coming week(s).
Will the relationship between crude oil and gold confirm this scenario? Let’s check the charts below and find out.
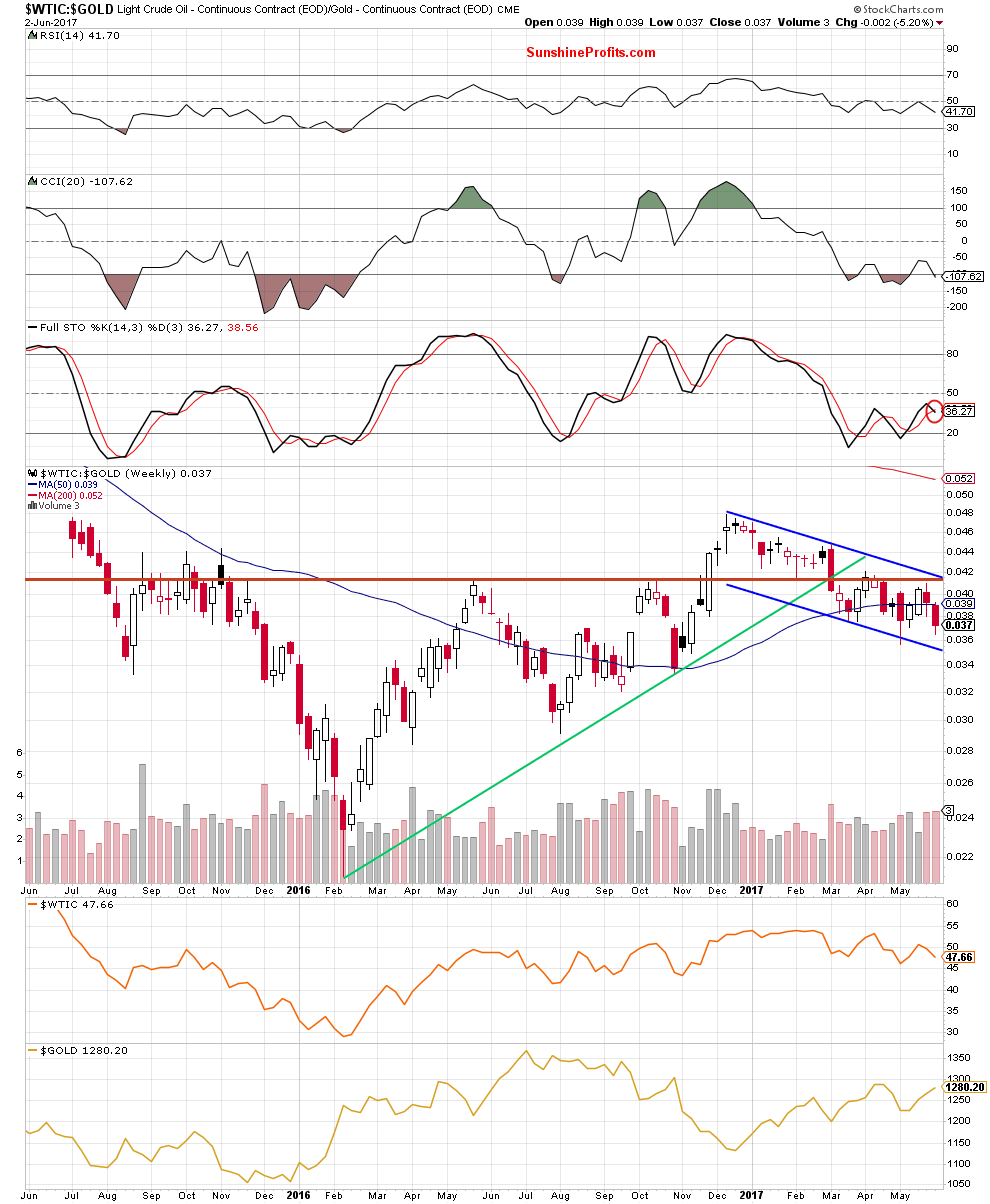
On the weekly chart, we see that the ratio bounced off the lower border of the blue declining trend channel, which resulted in an increase to the red horizontal resistance line and approached the ratio to the previous highs. The combination of these levels was too strong for the bulls, which resulted in a reversal and declines in the recent two weeks. Thanks to these drops, the ratio erased almost all of the earlier gains, which suggests another test of the lower border of the blue declining trend channel in the coming week(s). Additionally, the size of volume, which accompanied recent moves was bigger than what we saw during increases, which suggests that the bears are stronger than their opponents, which increases the probability of another downswing.
Will the very short-term chart give us more bearish factors? Let’s zoom in our picture and find out.
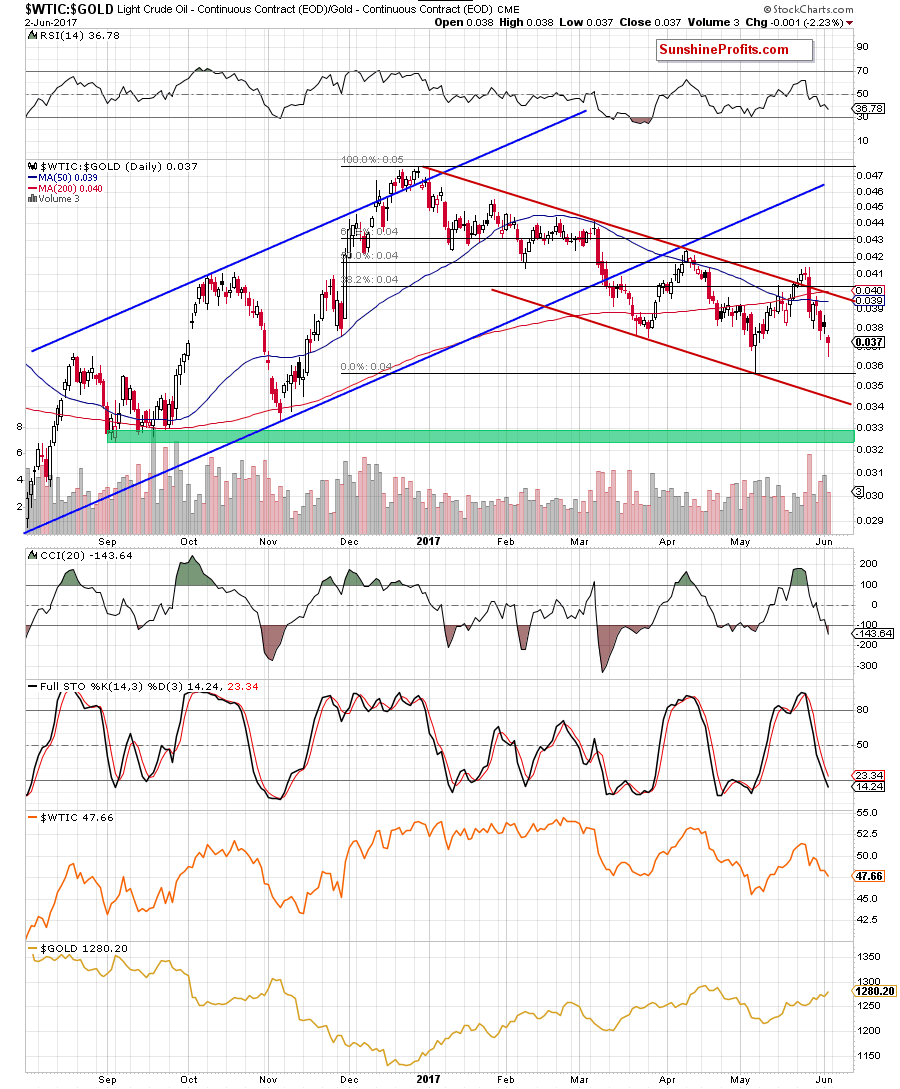
On the daily chart, we see that although the bulls pushed the ratio above the upper border of the red declining trend channel, the proximity to the 50% Fibonacci retracement encouraged their opponents to act. As a result, the ratio declined sharply, invalidating the earlier breakout above the red line. This negative development triggered further declines, which took the ratio to the early May levels.
What can we expect in the near future? Taking into account an invalidation of the breakout above the upper line of the red declining trend channel, the sell signals generated by the indicators and the medium-term perspective, we think another downswing and a drop to the lower line of the red declining trend channel is more likely than not. If this is the case, we’ll also see (at least) one more move to the downside in the case of crude oil.
Having said that, let’s take a closer look at the relationship between crude oil and the general stock market.
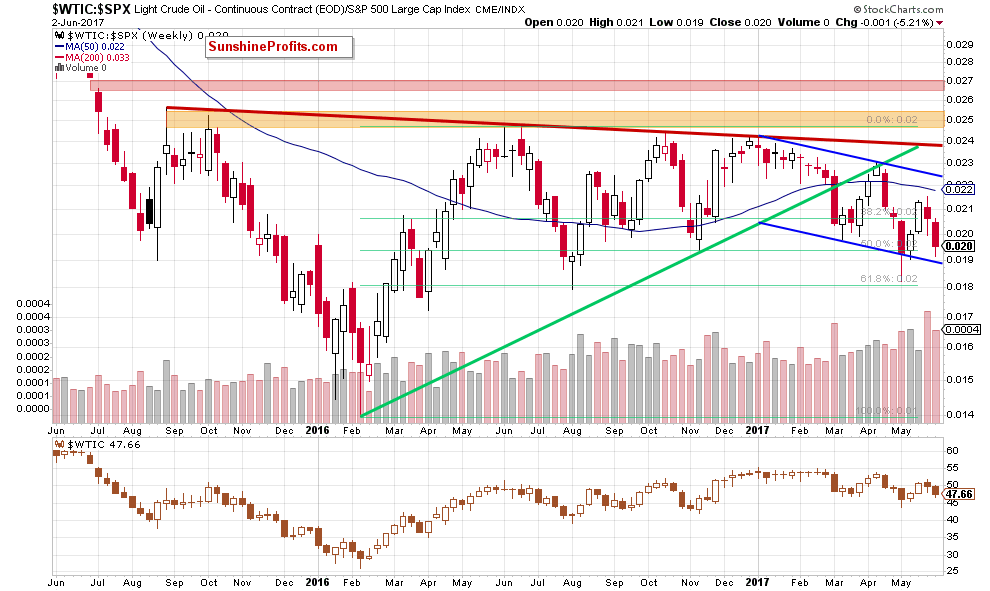
Although the ratio invalidated the earlier breakdown under the lower border of the blue declining trend channel, the move to the upside wasn’t significant – the bulls didn’t even push the ratio to the upper border of the formation. This show of weakness together with the small volume (compared to the size of volume which accompanied recent declines) encouraged the bears to act, which resulted in a comeback to slightly above the blue support line. Will we see further deterioration in the coming week(s)? In our opinion, such price action will be more likely and reliable if the ratio closes this or one of the following weeks below the above-mentioned support line. In this case, we’ll see not only a test of the recent low, but also a drop even to the last April low of 0.0172.
Finishing this section let’s focus on the non-USD (WTIC:UDN ratio) chart of crude oil. As a reminder, UDN is the symbol for the PowerShares DB US Dollar Index Bearish Fund, which moves in the exact opposite direction to the USD Index. Since the USD Index is a weighted average of the dollar's exchange rates with world's most important currencies, the WTIC:UDN ratio displays the value of crude oil priced in "other currencies".
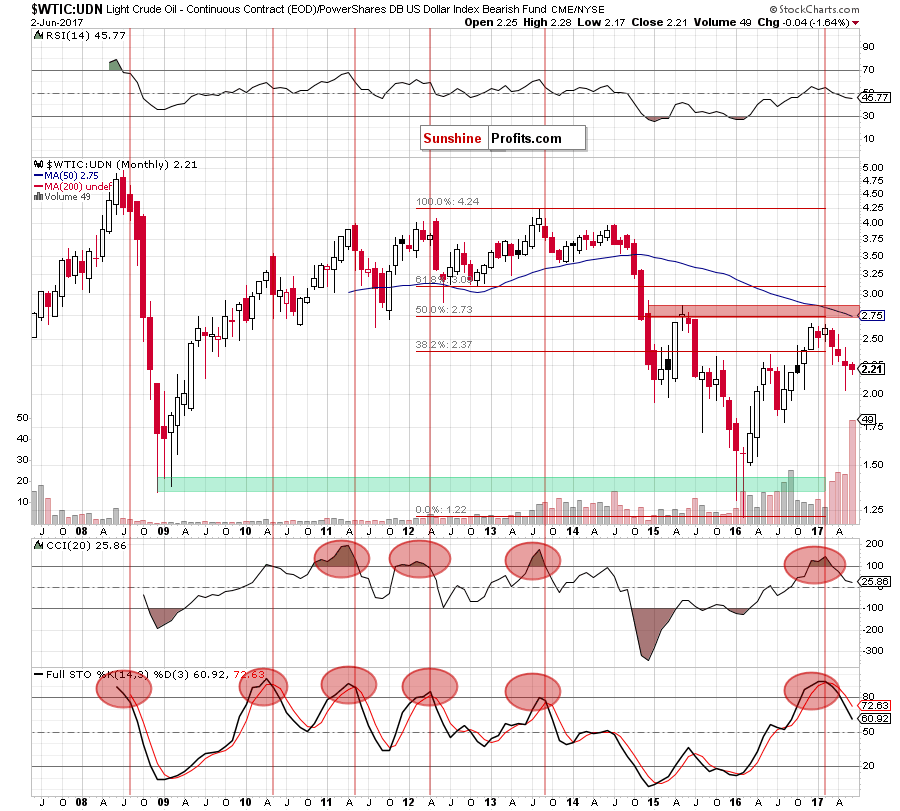
On the long-term chart, we see that although the ratio rebounded, erasing some of earlier losses, the overall situation hasn’t changed much as it is still trading under the previously-broken 38.2% Fibonacci retracement. This means that an invalidation of the breakout and its negative impact on the price are still in effect, supporting oil bears. Additionally, the sell signals generated by the indicators remain in play, suggesting further deterioration in the coming month (similarly to what we saw in the past).
How did this price action affect the medium-term chart? Let’s examine the weekly chart and find out.
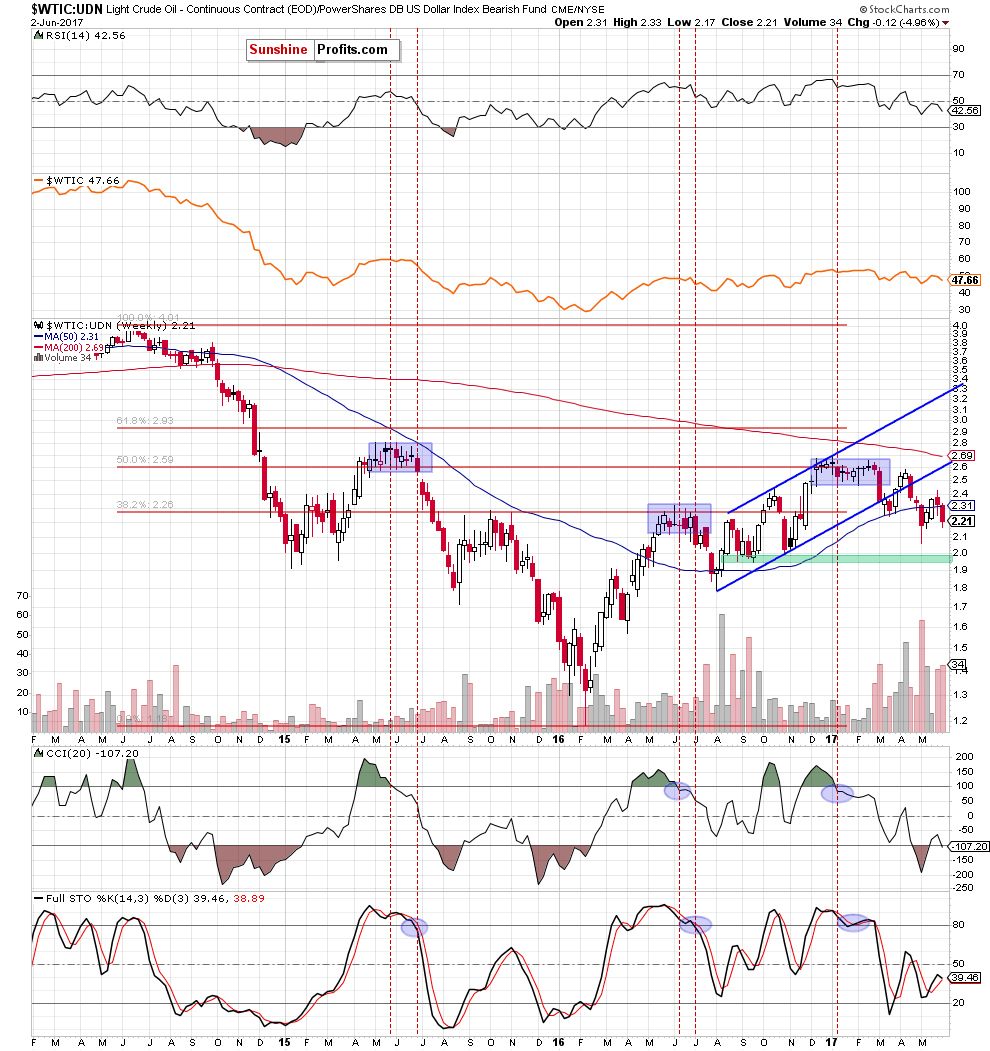
From this perspective, we see that although the ratio increased and closed one of the previous weeks above the 50-week moving average, this improvement was temporary. As a result, the ratio reversed and declined, invalidating the earlier breakout. This negative development together with a higher volume during recent declines suggests that lower values of the ratio are just around the corner. If this is the case, the ratio will likely not only test the May low, but also decline to the green support zone in the following weeks.
Scenarios
Just like a month ago, today’s Oil Investment Update includes scenarios of what could happen in the coming weeks. Naturally, we will continue to monitor the market in the coming days and if anything invalidates our long-term outlook we will send you an additional message.
- Bullish scenario
If crude oil rebounds and invalidates the earlier breakdown under the long-term green line based on the August and November lows (the nearest important resistance at the moment), the way to the May highs will be open. If this resistance is broken, the next target will be the upper border of the red declining trend channel seen on the daily chart (currently around $52.50) or even the April highs around $53.30-$53.76. - Bearish scenario
If the commodity drops under Friday’s low and the 61.8% Fibonacci retracement, we’ll see a test of the strength of the lower border of the red declining trend channel (currently around $45.40). If this support is broken, the next downside targets for oil bears will be: the May 5 low of $43.76, the September and mid-November lows and the barrier of $40.
Summary
Although OPEC and some non-OPEC producers extended a deal to cut production, the price of crude oil reversed and declined, invalidating the earlier breakout above the barrier of $50, the 50 and 200-day moving averages and the long-term green line based on the August and November lows. Such combination of negative factors together with the current situation in all of our above-mentioned ratios suggests further deterioration in the coming weeks – especially when we factor in the fact that the size of volume was rising during declines, indicating that oil bears are getting stronger. If this is the case, we’ll likely see a re-test of the strength of the lower border of the red declining trend channel in the coming week. If it holds, light crude could rebound slightly, but if it doesn’t withstand the selling pressure, the way to lower levels will be open.
Very short-term outlook: bearish
Short-term outlook: bearish
MT outlook: mixed with bearish bias
LT outlook: mixed with bearish bias
This completes this month’s Oil Investment Update. Our next Oil Investment Update is scheduled for Monday, July 10, 2017. Oil Trading Alerts subscribers will additionally receive similar but shorter alerts on a daily basis (or more than once a day when the situation requires it). You – Oil Investment Updates subscribers – will receive short Investment Alert messages should the outlook for the medium or long term change before the next Update is posted.
Thank you.
Nadia Simmons
Forex & Oil Trading Strategist
Oil Investment Updates
Oil Trading Alerts

