

- Crude Oil
- Ratio Analysis
- Non-USD Crude Oil Price
- Oil Stocks
- Scenarios
- Summary
In the previous weeks, the price of crude oil was trading in a narrow range as the oil market was balanced between two opposing factors: OPEC cuts and rising U.S. inventories and production.
In our January’s Oil Investment Update, we wrote the following:
(...) On one hand, we have the deal, which could reduce global supply by about 2% and affected positively investors’ sentiment (...) According to this agreement, oil and gas condensate production were cut by 1.2 percent to 11.3 million bpd in the previous week in Russia. Without a doubt it was a positive event, but we can’t forget about output increases in Libya and Nigeria, which are both allowed to ramp up production as part of the OPEC deal. On top of that, Friday’s Baker Hughes report showed that the number of rigs in the U.S. rose by 4 to 529 in the previous week. It was the tenth straight weekly increase and a level not seen since Dec 2015.
What’s interesting, in the following weeks, we saw that U.S. drillers added fresh rigs, but this negative development was overshadowed by other news and comments (for example, from OPEC Secretary General Mohammed Barkindo). At this point, it is also worth noting that last Friday, Baker Hughes reported that the count of active oil rigs rose by 7 to 609.
A month ago, we added:
(…) Although the Energy Information Administration reported four consecutive increases in crude oil and fuel inventories (…), oil investors shrugged off these bearish numbers (…)
Similarly, to what we saw in the case of Baker Hughes reports, the U.S. Energy Information Administration also showed growing from week to week oil inventories. Yesterday, the EIA reported that crude oil inventories rose by 8.209 million barrels, which was the ninth straight week of increases.
How did this news affect oil investors? Finally, after weeks of an exhausting consolidation the sellers became strong enough to push the price of crude oil lower. Will we see further deterioration in the coming weeks? How low could the black gold go in the coming weeks? Let’s jump right into the charts (charts courtesy of http://stockcharts.com) and try to find an answer to these questions.
Crude Oil
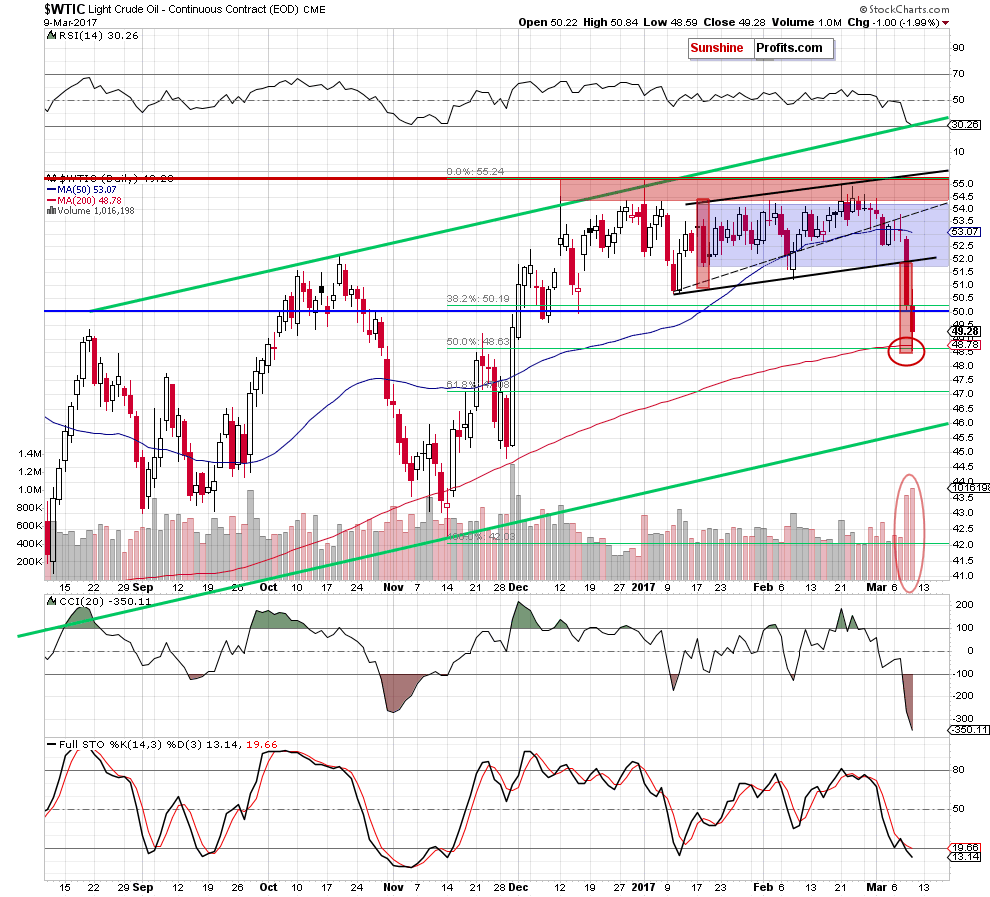
From today’s point of view, we see that oil bears pushed the black gold sharply lower. Thanks to yesterday’s decline, light crude not only dropped under the lower line of the blue consolidation and the lower border of the black rising trend channel, but also closed the day significantly below them and approached the barrier of $50.
Earlier today, in our Oil Trading Alert, we wrote the following:
(…) How low could the black gold go in the coming days? Based on yesterday’s price action, we think that the next downside target will be around $48.53-$48.78, where the 50% Fibonacci retracement and the 200-day moving average are. Additionally, in this area the size of the downward move will correspond to the height of the black rising trend channel.
As you see, the situation developed in line with this scenario and crude oil reached our initial downside target. What’s next? Taking into account the fact that light crude rebounded before the market’s closure, it seems to us that the commodity could move a bit higher and verify the breakdown under the barrier of $50 in the coming days. If this is the case, it would be a negative event, which will likely translate into another attempt to move lower and a test of today’s low of $48.59.
What if this area is broken? In our opinion, the next downside target will be around $47 (the 61.8% Fibonacci retracement) or even at $45.80, where the medium-term green support line based on the August and November lows currently is.
Having said the above, let’s check how this drop affected the medium-term picture.
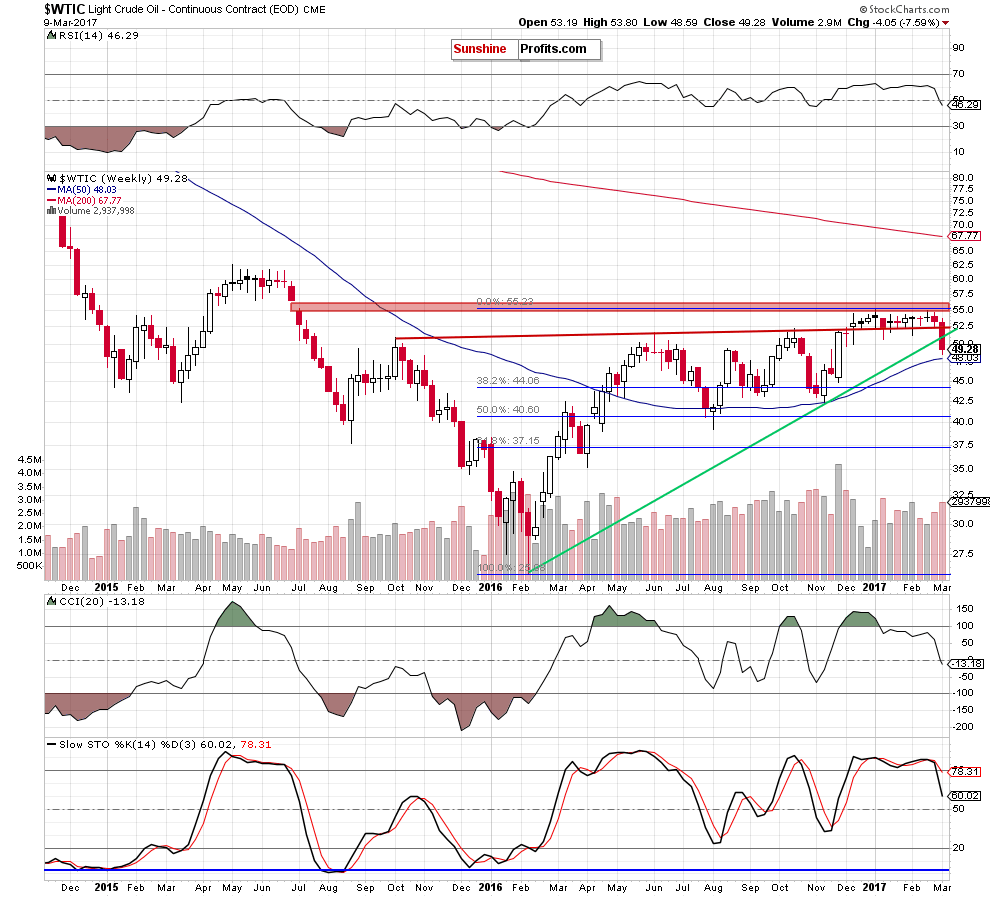
The first thing that catches the eye on the weekly chart is breakdown under the long-term green support line based on the February and November 2016 lows. This is a bearish signal, which suggest that further deterioration in the coming weeks is very likely – especially, when we factor in the sell signals generated by the weekly indicators.
What could happen if the commodity extends losses bellow this important line? In our opinion, we may see a decline even to around $44, where the 38.2% Fibonacci retracement based on the entire 2017-2017 upward move is. Nevertheless, before we see crude oil at this level, oil bears will have to push light crude below several earlier mentioned supports.
To have a more complete picture of crude oil let’s zoom out our picture and examine the long-term chart of the commodity.
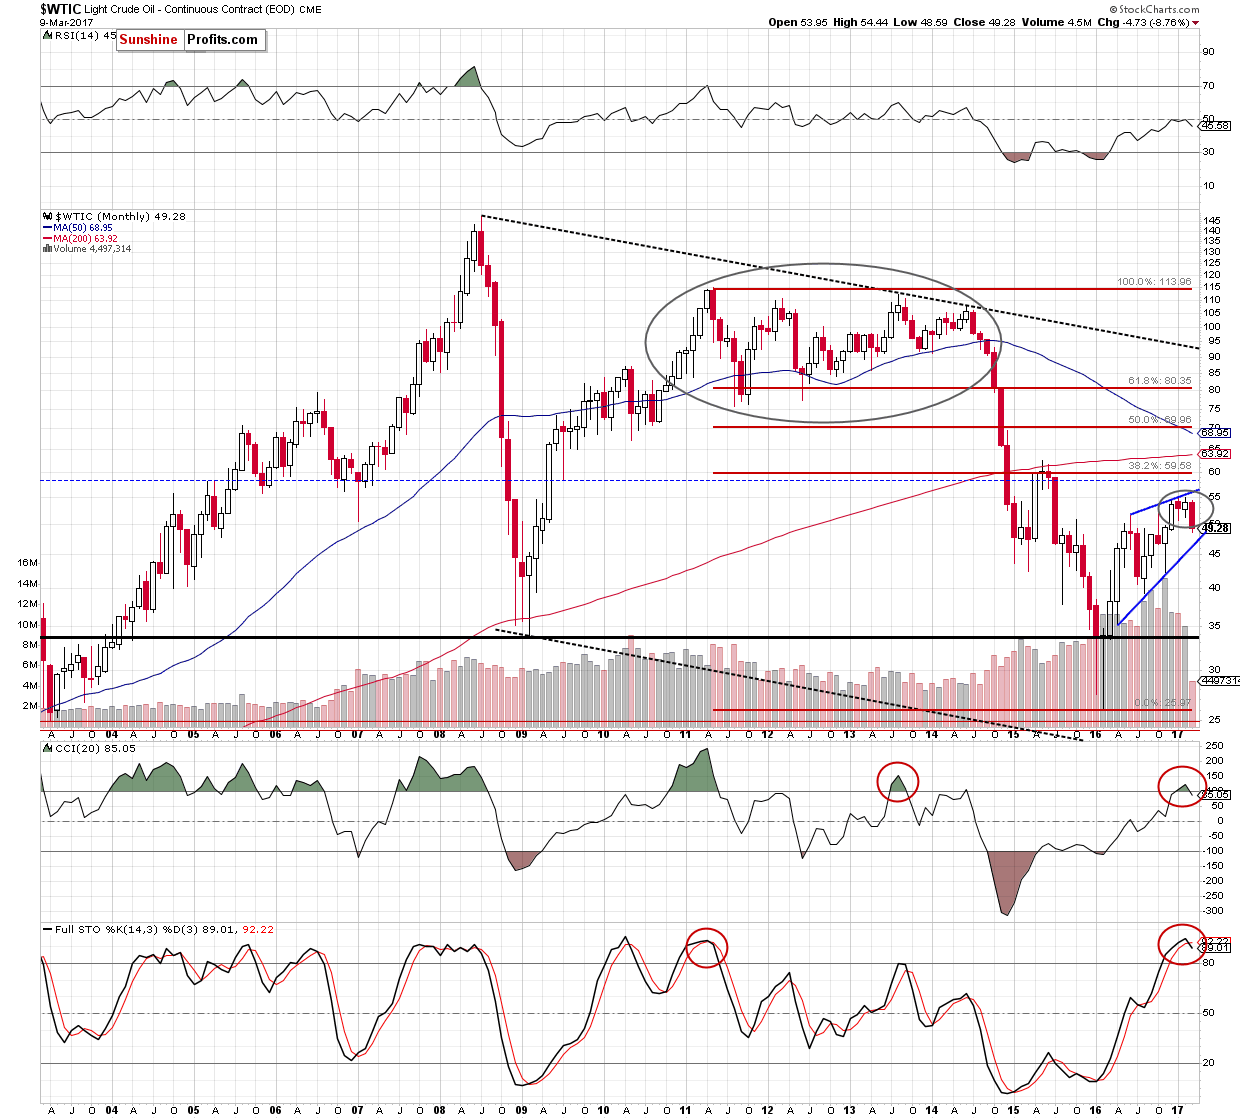
From this perspective, we see that the CCI and the Stochastic Oscillator generated the sell signals, which is a bearish development. Similar situation we saw a long time ago – in October 2013 (in the case of the CCI) and June 2011 (in the case of the Stochastic Oscillator). In both cases, the sell signals preceded bigger declines, which increases the probability that we’ll see similar price action in the coming weeks.
The pro bearish scenario is also reinforced by the current situation in our interesting ratios. Let’s take a closer look at them to find out what are they saying about crude oil future moves.
Ratio Analysis
On the weekly chart, we see that although the ratio extended gains in the previous weeks, the key red resistance zone together with the blue dashed line based on the previous highs stopped oil bulls once again. As a result, the ratio reversed and declined, invalidating the earlier breakout above the October high. This is a bearish development, which suggests further deterioration and a drop to (at least) the blue support line based on the previous lows. This scenario is also reinforced by the sell signals generated by the indicators.
What does it mean for crude oil? As you see on the chart, the positive correlation between the ratio and the commodity is still in play, which means that declines will also trigger lower values of the black gold in the coming week(s).
Will the relationship between crude oil and gold give oil bears another reason to act? Let’s check the charts below and find out.
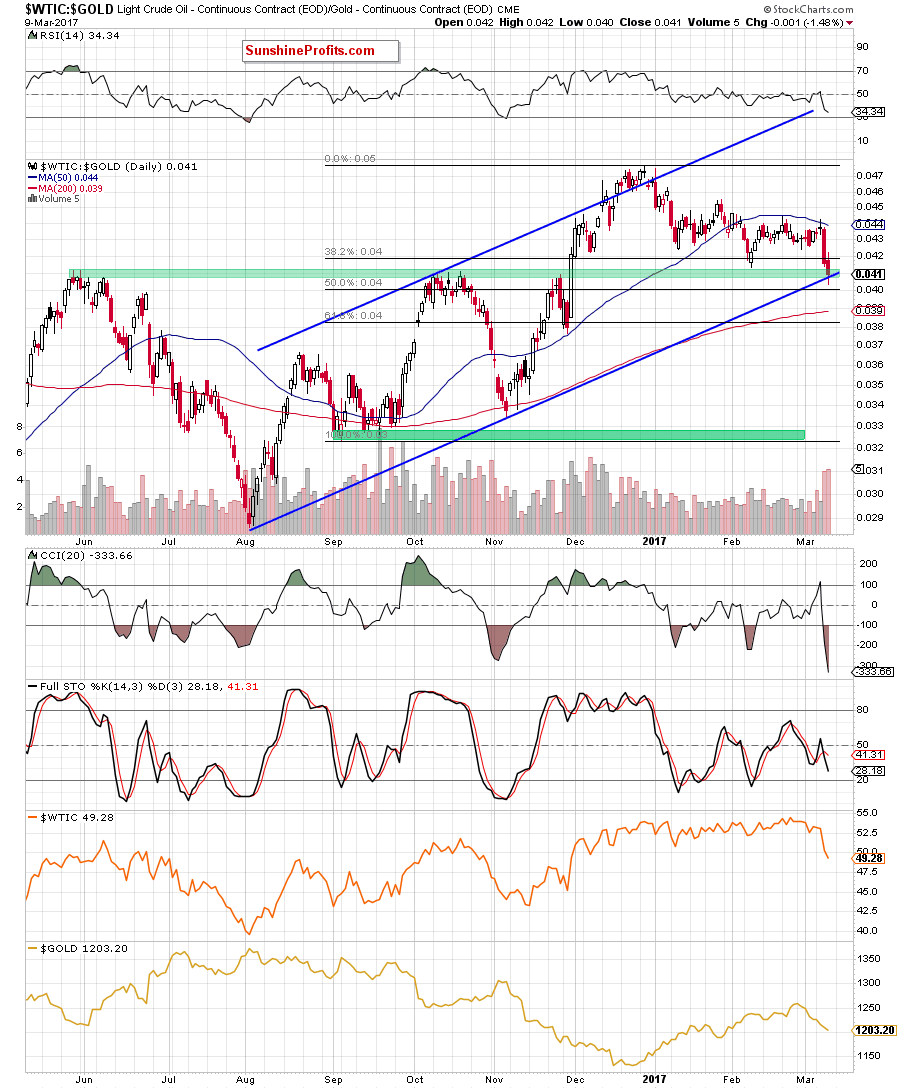
On the daily chart, we see that the ratio extended losses and dropped under the green support zone and the lower border of the blue rising trend channel. Although we saw a rebound before the market’s closure, the ratio closed the day below the May and October highs, invalidating the earlier breakout which is a bearish signal. Additionally, when we take a closer look at the chart, we’ll see that recent moves materialized on significant volume, confirming oil bears strength. On top of that, the Stochastic Oscillator re-generated the sell signal, encouraging the sellers to act.
When we zoom out our picture, we’ll also see more negative factors.
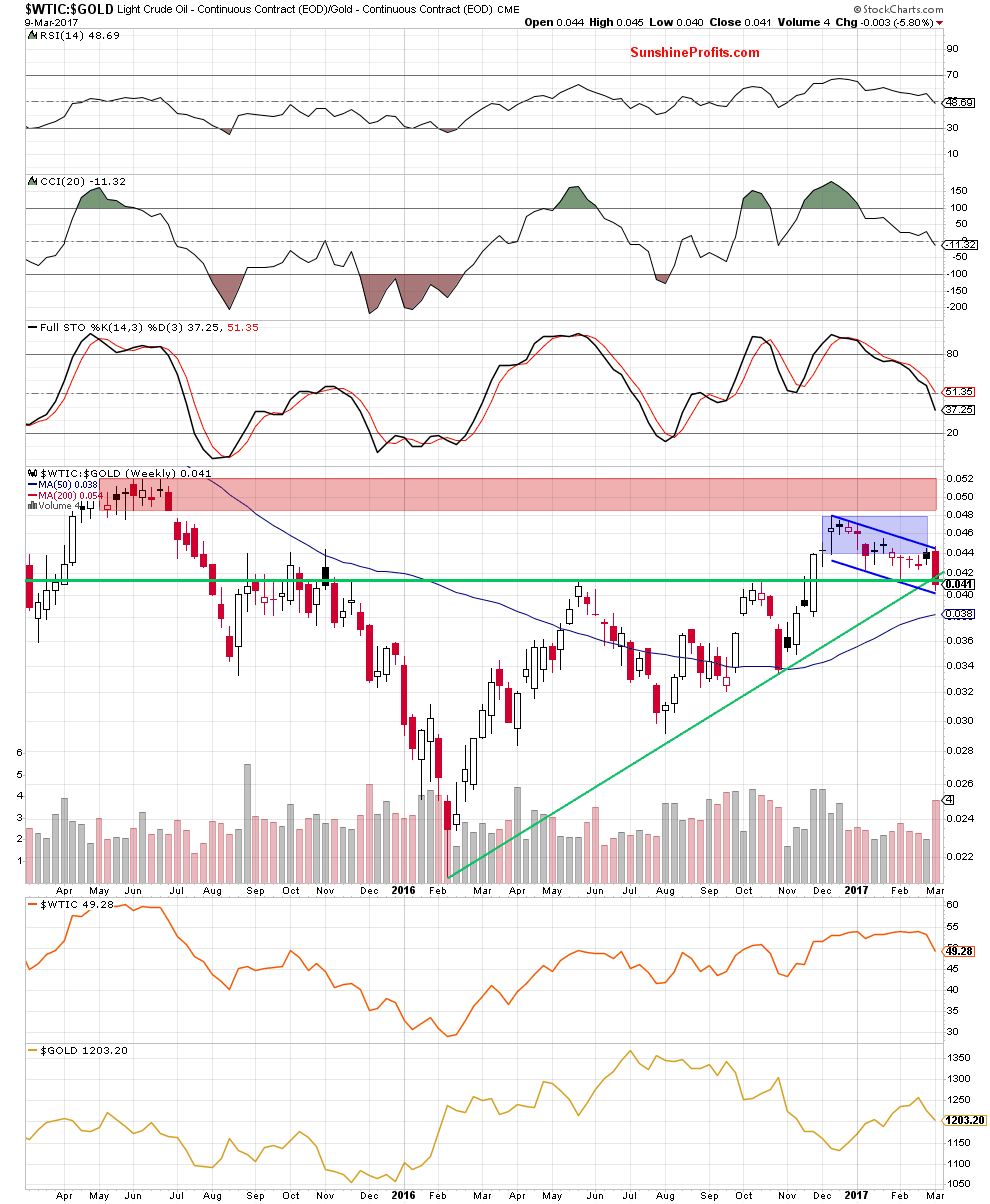
On the weekly chart, we see that the upper border of the blue declining trend channel triggered a decline, which pushed the ratio below the lower border of the blue consolidation once again. With this downswing, the ratio approached the lower border of the blue declining trend channel, which could trigger a rebound. Nevertheless, thanks to today’s move the ratio slipped below the long-term green support line based on the February and November lows, which suggests further deterioration in the ratio and the price of crude oil as the positive correlation between them is still in cards.
Having said that, let’s take a closer look at the relationship between crude oil and the general stock market.
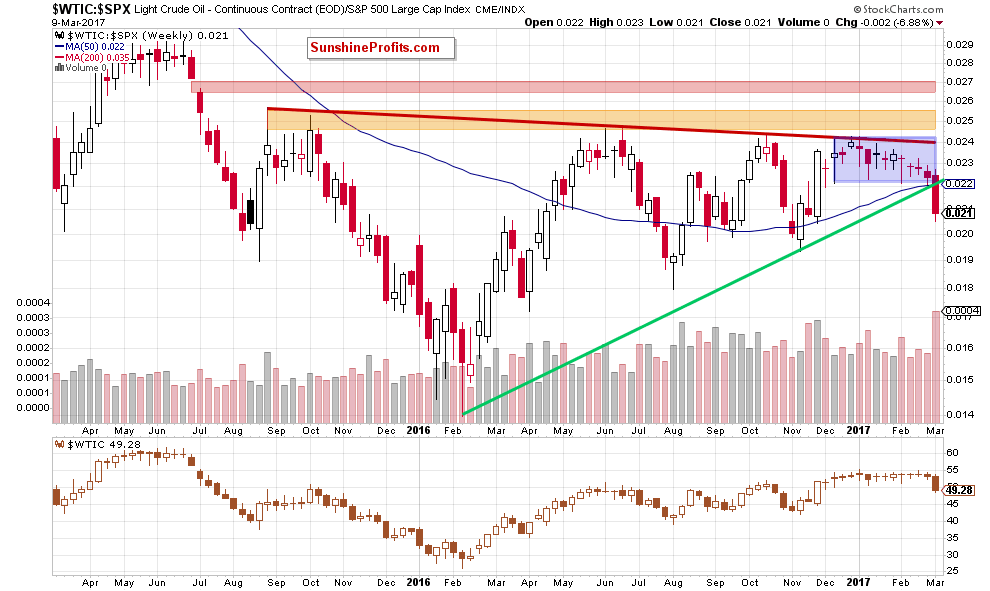
Looking at the weekly chart, we see that the ratio moved sharply lower and broke under the long-term green support line based on the February and November lows, which is a bearish signal – especially when we factor in the breakdown below the lower border of the blue consolidation and significant volume during this week.
Additionally, on the daily chart below, we can notice one more breakdown.
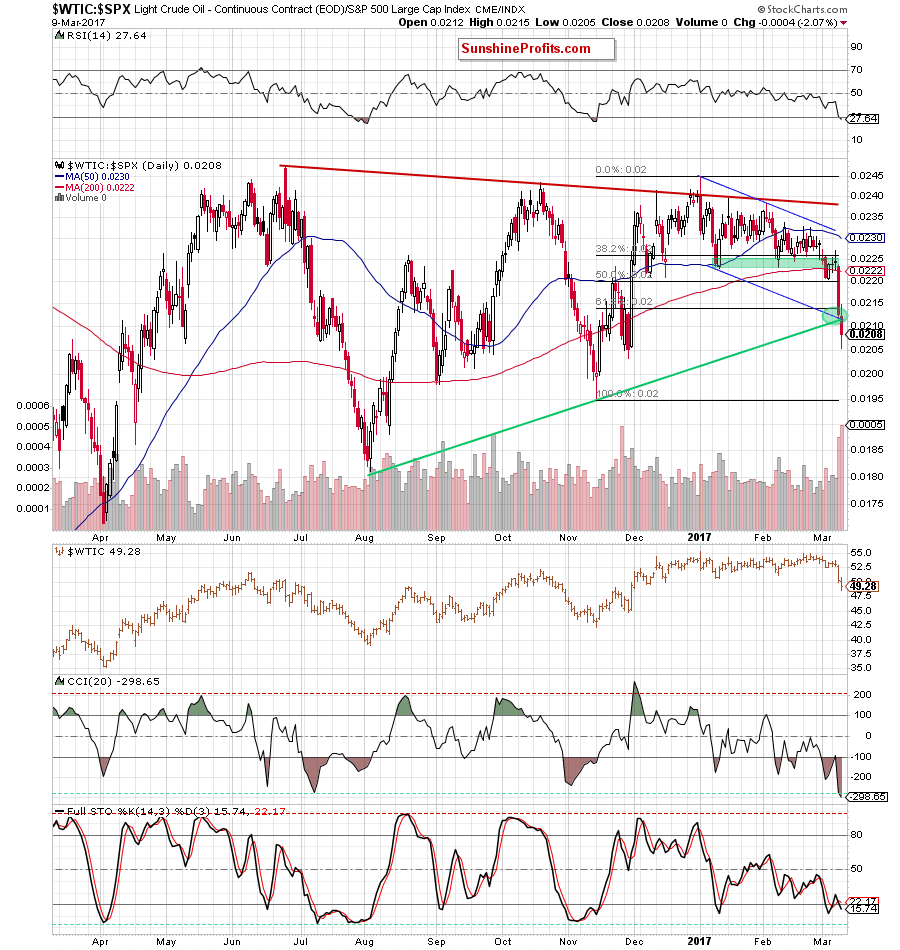
This time, we see that the oil-to-stock ratio broke not only under the green support zone and recent lows, buy also below the lower border of the blue declining trend channel. Such price action, in combination with increasing volume and the medium-term picture suggests further declines, which will likely translate into another downswing in crude oil.
Non-USD Crude Oil Price
Before we move to the current situation in oil stocks, let’s take a closer look at the non-USD (WTIC:UDN ratio) chart of crude oil. As a reminder, UDN is the symbol for the PowerShares DB US Dollar Index Bearish Fund, which moves in the exact opposite direction to the USD Index. Since the USD Index is a weighted average of the dollar's exchange rates with world's most important currencies, the WTIC:UDN ratio displays the value of crude oil priced in "other currencies".
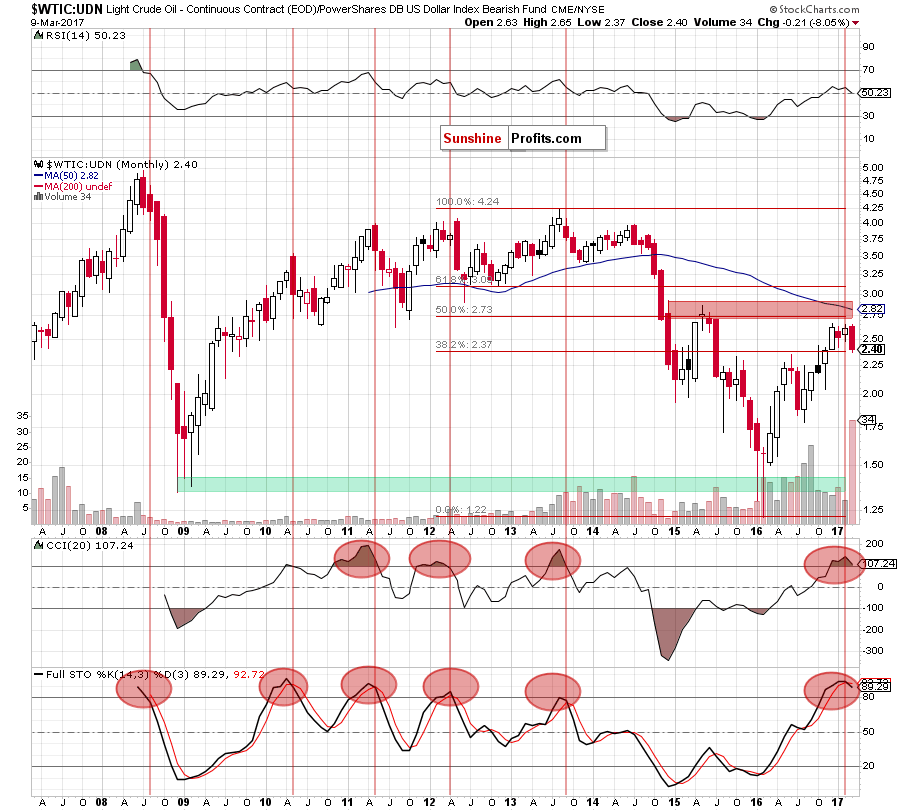
On the long-term chart, we see that the proximity to the red resistance zone together with the sell signals generated by the indicators encouraged oil bears to act, which resulted in a sharp decline. What’s interesting, the CCI and the Stochastic Oscillator generated the sell signals for the first time since 2013, increasing the probability of a bigger decline in the coming month(s).
How did this drop affect the medium-term chart? Let’s examine the weekly chart and find out.
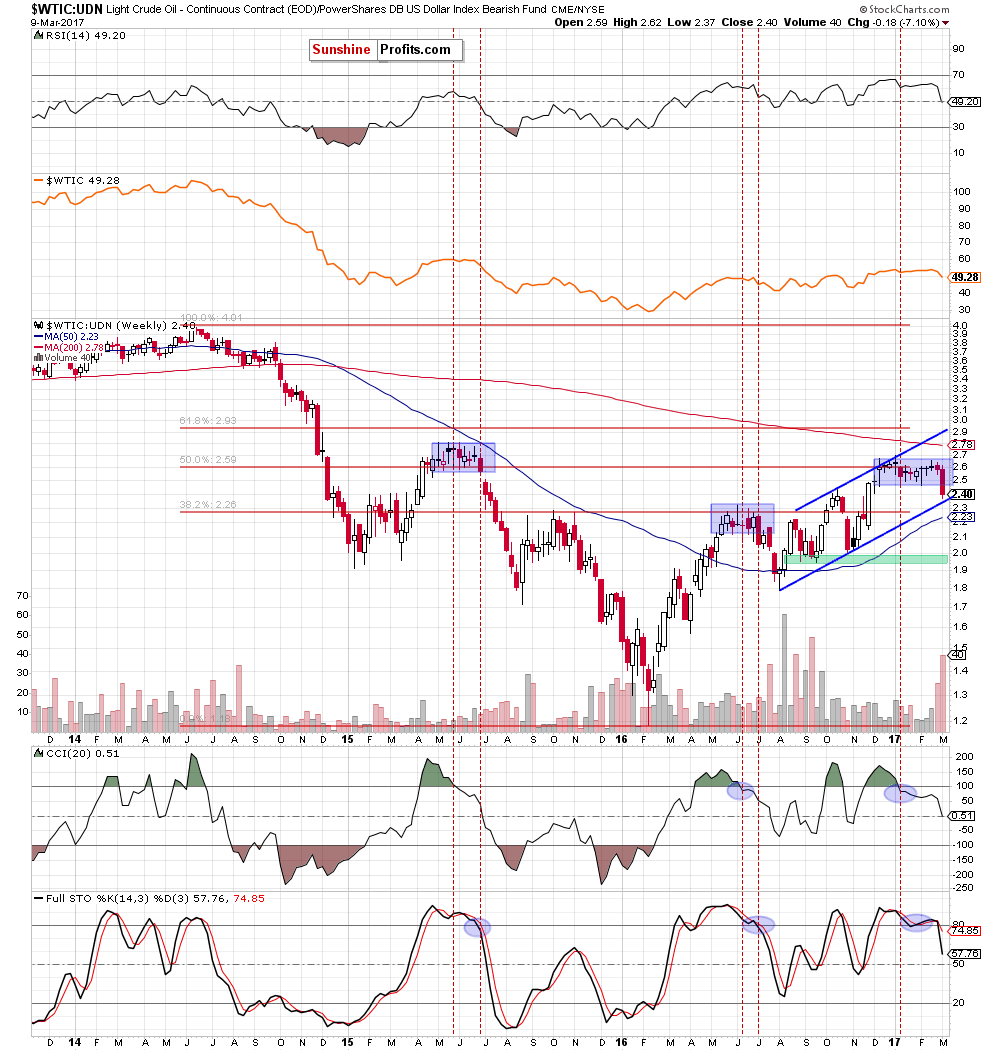
From this perspective, we see that the ratio finally extended losses and dropped under the lower border of the blue consolidation, giving oil bears a signal to act. Additionally, significant increases in volume suggests that they are getting stronger, which could result in further declines in the coming week(s) -especially if we see a breakdown under the lower border of the blue rising trend channel. It is also worth noting that oil bears are also supported by the sell signals generated by the indictors, which means that lower values of the ratio are just around the corner.
Oil Stocks
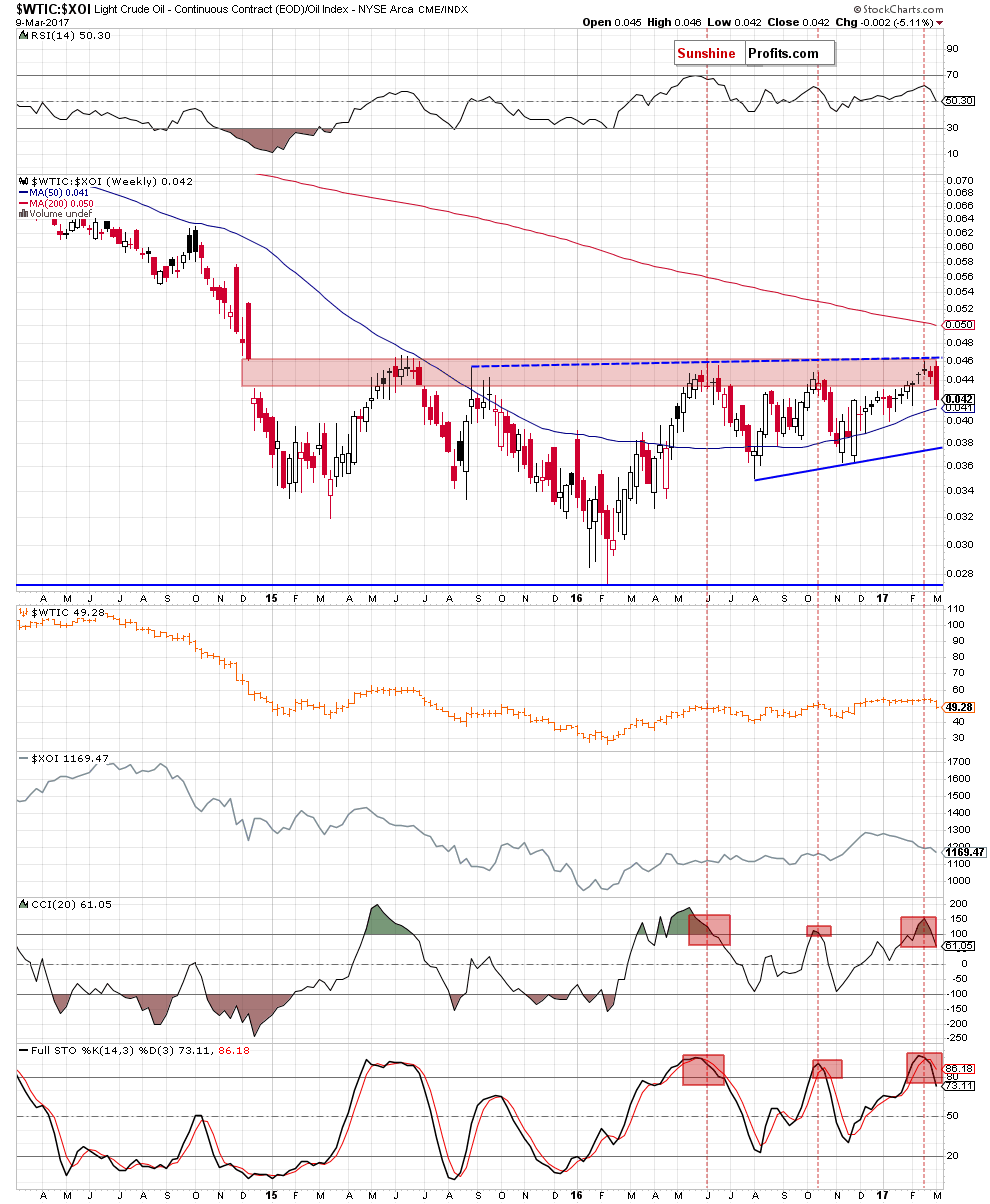
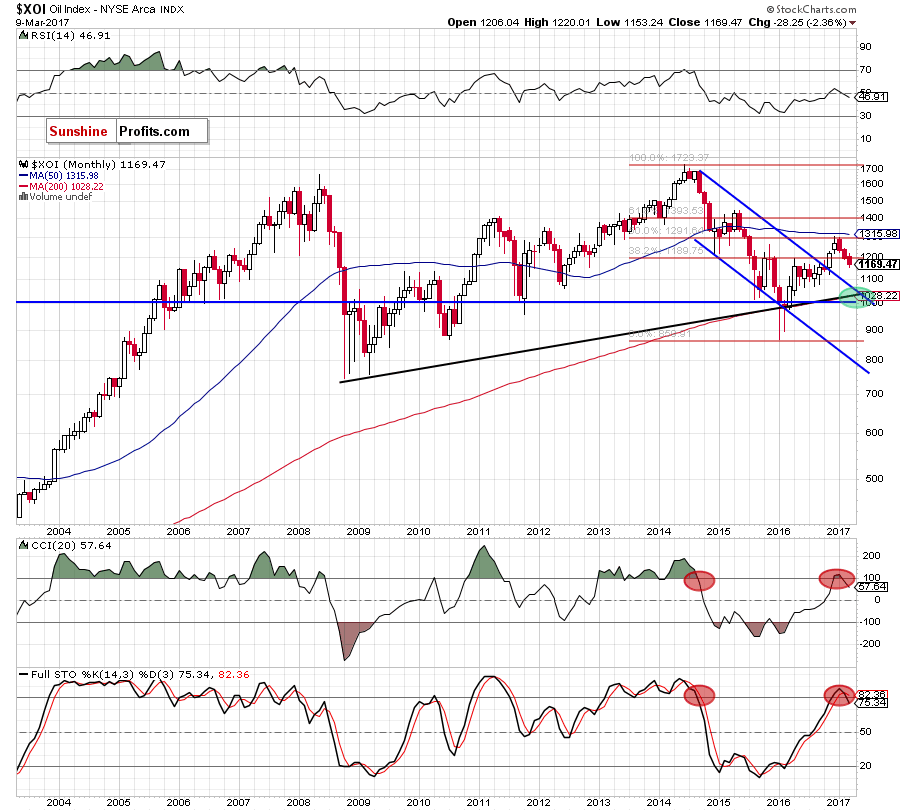
Finishing this month’s Oil Investment Update let’s examine the NYSE Arca Oil Index (XOI) to find out what the current outlook for oil stocks is.
Quoting our previous Oil Investment Update:
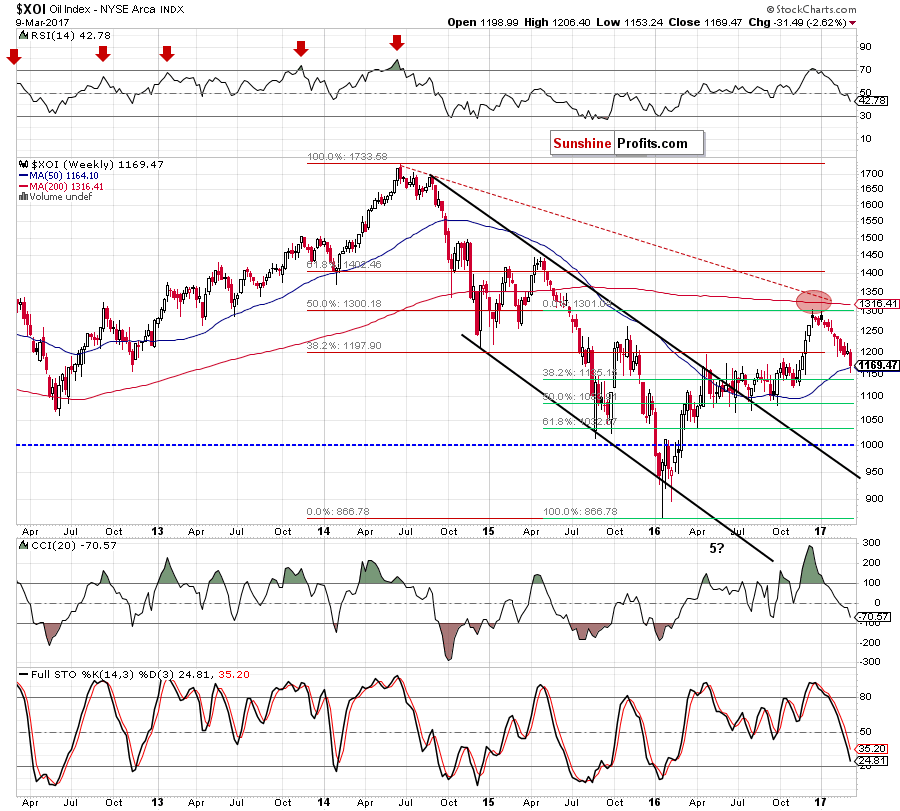
(…) What’s next? Although the index rebounded slightly, the sell signals generated by the indicators remain in place, supporting another attempt to move lower and a test of the nearest support zone (created by the barrier of 1,200 and the previously-broken April 2016 high of 1,194) in the coming weeks.
From today’s point of view, we see that the situation developed in line with the above scenario and oil bears not only took the XOI to our downside target, but also managed to push oil stocks below it. As a result, the index invalidated the earlier breakout above the April 2016 high, which is a bearish development that suggests further deterioration.
How low could oil stocks go in the coming week(s)? In our opinion, the next downside target will be around 1,067-1,100, where the next psychologically important barrier, the June, July, September 2016 lows and the 50% Fibonacci retracement are. It is also worth noting that this support area is currently also reinforced by the previously-broken upper border of the blue declining trend channel seen on the monthly chart.
Summing up, the outlook for oil stocks remains bearish as oil stocks invalidated the earlier breakout above the barrier of 1,200 and the April 2016 high, which suggests further deterioration – especially when we factor in the sell signals generated by the weekly and even monthly indicators.
Scenarios
Just like a month ago, today’s Oil Investment Update includes scenarios of what could happen in the coming weeks. Naturally, we will continue to monitor the market in the coming days and if anything invalidates our long-term outlook we will send you an additional message.
- Bullish scenario
If crude oil reverses and invalidates the breakdown under the barrier of $50, we’ll see a comeback to the previously-broken lower border of the black rising trend channel (seen on the daily chart around $52). If it is broken, the next upside target for oil bulls will be around $55.03-$55.24, where the major resistance zone is. - Bearish scenario
If the commodity drops under the 50% Fibonacci retracement and the 200-day moving average, the way to lower levels will be open. In this case, the next downside targets will be around: $47 (the 61.8% retracement), $45.74 (the medium-term green support line based on the August and November lows, $44.72 (the November 29 low), $42.20-$43 (the May, September and early November lows). If all these supports are broken, oil bears will test the barrier of $40.
Summary
After several weeks in a narrow range crude oil finally moved lower. With the recent declines, the commodity crude oil dropped below very important support levels (the lower border of the blue consolidation seen on the daily chart, the lower line of the black rising trend channel, the barrier of $50), which suggests further deterioration and a realization of the bearish scenario (even if we see a verification of the breakdown under the barrier of $50 first). The probability of another move to the downside is also supported by the current situation in all above-mentioned ratios.
Very short-term outlook: bearish
Short-term outlook: bearish
MT outlook: mixed with bearish bias
LT outlook: mixed
This completes this month’s Oil Investment Update. Our next Oil Investment Update is scheduled for Monday, April 3, 2017. Oil Trading Alerts subscribers will additionally receive similar but shorter alerts on a daily basis (or more than once a day when the situation requires it). You – Oil Investment Updates subscribers – will receive short Investment Alert messages should the outlook for the medium or long term change before the next Update is posted.
Thank you.
Nadia Simmons
Forex & Oil Trading Strategist
Oil Investment Updates
Oil Trading Alerts

