

The recent jump in oil prices prompted speculation that the market had bottomed out. Although yesterday oil prices dropped again, the question whether the bear market is close to the end remains. What are the prospects for the oil prices?
The oil prices increased more than 20 percent from Friday to Wednesday, technically taking the commodity into a bull market. This surge came after news showing that 94 U.S. oil rigs and 11 Canadian oil rigs were taken offline in the past week. Capital expenditure cuts suggested that North American output would fall. Large-scale strikes at several U.S. refineries could have additionally helped oil prices.
However, the fundamental factors suggest that we have witnessed only a technical correction and the bull market is not on the horizon. Why do we think so?
First, reduction in capital expenditures usually takes months or even years to translate to lower oil output. Undoubtedly, low oil prices are the best cure for low oil prices; however the supply is more inelastic than many analysts believe.
Second, global economic growth is slowing (yesterday, China cut its reserve-requirement ratio on concerns about slow economic growth). Therefore, we do not expect a significant increase in demand.
Third, inventories continue to build up. Actually, the crude stock is at levels not seen in many years. And according to the U.S. Energy Information Administration, the U.S. crude-oil supplies rose by 6.3 million barrels in the last week of January, much more than market had expected. Therefore, the oil market remains oversupplied.
Today’s fundamental analysis of the crude oil market was created by Arkadiusz Sieroń, the author or our monthly Market Overview reports.
Let’s jump into the world of charts to find out what are they saying about future moves (charts courtesy of http://stockcharts.com).
Crude Oil
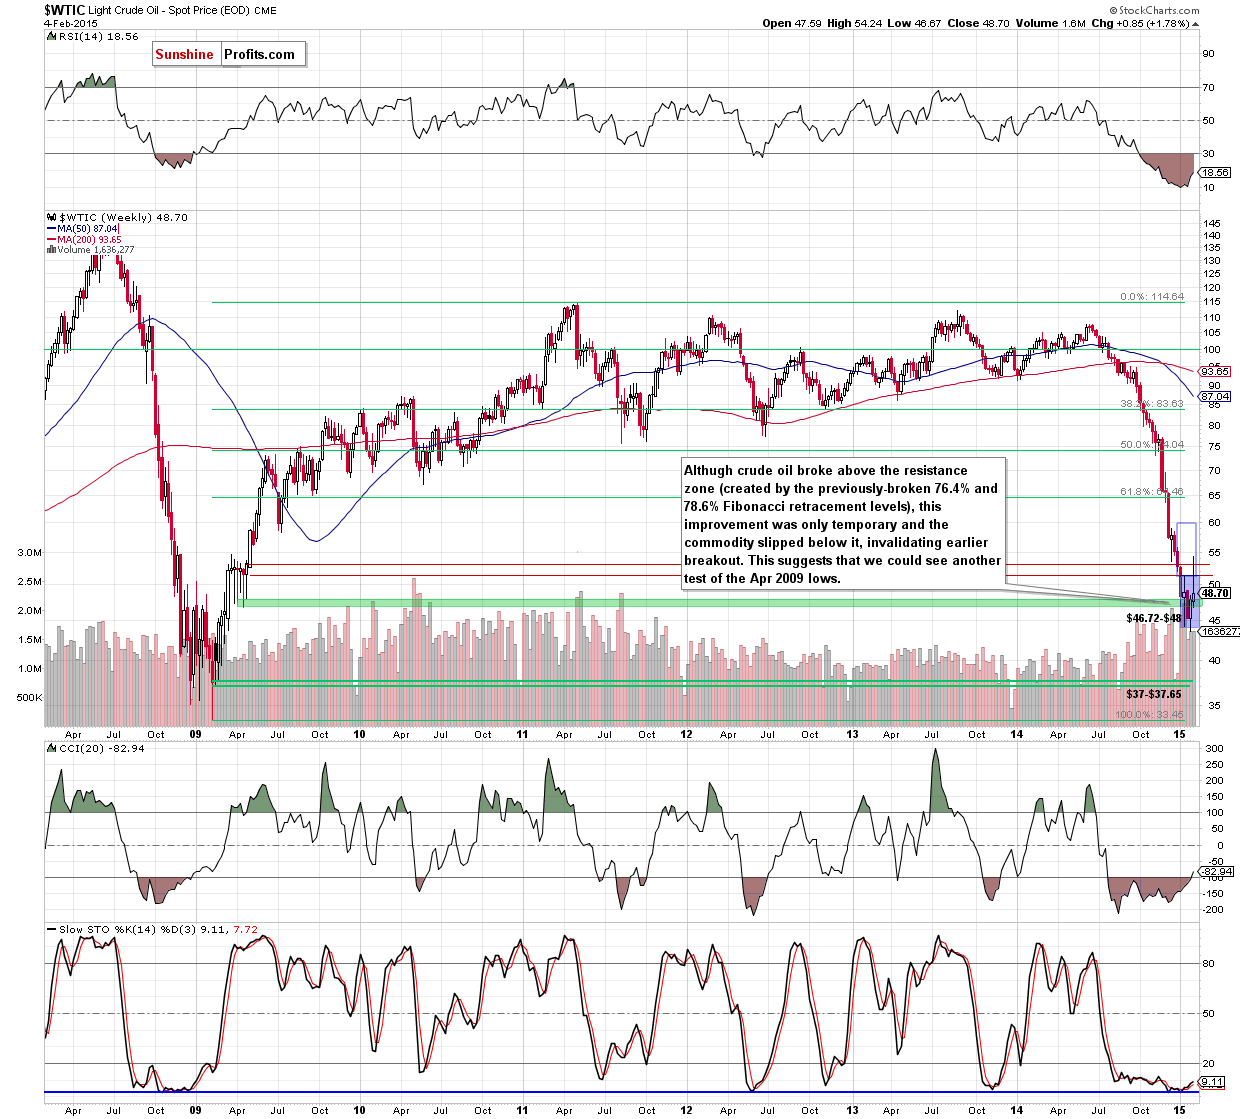
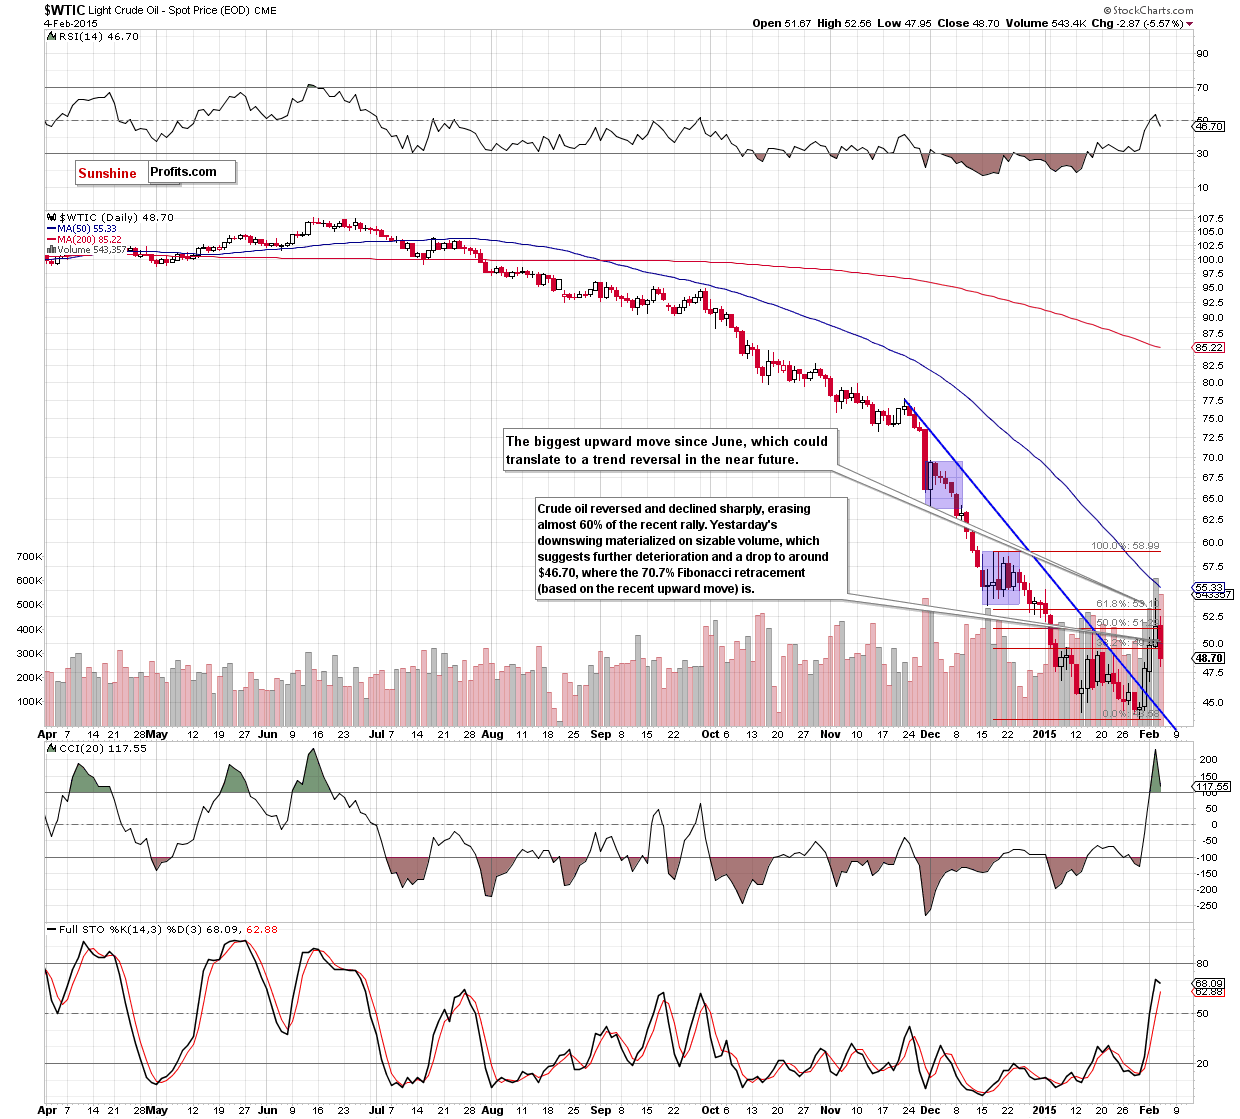
Although crude oil extended losses, slipping under the support zone created by the Apr 2009 lows and hitting a fresh multi-year low of $43.58, the commodity rebounded very sharply in the recent days. With this upward move, light crude climbed above its key resistance zone (created by the previously-broken 76.4% and 78.6% Fibonacci retracement levels marked with green on the weekly chart, the 50% Fibonacci retracement based on the mid-Dec-Jan decline and the Jan 15 high) and also broke slightly above the 61.8% Fibonacci retracement (based on the Dec-Jan decline) and the Dec lows. Despite this show of oil bulls’ strength confirmed by the rising volume, white candles were getting smaller. This interesting factor, in combination with Tuesday’s long upper shadow and an invalidation of the breakout above the 76.4% and 78.6% Fibonacci retracement levels (marked on the weekly chart), suggested a reversal and further declines. As you see on the daily chart, the situation developed in tune with the above-mentioned scenario and oil bears took the commodity lower, erasing almost 60% of the recent rally and approached the support zone based on the Apr 2009 lows. When we take a closer look at the above chart, we see that yesterday’s downswing materialized on a sizable volume (not as huge as a day before, but still much bigger than downswings that we saw in the previous month), which suggests further deterioration and a drop to around $46.70, where the 70.7% Fibonacci retracement (based on the recent upward move) and the Apr 2009 lows are.
Summing up, with the above in mind, we think that if we don’t see a fresh low in the coming days and crude oil successfully breaks above the recent high (which will also mean a breakout above the previously-broken 76.4% and 78.6% Fibonacci retracement levels marked with green on the weekly chart, the 61.8% Fibonacci retracement based on the mid-Dec-Jan decline and the Jan 15 high), we’ll consider opening long positions. Until this time, another attempt to move lower can’t be ruled out.
Having discussed the situation in crude oil, let’s examine the NYSE Arca Oil Index (XOI) to find out what the current outlook for oil stocks is.
Oil Stocks
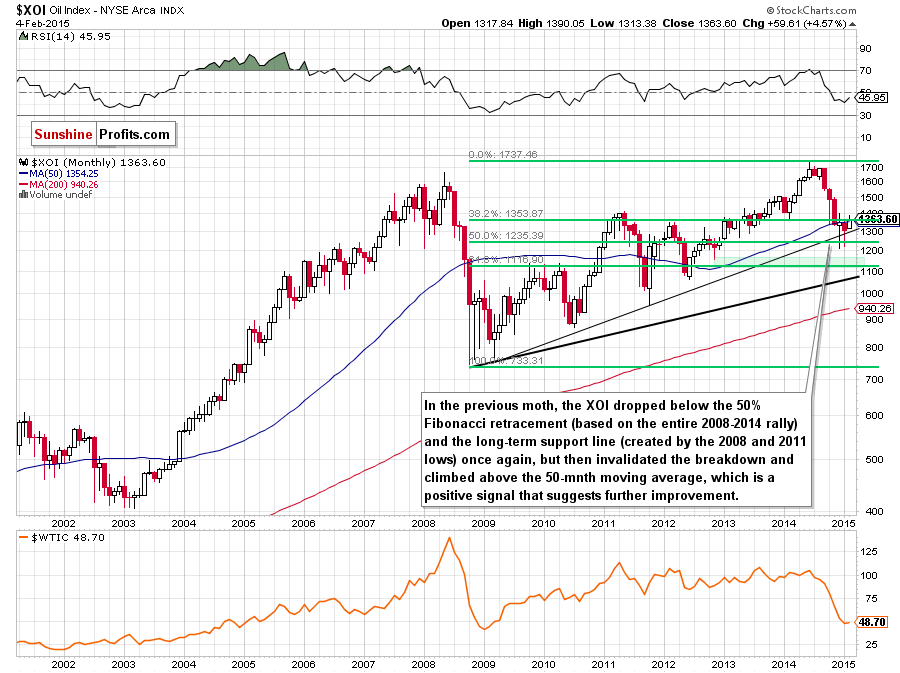
From the long-term perspective, we see that the XOI moved sharply lower in Jan, which approached oil stocks to the Dec low of 1,211. Despite this deterioration, the proximity to this support level and the psychologically important barrier of 1,200 triggered an upward move, which invalidated earlier breakdown below the 50% Fibonacci retracement (based on the entire 2008-2014 rally) once again. With this increase, oil stocks invalidated also the breakdown under the long-term support/resistance line (based on the Mar 2009 and Oct 2011 lows). These positive pushed the XOI above the previously-broken 50-month moving average and the 38.2% Fibonacci retracement (based on the entire 2008-2014 rally). In the previous months, these resistances encouraged oil bears to trigger downswings, but since they are broken, we could see further improvement (especially if the index breaks above the Dec high of 1,397 and the psychological barrier of 1,400). If this is the case, the initial price target for oil bulls would be around 1,500, where the next barrier and the Nov high are.
Having said that, let’s examine the weekly chart and look for more clues about future moves.
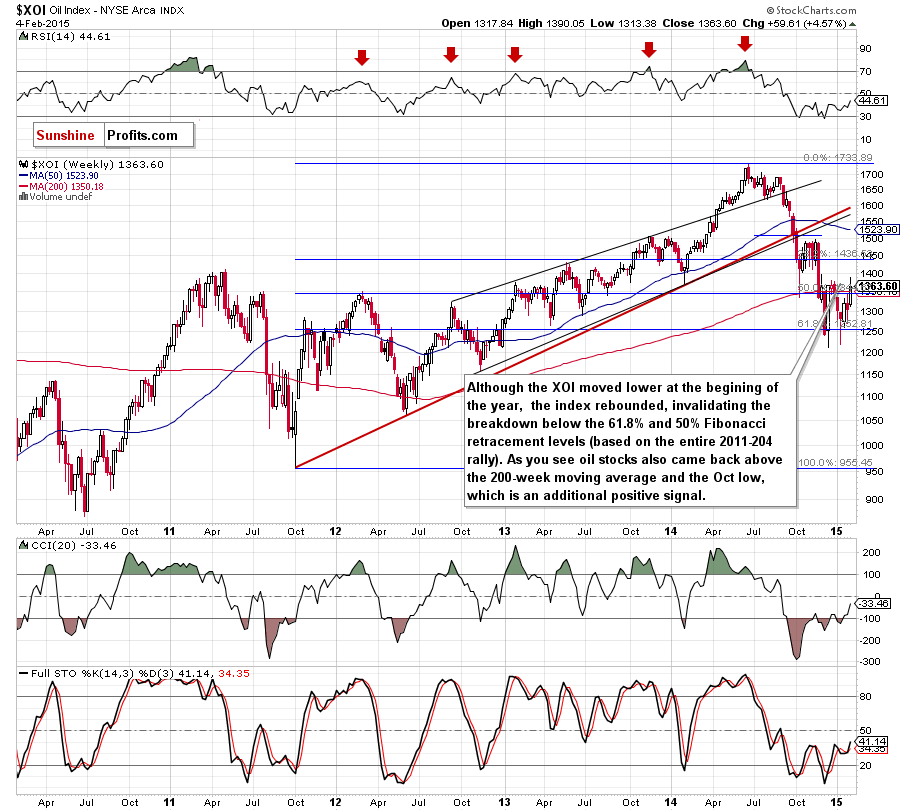
On the above chart, we see that although the XOI moved lower at the beginning of the previous month, the index rebounded, invalidating the breakdown below the 61.8% and 50% Fibonacci retracement levels (based on the 2011-2014 increase). As you see, with this upward move, oil stocks also came back above the 200-week moving average and the Oct low, which is an additional positive signal. On top of that, all indicators generated buy signals, supporting the bullish case (at least at the moment when these words are written).
Will we see further improvement? In our opinion the best answer to this question will be the analysis of the daily chart.
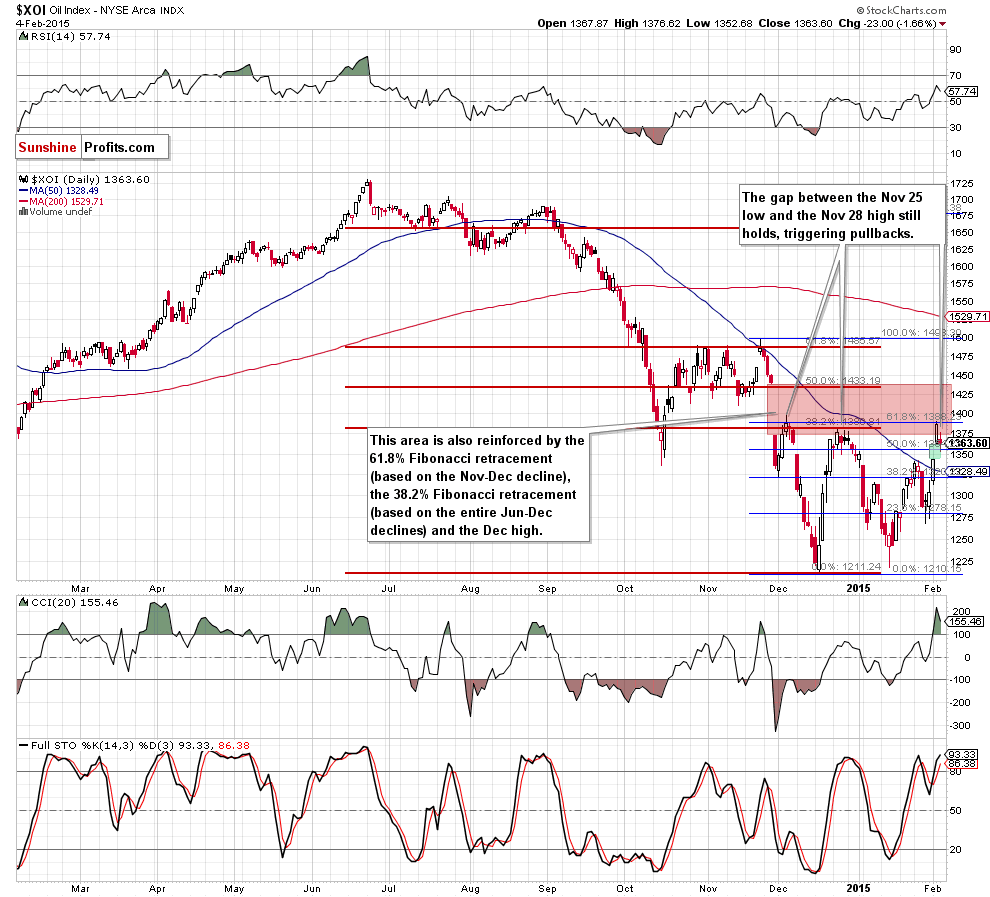
Looking at the above chart, we see that the XOI broke above the 50-day moving average at the beginning of the week, which accelerated further improvement. As a result, oil stocks shoot up on Tuesday, creating a green gap, which is the key support at the moment. With this rally, the index reached the strong resistance zone created by the combination of the 38.2% Fibonacci retracement (based on the Jun-Oct decline), the 61.8% Fibonacci retracement (based on the Nov-Dec decline), and the Dec 3 high once again. As you see on the daily chart, in the previous months, this solid area was strong enough to stop further improvement and trigger a sharp decline in the XOI. Taking this fact into account, and combining it with the current position of the indicators, it seems to us that we could see a short-lived weakness and a test of the green gap and the previously-broken 50-day moving average in the coming day(s).
Before we summarize this part of Oil Investment Update, we would like to draw your attention to the stocks-to-oil stocks ratio.
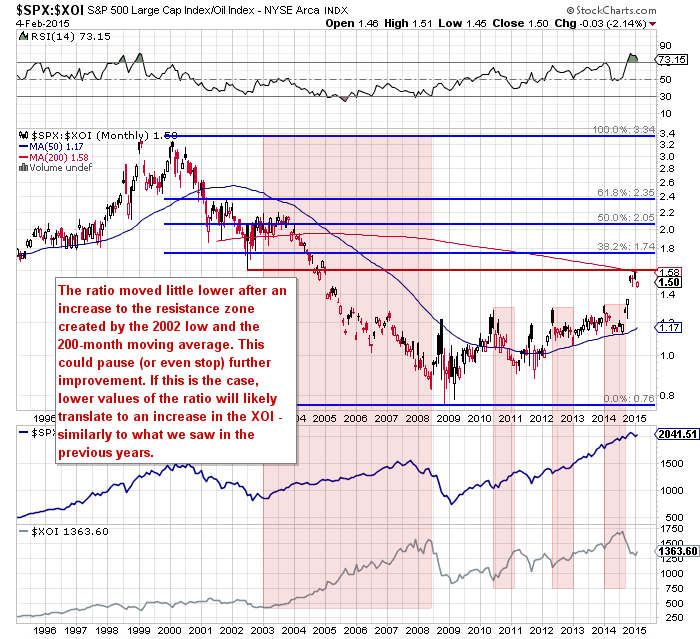
Looking at the above chart, we see that the ratio moved little lower after an increase to the resistance zone created by the 2002 low and the 200-month moving average, which translated to higher values of oil stocks. Taking the above into account, we think that this resistance area will be strong enough to pause for loner (or even stop) further improvement. What could happen if we see such price action? Let’s quote our previous Oil Investment Update:
(…) When we take a closer look at the monthly chart, we see that declining ratio has translated to higher values of the XOI in the past. We saw such relation between 2003 and 2008, from Jun 2010 to Mar 2011, from May 2012 to Jan 2013and from Jan 2014 to Aug 2014. Taking this fact into account, we think that a downward move from here would support the XOI and trigger a rebound in oil stocks in the coming month.
Summing up, in our opinion, as long as the XOI is trading below its key resistance zone created by the 38.2% Fibonacci retracement (based on the Jun-Oct decline), the 61.8% Fibonacci retracement (based on the Nov-Dec decline), and the Dec 3 high, another sizable upward move is questionable and a test of the green gap and the 50-day moving average in the coming day(s) should not surprise us. Nevertheless, the strong resistance zone seen on the stocks-to-oil stocks ratio’s chart still holds, which could translate to lower values of the ratio and rebound in oil stocks prices later in the coming month.
Ratio Analysis
Today, we start this section by focusing on the relationship between the general stock market and crude oil. What can we infer from the chart below?
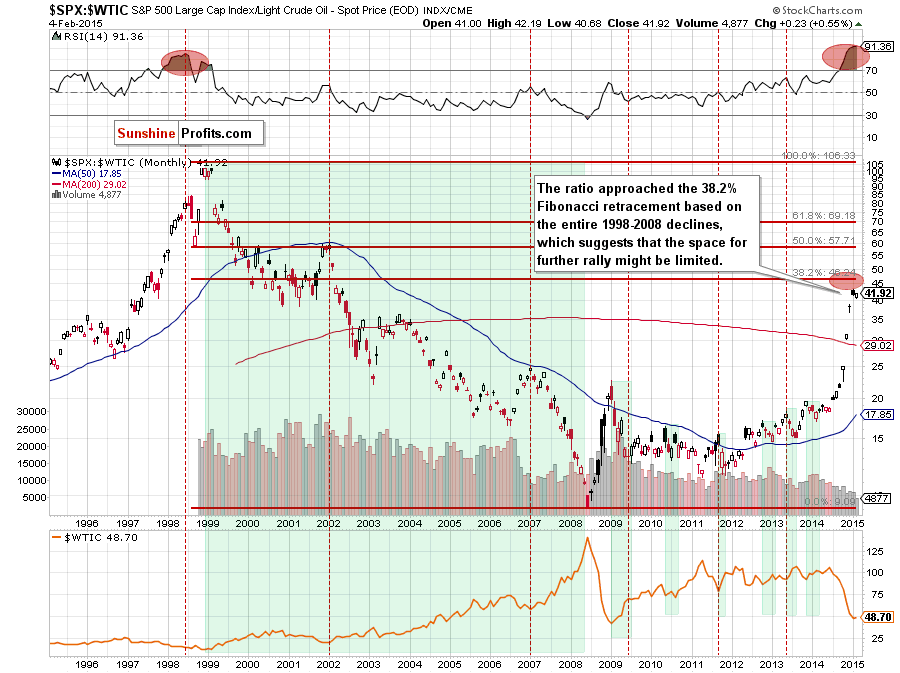
From this perspective, we see that the ratio moved little lower, which had a positive impact on the price of crude oil. Therefore, if the 38.2% Fibonacci retracement (based on the entire 1998-2008 declines) withstands a potential upswing, we might see a bigger correction in the ratio. What could happen if we see such price action? We believe that a quote from the last Oil Investment Update will be the best answer to this question:
(…) the space for further rally might be limited. If this is the case, and the ratio finally declines, we’ll see higher values of the commodity – similarly to what we saw in the past (for example between 1999 and 2008, from Jan 2009 to Jun 2009, from May 2010 to Apr 2011, from Sep 2011 to Nov 2011, from Oct 2012 to Jan 2013, from May 2013 to Aug 2013 and from Nov 2013 to Feb 2014). Taking all the above into account, we believe that it is worth to keep an eye on this ratio’s moves because a reversal in the ratio will probably indicates a final bottom in crude oil.
Once we know the current situation in the stocks-to-oil ratio, let’s analyze the gold-to-oil ratio.
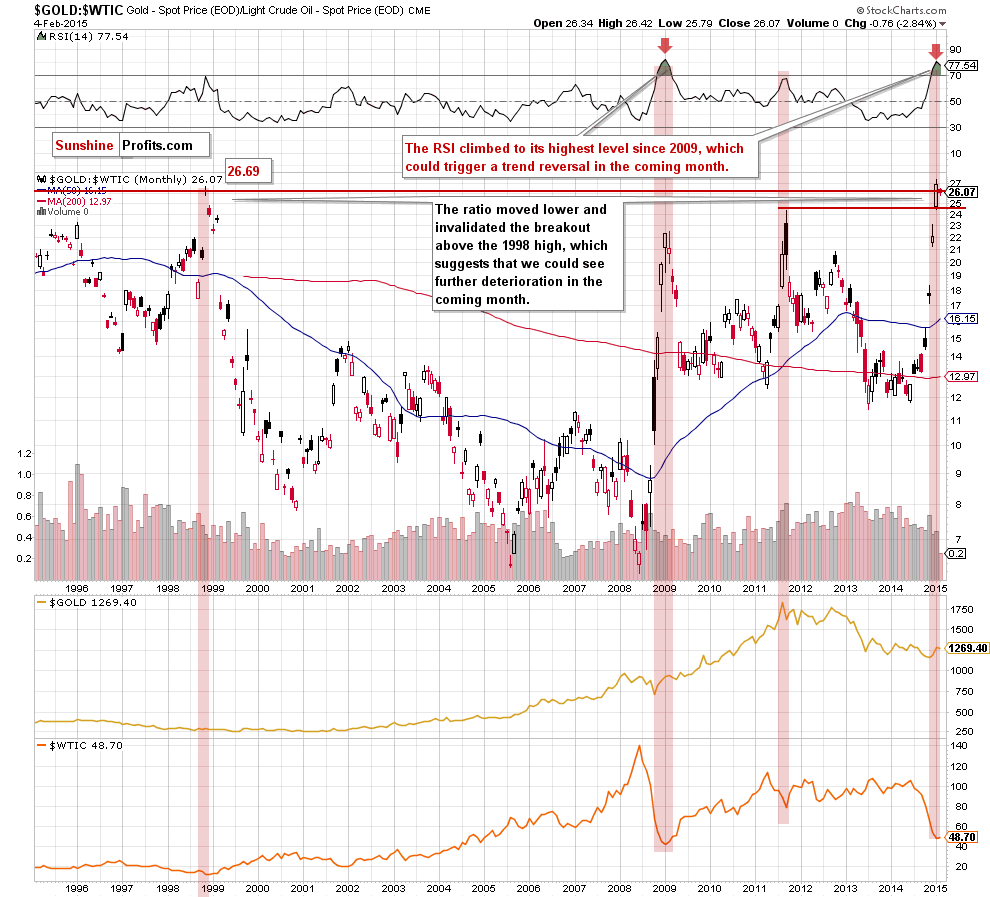
As you see on the monthly chart, the ratio broke above 1998 high, which pushed crude oil to the fresh multi-year low. Despite this move, the ratio reversed and declined, invalidating earlier breakout, which translated to the recent rally in the commodity. Taking into account the above-mentioned relationship and combining it with an invalidation of the breakout and the current position of the RSI, we think that a bigger correction in the ratio is just around the corner. At this point, it’s worth noting that in the previous years, similar (or even lower) readings of the indicator preceded tops in ratio and local bottoms in crude oil. Therefore, it seems to us that higher values of crude oil in the coming month should not surprise us.
With the above in mind, some of you may ask: what about gold? In our Gold & Silver Trading Alert posted yesterday, we wrote following:
(…) The times when the gold to oil ratio was as high as it has been recently were the times when we saw major tops in gold and major bottoms in oil (or at least they were at hand). The ratio was likely to move lower – and it has. It invalidated the breakout above the 1998 high, which is a major bearish signal. The RSI based on the gold to oil ratio was heavily oversold and moved back below the 70 level, thus confirming the change in the trend. No matter how we slice it, it seems that an important top in gold is right behind us.
Nevertheless, if you want to keep up with the changes taking place every day and receive trading signals, we encourage you to read our daily Gold & Silver Trading Alerts.
Non-USD Crude Oil Price
Know the situation for the above ratios, let’s move on to the non-USD (WTIC:UDN ratio) chart of crude oil. As a reminder, UDN is the symbol for the PowerShares DB US Dollar Index Bearish Fund, which moves in the exact opposite direction to the USD Index. Since the USD Index is a weighted average of the dollar's exchange rates with world's most important currencies, the WTIC:UDN ratio displays the value of crude oil priced in "other currencies".
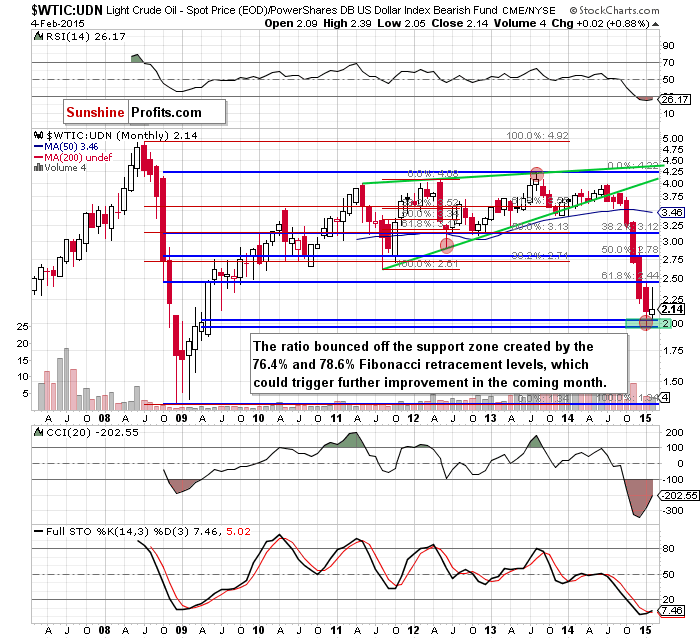
A month ago, we wrote the following:
(…) the ratio reached the support zone created by the 76.4% and 78.6% Fibonacci retracement levels (marked with green). In the past, this support/resistance area was strong enough to trigger a trend reversal. We saw such price action, for example, in Jun 2012 or in Aug 2013 (both marked with red ellipses). Taking this fact into account, and combining it with the current position of the RSI, which dropped to the lowest level since 2009, we think that another trend reversal is just around the corner and we could see a rebound in crude oil in the coming month.
As you see on the monthly chart, the situation developed in line with the above-mentioned scenario and the ratio bounced off its key support zone. This is a positive signal, which in combination with a buy signal generated by the Stochastic Oscillator and the current position of the RSI suggests that even if crude oil priced in "other currencies" moves little lower, the above-mentioned levels will be strong enough to stop further deterioration and encourage oil bulls to act.
Scenarios
Just like a month ago, today’s Oil Investment Update includes scenarios of what could happen in the coming weeks. Naturally, we will continue to monitor the market in the coming days and if anything invalidates our long-term outlook we will send you an additional message.
- Bullish scenario
The support zone created by the Apr 2009 lows will withstand the selling pressure, which will translate to higher crude oil’s prices. In this case, we’ll see a bigger corrective upward move from here to the initial upside target around $60. If mid-Dec highs are broken, the next target for oil bulls would be around $68 (the 38, 2% Fibonacci retracement based on the entire Jun-Jan declines) or even around $76 (the 38, 2% Fibonacci retracement). - Bearish scenario
If the commodity extended losses and broke below the recent low of $43.58, we could see a drop to $40 (the next psychologically important barrier) or even to around $37-$37.65, where the next support zone is.
Summary
Although the situation in crude oil has deteriorated at the end of the previous month as the commodity extended losses and hit a fresh multi-year low of $43.58, crude oil rebounded sharply in the recent week, which resulted in the biggest upward move since June. As we have pointed out before, this rally materialized on rising volume (Tuesday’s volume was the highest since Apr), which confirms that oil bulls are getting stronger. Taking this fact into account, and combining it with the current situation in the above-mentioned ratios (the stocks-to-oil ratio reversed after an increase to slightly below the 38.2% Fibonacci retracement based on the entire 1998-2008 declines, the gold-to-oil ratio invalidated the breakout above the 1998 high, while the WTIC:UDN ratio bounced off the support zone created by the 76.4% and 78.6% Fibonacci retracement levels), we think that a trend reversal is just around the corner. In our opinion, this scenario will be even more likely if we do not see a fresh 2015 low in the coming days and crude oil closes another day (and preferably the week) above the 61.8% Fibonacci retracement based on the Dec-Jan decline. Before we take a look at outlooks, please keep in mind that it is worth to keep an eye on the above ratios, because their trend reversals will probably indicates final bottom in crude oil.
Very short-term outlook: mixed
Short-term outlook: mixed
MT outlook: mixed
LT outlook: bullish
Trading position (our opinion): No positions are justified from the risk/reward perspective at the moment. However, if we see another daily close above the Jan 15 high of $51.27, we’ll consider opening long positions. Until this time, waiting on the sidelines for the confirmation/invalidation of the above is the best choice. We will keep you informed should anything change.
This completes this month’s Oil Investment Update. Our next Oil Investment Update is scheduled for Thursday, Mar 5, 2015. Oil Trading Alerts subscribers will additionally receive similar but shorter alerts on a daily basis (or more than once a day when the situation requires it). You – Oil Investment Updates subscribers – will receive short Investment Alert messages should the outlook for the medium or long term change before the next Update is posted.
Thank you.
Nadia Simmons
Forex & Oil Trading Strategist
Oil Investment Updates
Oil Trading Alerts

