

This month’s Oil Investment Update we begin with the words that we used to summarize the situation in the previous update (on Jun 10, 2016). We summarized the situation in the following way:
The last few weeks have brought further increases in oil prices, which resulted in a breakout not only above the barrier of $ 50, but also in a climb slightly above the Oct high. Despite this improvement, oil bulls didn’t manage to hold gained levels, which resulted in invalidation of earlier small breakout above this peak, verification of the breakdown below the medium-term green resistance line (…). Taking into account strong negative correlation between (…) ratios and the price of the commodity, we think that increases in the ratios will translate into lower values of crude oil (…) and (…) we’ll see further deterioration and a realization of the bearish scenario in the coming weeks:
(…) If the commodity extends declines (…), the first downside target would be the blue support line based on the late May and Jun lows (currently around $48.50) and the green support zone created by the late-May and Jun lows (around $47.40-$47.75).
From today’s point of view, we see that the situation developed in line with the above scenario and crude oil not only reached the above zone, but also closed yesterday’s session below it after yesterday’s U.S. Energy Information Administration’s report. Thursday’s data showed that U.S. crude oil inventories declined by 2.223 million barrels in the week ended July 1, missing analysts' expectations. The report also showed that gasoline inventories dropped by 0.122 million barrels, compared to expectations for a decrease of 0.353 million barrels, which affected negatively investors’ sentiment and pushed the commodity sharply lower. As a result, light crude closed the day under the previous lows and the short-term support zone. Will oil bears push the commodity lower in the coming weeks? Let’s jump right into charts (charts courtesy of http://stockcharts.com) and try to find answer to this question.
Crude Oil
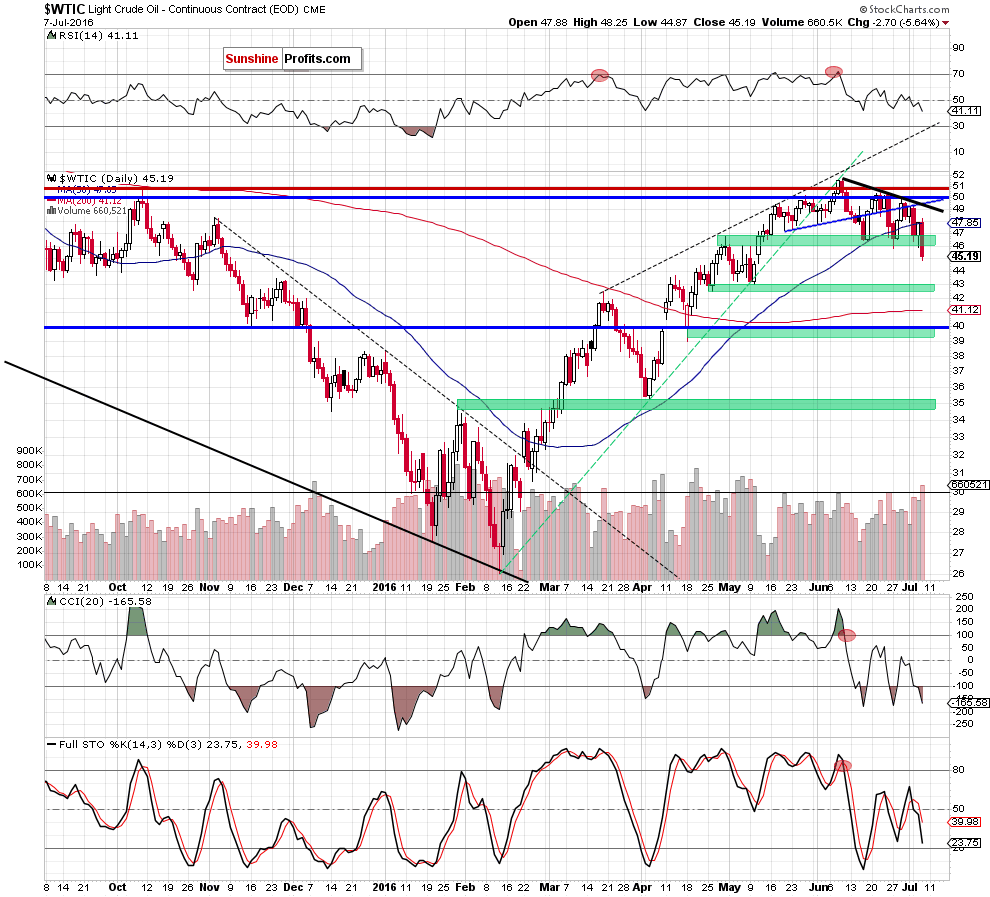
From today’s point of view, we see that two unsuccessful attempts to come back above the barrier of $50 in combination with the third breakdown under the blue support line encouraged oil bears to show their claws, which resulted in a sharp decline, not only below the 50-day moving average and the Jun low, but also under the Apr high, which resulted in an invalidation of earlier breakout. Thanks to yesterday’s decline, light crude closed the session under the green support zone, which suggests further deterioration in the coming day(s) – especially when we factor in a sell signal generated by the Stochastic Oscillator and the size of volume that accompanied Thursday’s move (which was much bigger compared to what we saw in previous days). Therefore, taking all the above into account, we think that the commodity will extend losses and test the strength of the next green support zone (around $42.50-$43.25) in the coming week.
How did this move affect the weekly chart? Let’s check.
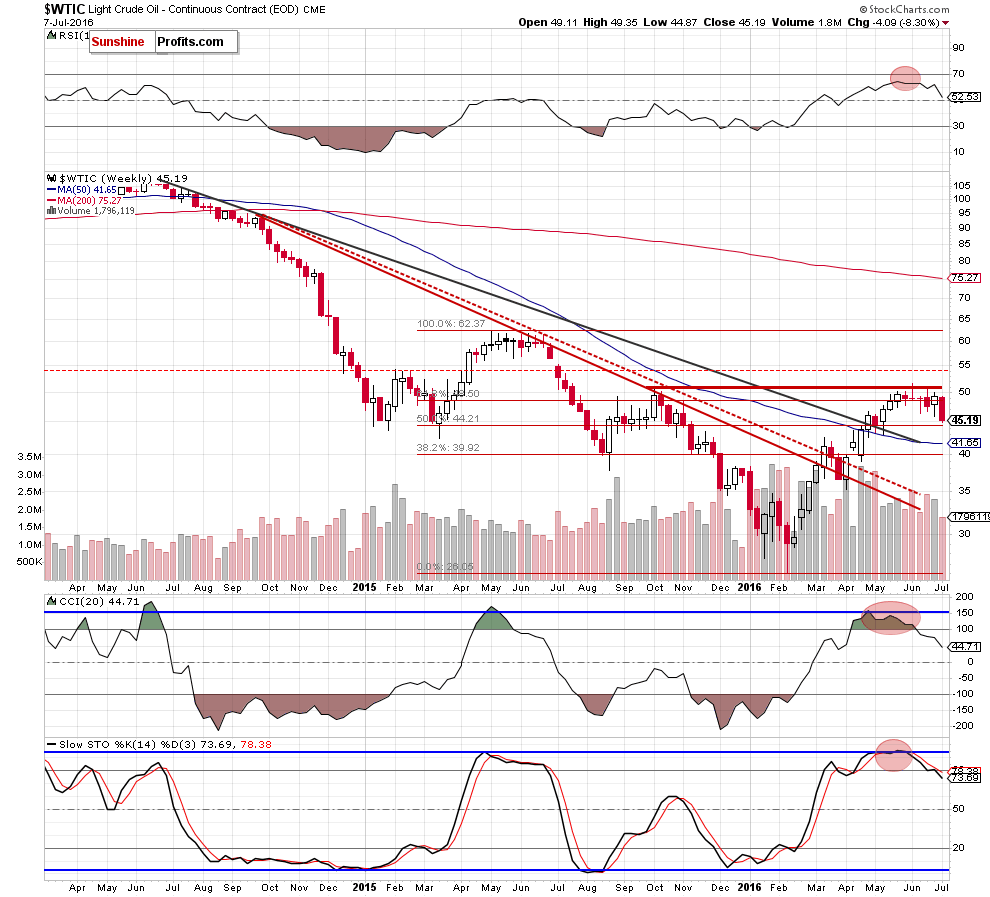
From the weekly perspective, we see that invalidation of the breakout above the 61.8% Fibonacci retracement triggered further deterioration, which in combination with sell signals generated by the indicators suggests lower prices of light crude in the coming week(s).
Are there any other factors, which could support the above pro bearish scenario? Let’s examine the monthly chart and find out.
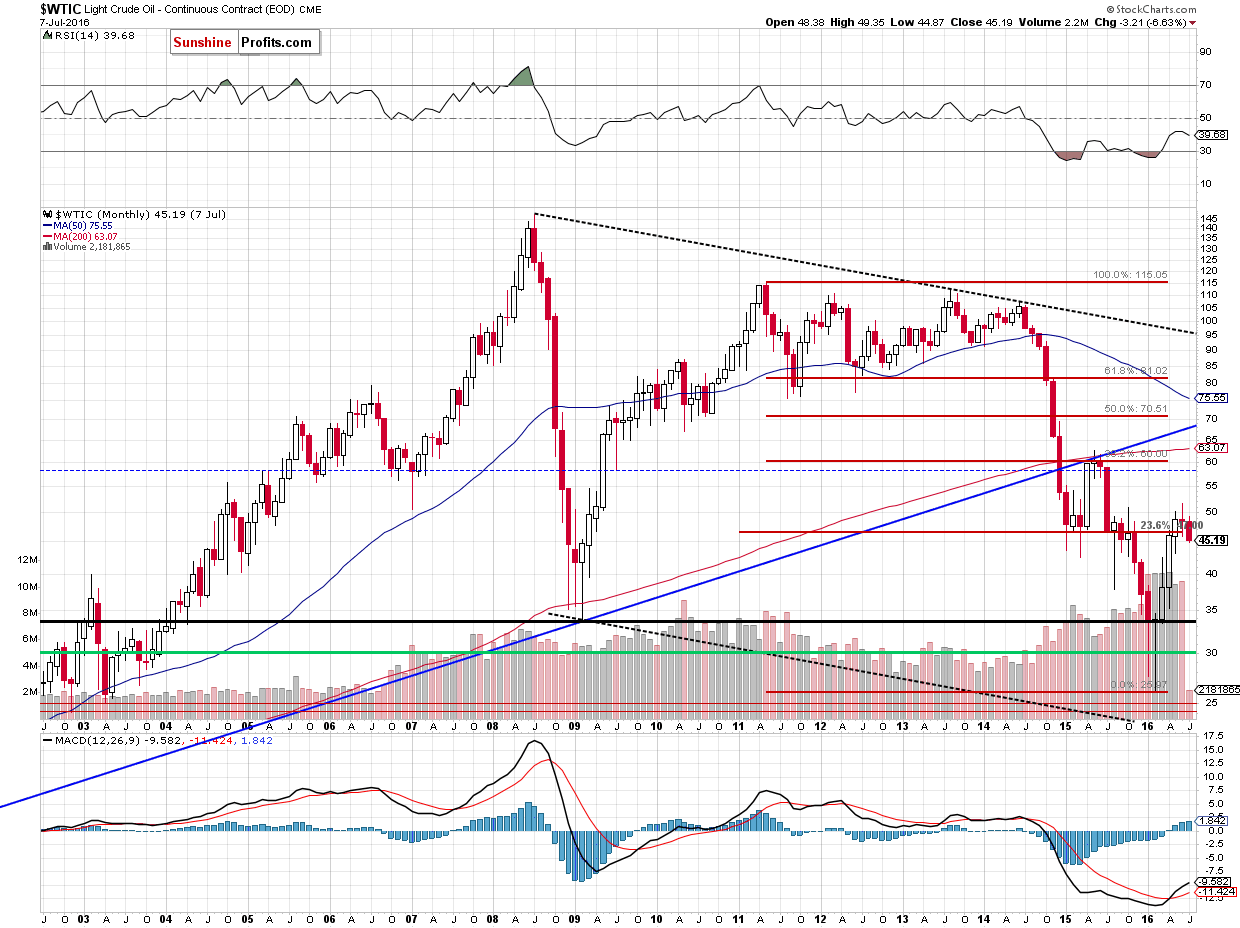
On the long-term chart, we see that although crude oil extended gains in the previous month, oil bulls didn’t manage to hold gained levels, which resulted in a decline earlier this month. As a result, crude oil dropped under the previously-broken 23.6% Fibonacci retracement, invalidating earlier breakout, which is an additional negative signal that could encourage oil bears to push the commodity lower.
Summing up, crude oil dropped not only under the Jun low, but also below the Apr high and the green support zone on significant volume, which increases the probability of further declines and suggests a test of the strength of the next green support zone (around $42.50-$43.25) in the coming week.
Having discussed the situation in crude oil, let’s examine the NYSE Arca Oil Index (XOI) to find out what the current outlook for oil stocks is.
Oil Stocks
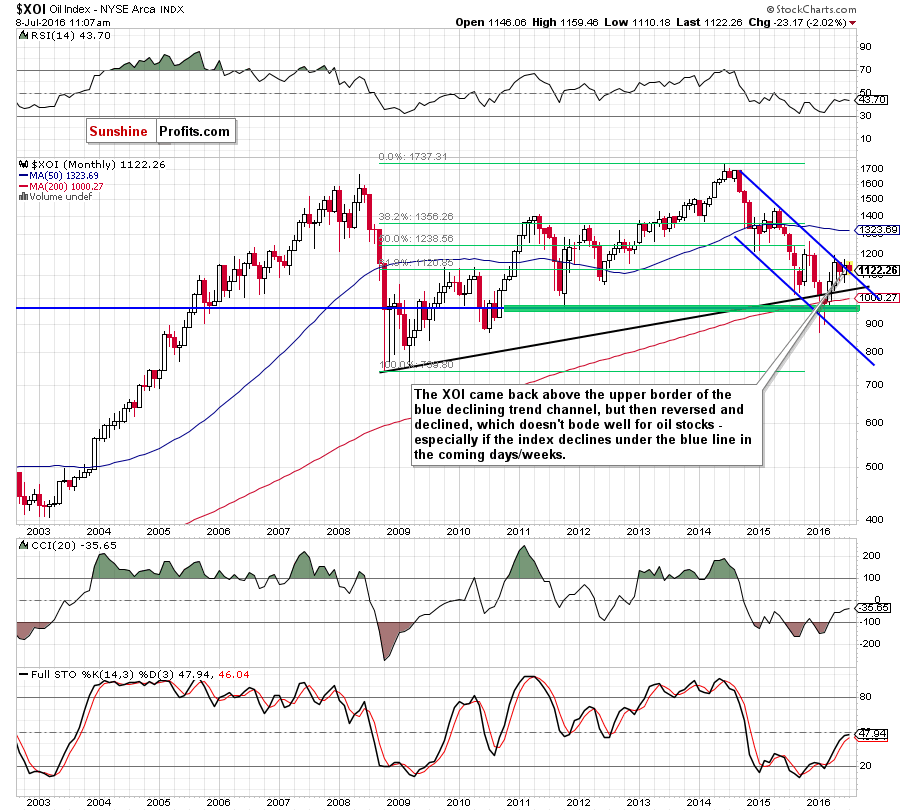
Looking at the monthly chart, we see that although oil bulls pushed the XOI above the upper border of the blue declining trend channel, they didn’t manage to hold gained levels, which resulted in a decline earlier this month. Therefore, in our opinion, as long as there won’t be monthly closure above this important line, another attempt to move lower is likely.
Will the medium-term chart give us more clues about future moves? Let’s examine the weekly chart and find out what can we infer from it.
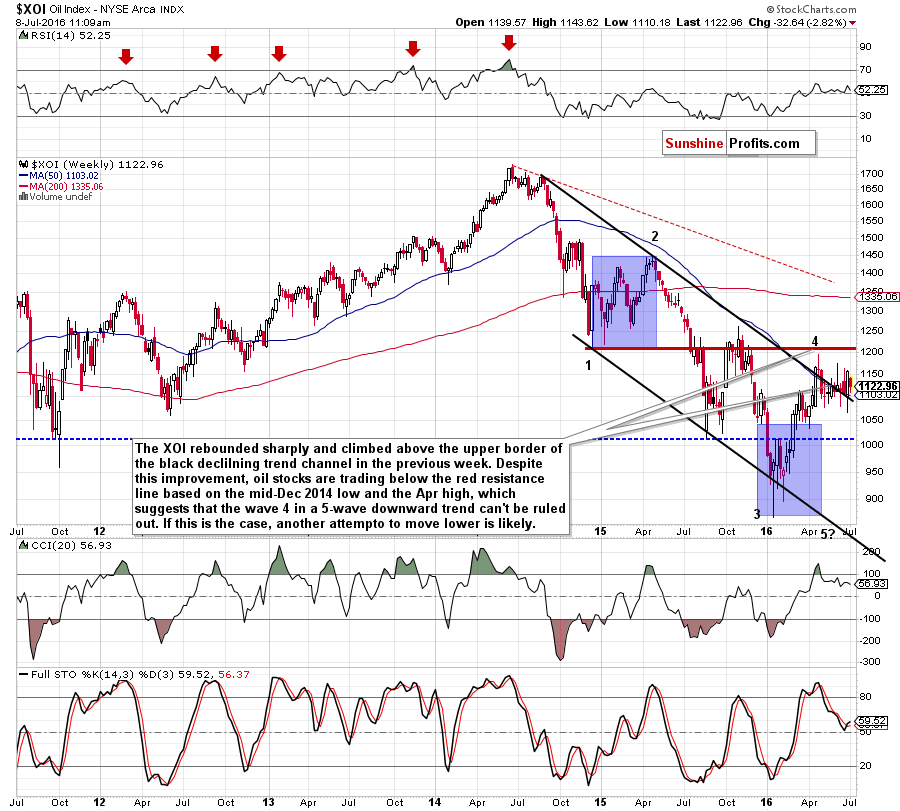
From this perspective, we see that the overall situation hasn’t changed much since our previous Oil Investment Update was posted as the XOI is consolidating above the upper border of the black declining trend channel. This means that as long there won’t be breakdown under this important support line or a breakout above the Apr high and the red resistance line another bigger move is not likely to be seen.
Nevertheless, we should keep in mind what we wrote a month ago:
(…) oil stocks are still trading under the recent high of 1,994 and the red resistance line based on the mid-Dec 2014 low (the bottom of the potential first wave), which suggests that the 4 in a 5-waves downward trend (according to Elliot’s waves theory) may be still in play. If this is the case, another decline in the coming weeks should not surprise us – especially if the index comes back to the black trend channel.
Having said the above, let’s check the daily chart.
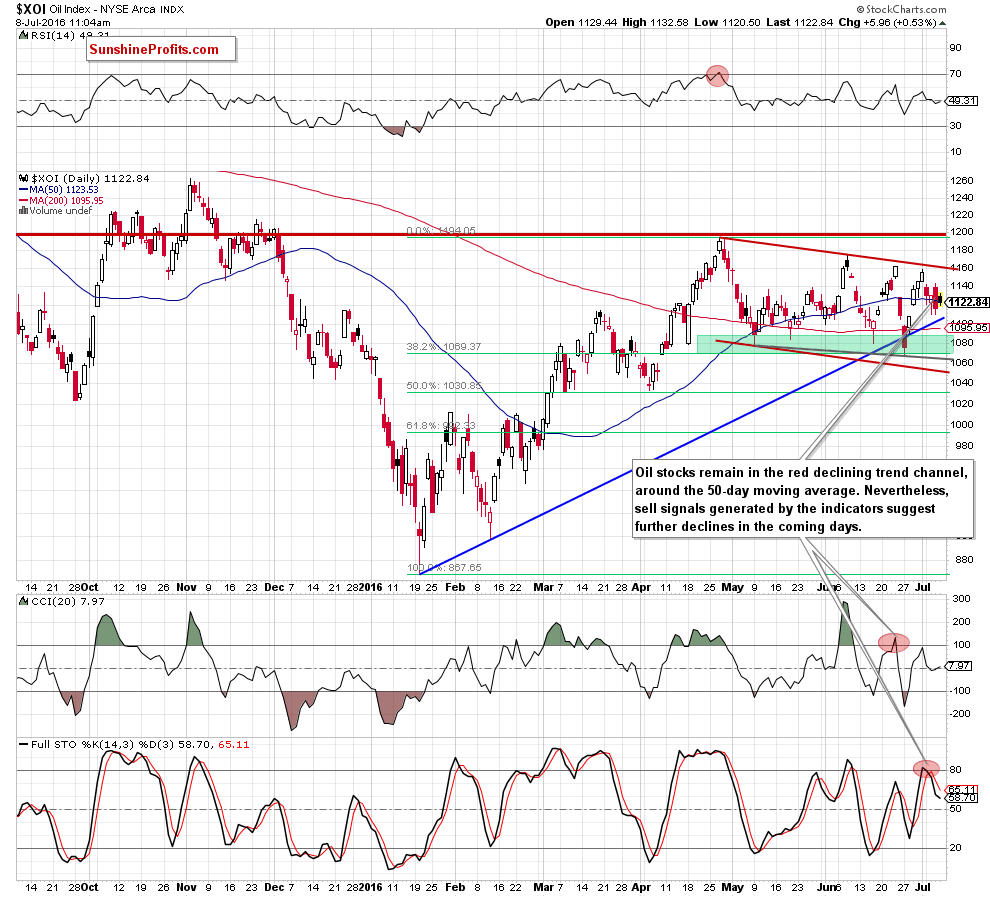
From this perspective, we see that the green support zone in combination with the 38.2% Fibonacci retracement level (based on the Jan-Apr rally) encouraged oil bulls to act, which resulted in an upward move that approached oil stocks to the upper border of the red declining trend channel. As you see on the chart, the proximity to this resistance was enough to encourage oil bears to act in the previous month, which suggests that we may see similar price action in the coming week(s) – especially if the XOI declines under the medium-term blue support line (this scenario is also reinforced by sell signals generated by the indicators). If this is the case, and oil stocks extend declines, the initial downside target would be the 38.2% Fibonacci retracement level and the Jun low of 1,067.
Summing up, although oil stocks rebounded in recent weeks, they are still trading under the upper border of the red declining trend channel marked on the daily chart. However, the similarity to the last month’s price action in combination with sell signals generated by the daily indicators suggests that another re-test of the green support zone and the 38.2% Fibonacci retracement level is just a matter of time.
Ratio Analysis
Today, we start this section by focusing on the oil-to-oil stocks ratio. What can we infer from the chart below?
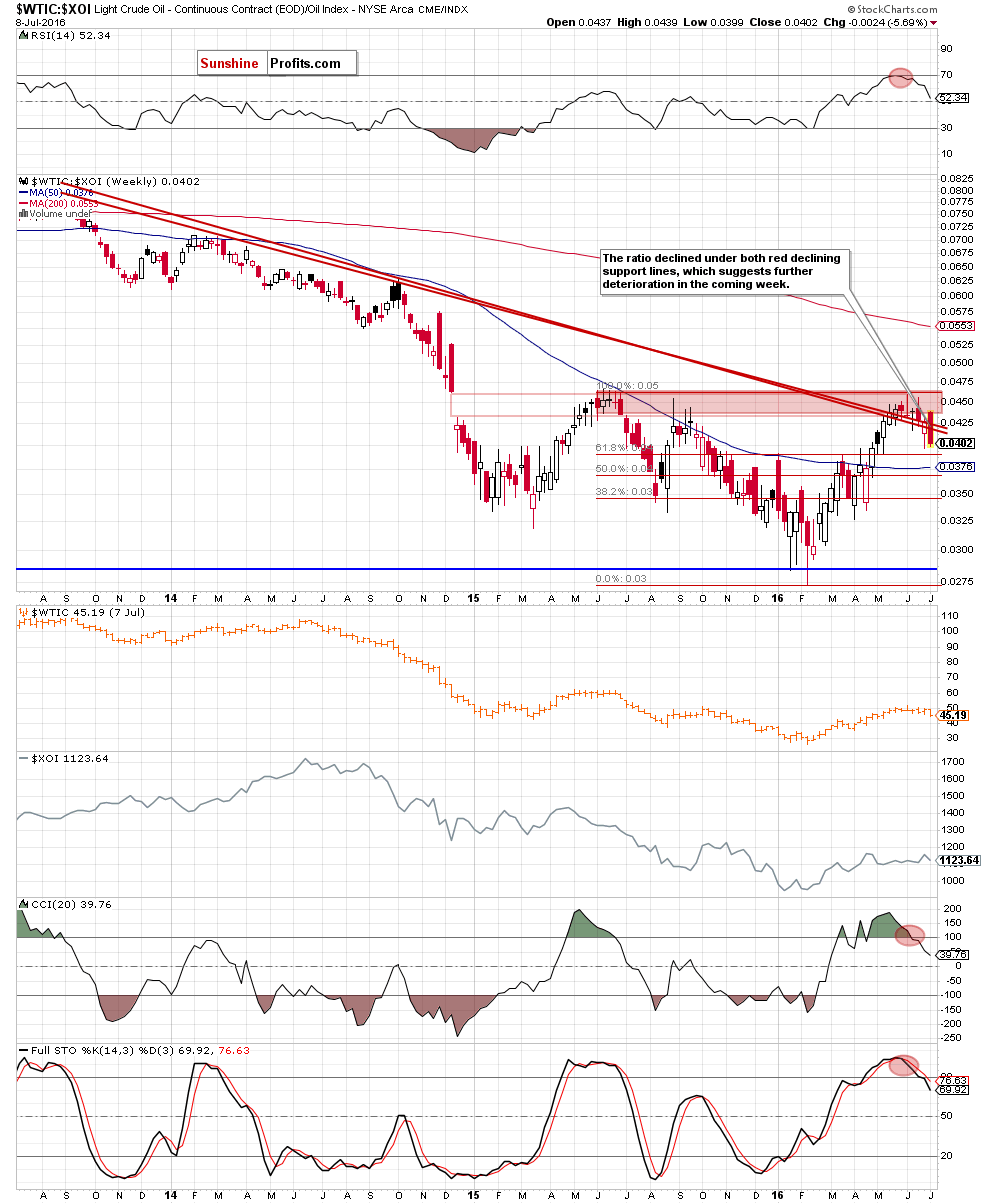
The first thing that catches the eye on the above chart is breakdown under both red declining support lines, which is a negative signal that suggests further deterioration in the coming week(s) – especially when we factor in sell signals generated by the CCI and the Stochastic Oscillator. What does it mean for light crude? As you see on the above chart, there is a strong positive correlation between the ratio and crude oil, which means that lower values of the ratio will translate into lower prices of the commodity – similarly to what we saw in any cases in the past.
Will the oil-to-gold ratio confirm this scenario? Let’s check the chart below and find out.
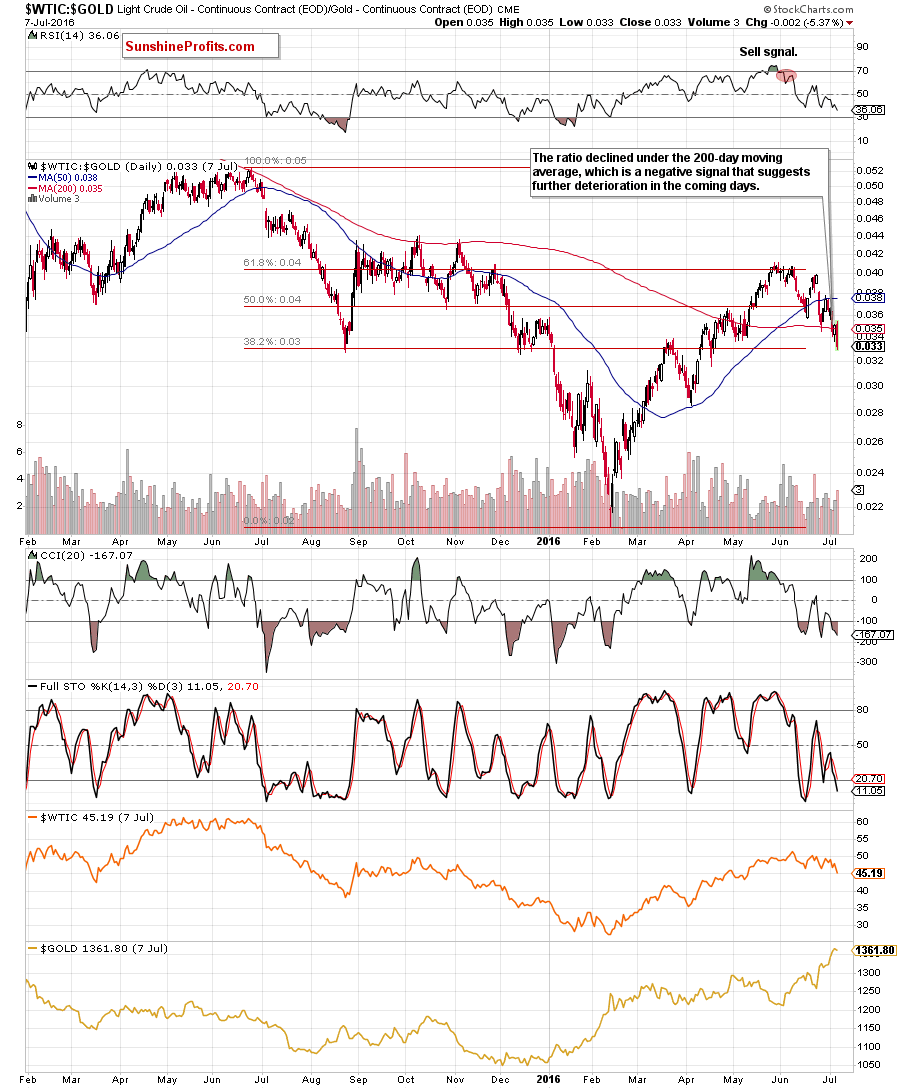
On the daily chart, we see that the ratio extended losses in recent days, which resulted in a drop under the 200-day moving average. Additionally, the ratio closed yesterday’s session below it, which is an additional bearish signal. On top of that, a sell signal generated by the Stochastic Oscillator remains in play, supporting further deterioration in the coming days.
What impact did this move have on the weekly chart? Let’s check.
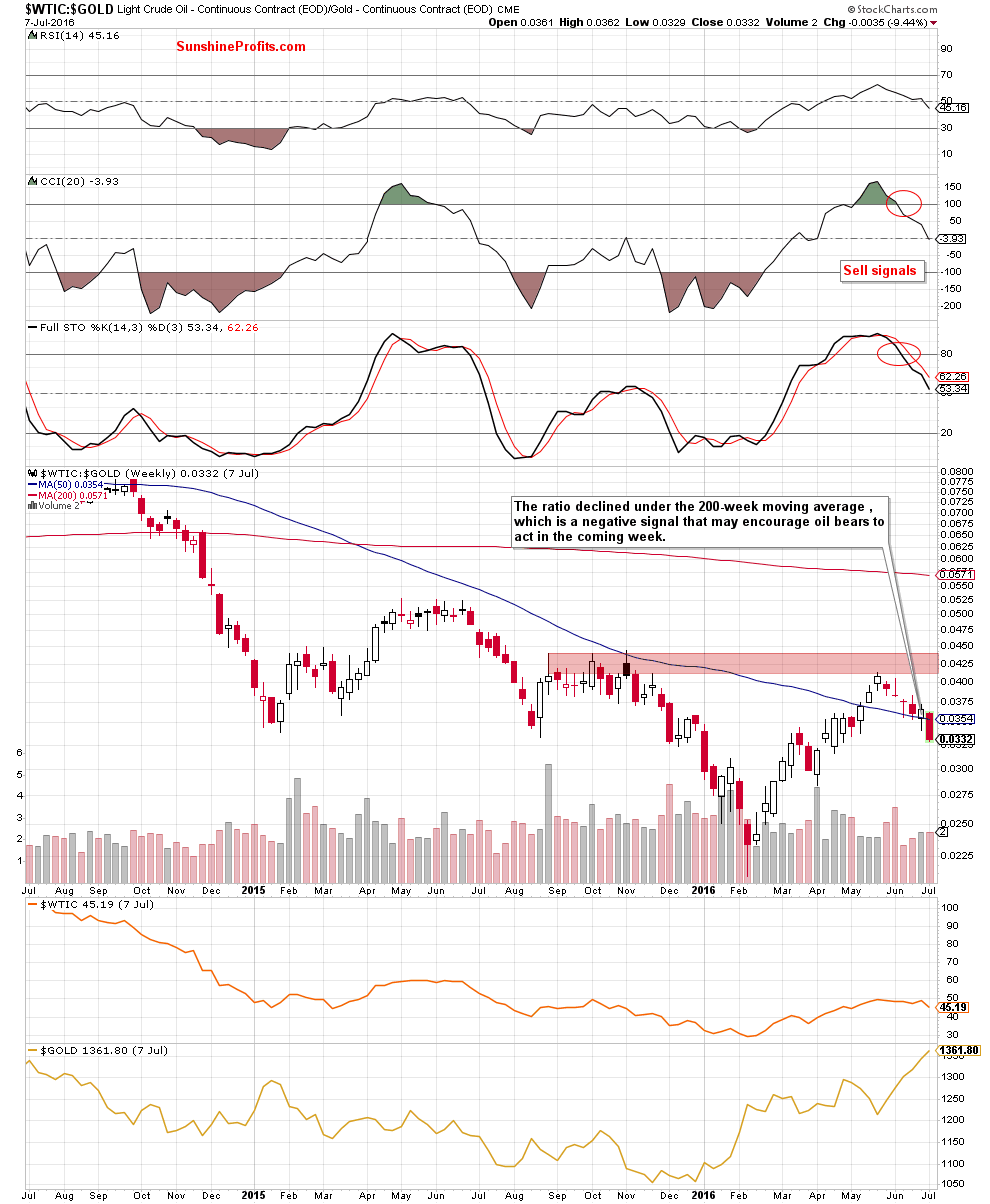
From this perspective, we see that the ratio declined under the 50-week moving average, which in combination with sell signals generated by the CCI and Stochastic Oscillator is another pro bearish factor that suggests further deterioration in the ratio. What impact such price action could have on crude oil? Similarly to what we wrote in the case of the oil-to-oil stocks ratio, there is a strong positive correlation between the above ratio and the price of crude oil. Therefore, another downswing in the ratio will correspond to another drop in the commodity.
Having said the above, let’s zoom out our picture and examine the long-term chart of the above ratio.
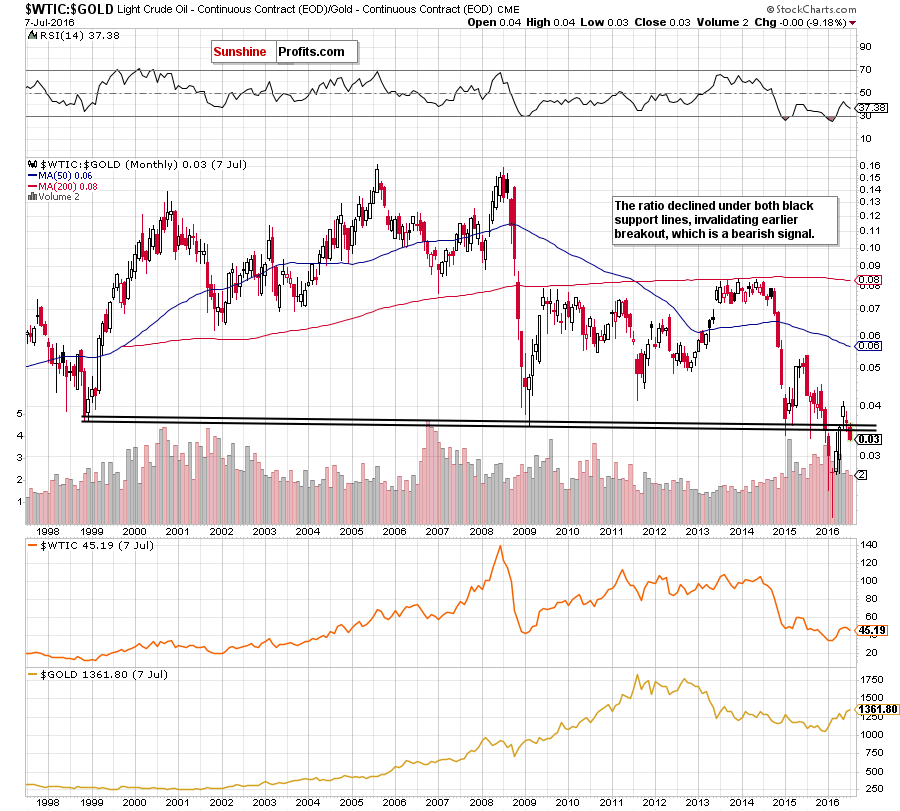
From the monthly perspective, we see that the ratio declined under both black support lines, invalidating earlier breakout, which is a bearish signal that suggests further declines (in the ratio and in crude oil) in the coming days/weeks.
Once we know the above, let’s check what we can infer from the oil-to-silver ratio.
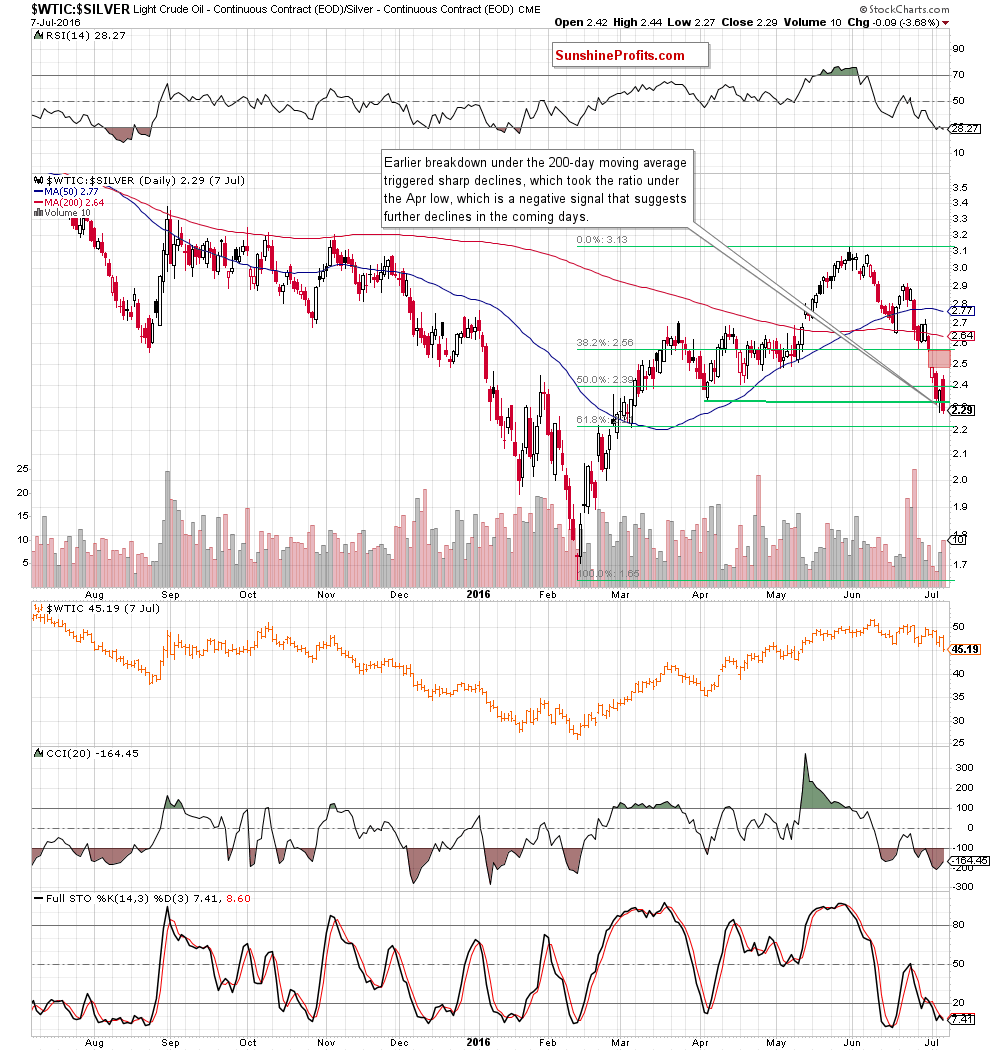
Looking at the daily chart, we see that the breakdown under the 200-day moving average accelerated declines, which resulted in a bearish gap (marked with red) and further deterioration in recent days. Thanks to yesterday’s drop the ratio declined under the Apr low and closed the day below it, which is a negative signal that suggests (at least) a test of the 61.8% Fibonacci retracement based on the entire Feb-Jun upward move. If this is the case, and we see such price action, lower values of the ratio will translate into lower prices of crude oil – similarly to what we saw many times in the past.
Will we find more negative signals on the weekly chart? Let’s check.
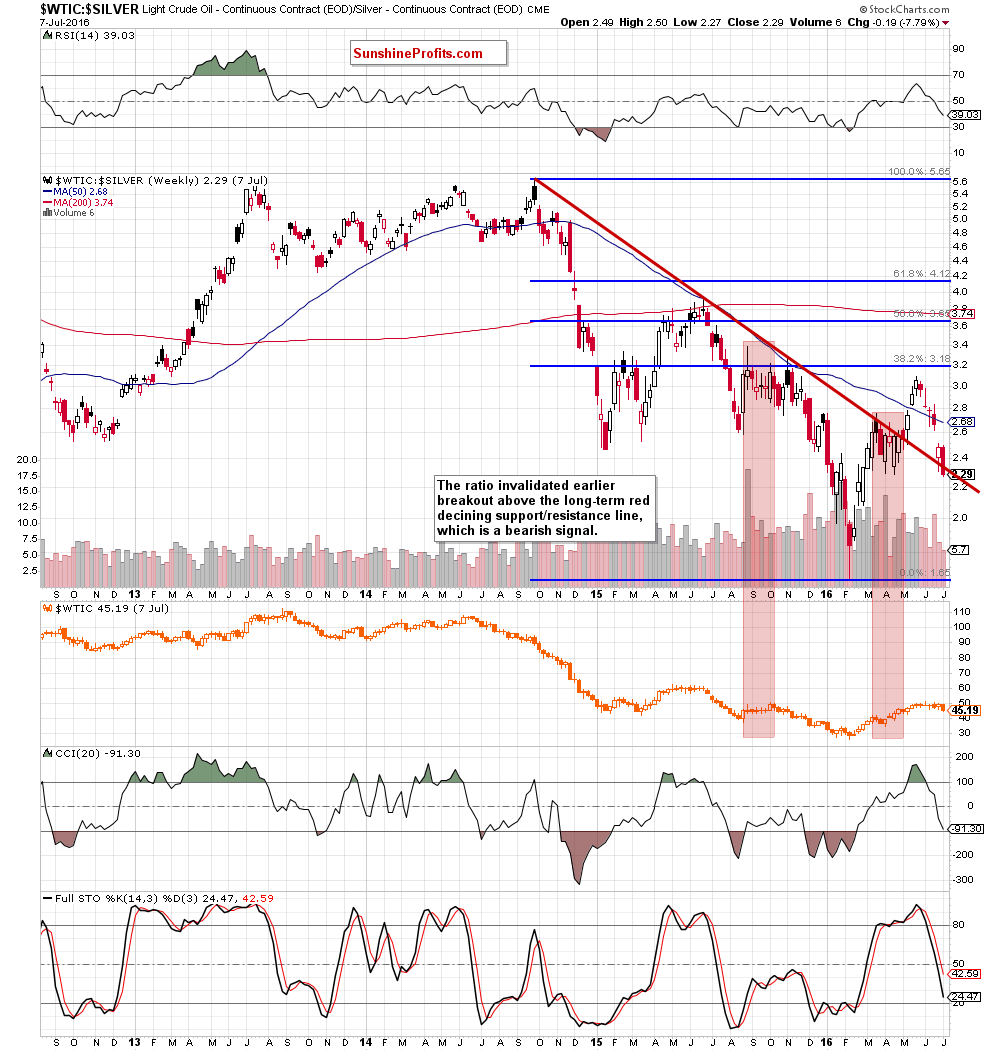
The first thing that catches the eye on the above chart is breakdown under the previously-broken long-term red declining line. Thanks to this drop, the ratio invalidated earlier breakout above this important line, which is a strong bearish event. Additionally, sell signals generated by the indicators are still in play, supporting further declines in ratio and also in crude oil in the coming week(s).
Having said the above, let’s take a look at the same chart from the long-term perspective.
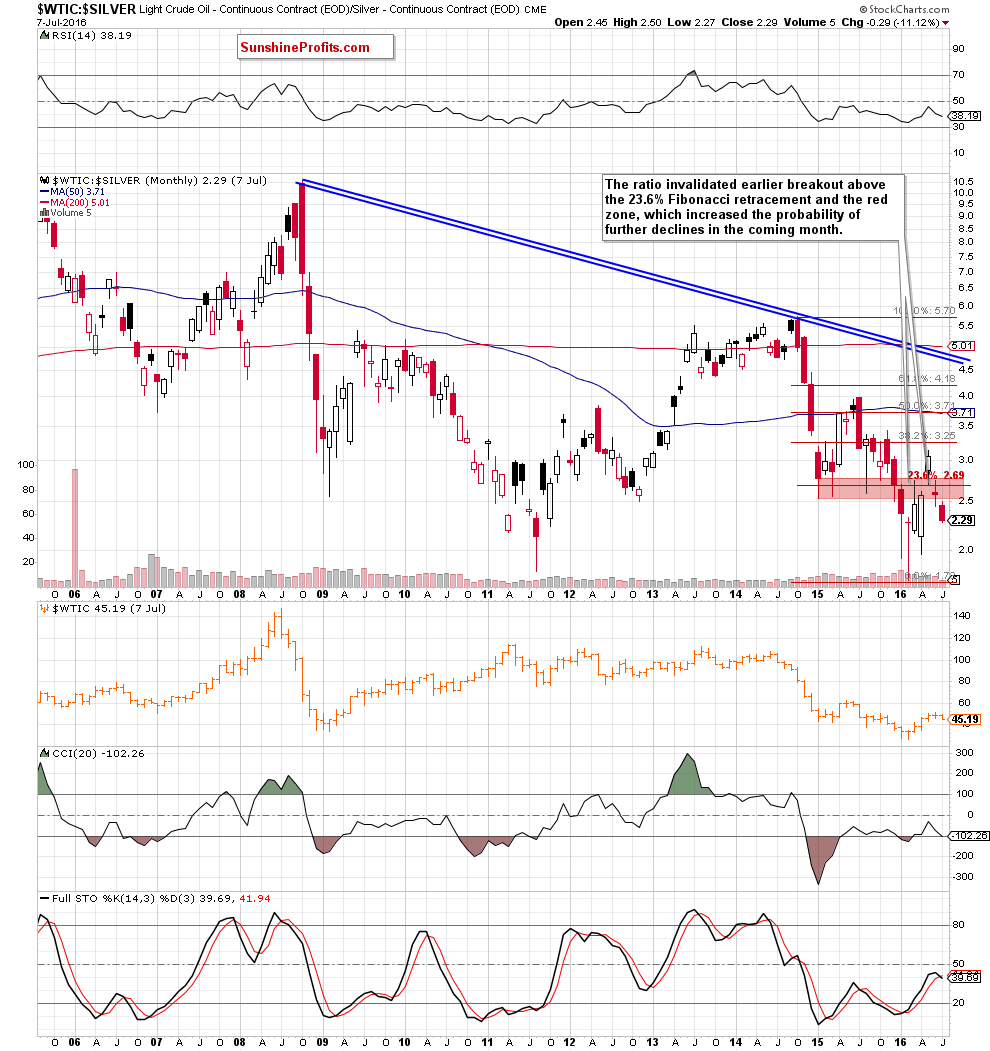
On the monthly chart, we see that the ratio invalidated earlier breakout above the 23.6% Fibonacci retracement (based on the entire 2014-2016 downward move) and the red zone, which means that oil bears have another negative signal, which could encourage them to push crude oil lower in the coming week(s).
Non-USD Crude Oil Price
Know the situation for the above ratios, let’s move on to the non-USD (WTIC:UDN ratio) chart of crude oil. As a reminder, UDN is the symbol for the PowerShares DB US Dollar Index Bearish Fund, which moves in the exact opposite direction to the USD Index. Since the USD Index is a weighted average of the dollar's exchange rates with world's most important currencies, the WTIC:UDN ratio displays the value of crude oil priced in "other currencies".
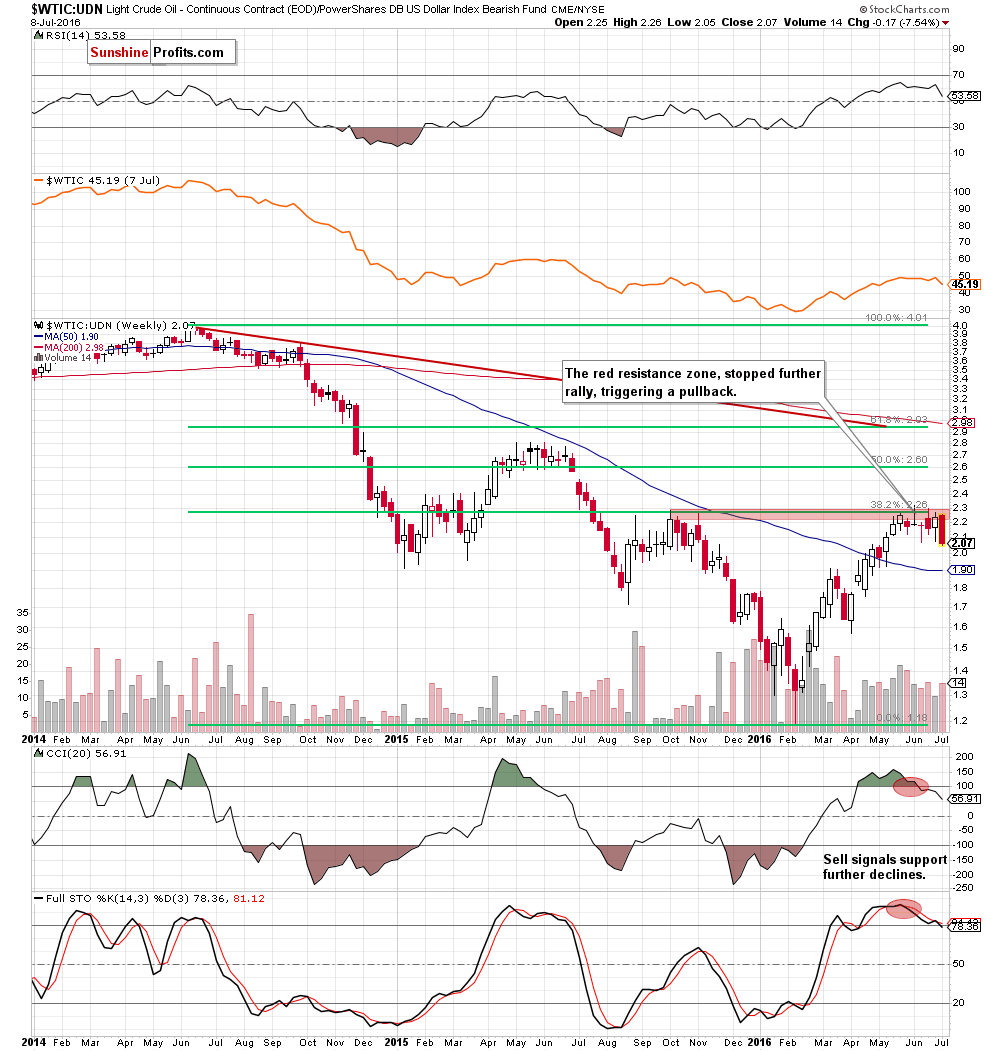
Looking at the weekly chart, we see that the red resistance zone (created by the Oct and Nov highs and the 38.2% Fibonacci retracement based on the entire Jun 2014-Feb 2016 downward move) stopped oil bulls and triggered a pullback in recent days. Taking this fact into account and the current position of the indicators (the CCI and Stochastic Oscillator generated sell signals), we think that further deterioration (and at least a test of the 50-week moving average) is just a matter of time. If this is the case, and the ratio extends declines from here, well also see lower prices of crude oil in the following week(s).
How did this drop affect the very short-term picture? Let’s check.
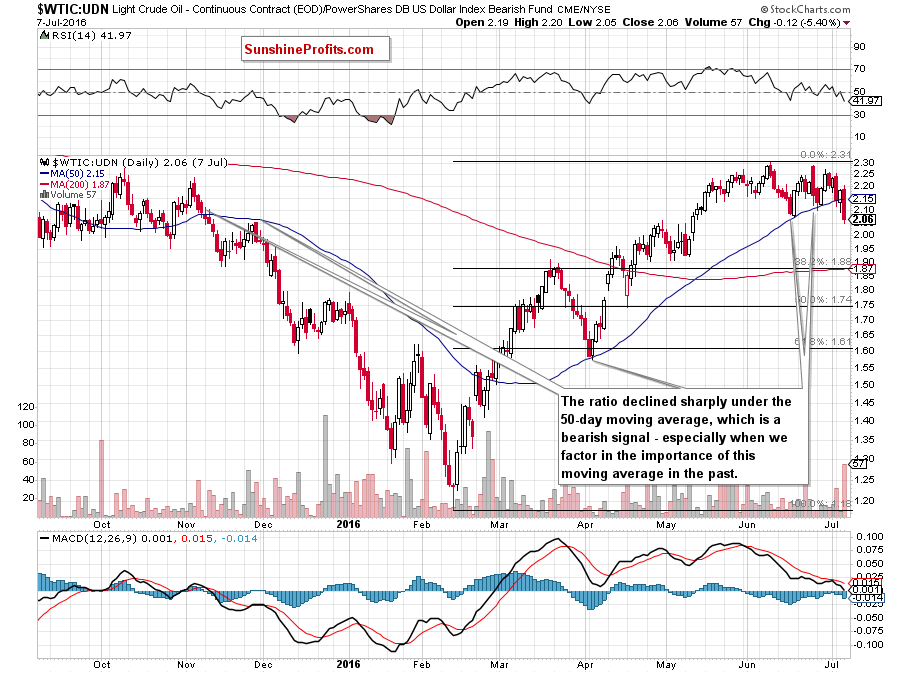
On the daily chart, we see that yesterday’s sharp decline took the ratio under the 50-day moving average, which is a strong negative signal when we take into account the importance of this moving average. As you see on the chart, two ties in the previous month, this support was strong enough to stop further declines. We also saw similar price action in Apr, which means that oil bulls lost an important ally. On top of that, Thursday’s decline materialized on huge volume, which confirms oil bears’ strength, supporting the pro bearish scenario.
Scenarios
Just like a month ago, today’s Oil Investment Update includes scenarios of what could happen in the coming weeks. Naturally, we will continue to monitor the market in the coming days and if anything invalidates our long-term outlook we will send you an additional message.
- Bullish scenario
If crude oil reverses and invalidates yesterday’s breakdown under the green zone, we’ll see further improvement and a comeback to the blue and black resistance lines (currently around $49.30). If oil bulls manage to push the commodity above them, the next upside target would be the Jun high of $51.67. If it is broken, crude oil could increase even to around $60-$62.58, where the 38.2% Fibonacci retracement (based on the entire 2011-2016 downward move), May and Jun 2015 highs are. - Bearish scenario
If the commodity extends declines from current levels, the first downside target would be the green support zone around $42.50-$43. If it is broken, oil bears may push light crude to the 200-day moving average (currently at $41.12) or even to the next support area created by the Apr low of $39 and the barrier of $40.
Summary
In the recent few weeks oil bulls and bears fought battles between the barrier of $50 and the green support zone based on the Apr and early May highs. After several unsuccessful attempts to move higher oil bears took control and crude oil closed yesterday’s session under its first important support zone. Thanks to yesterday’s drop, the oil-to-oil stocks ratio declined under both medium-term key support lines, invalidating earlier breakout. Similar invalidations of earlier breakouts we also noticed in the oil-to-gold and oil-to silver ratios. Additionally, crude oil priced in “other currencies” declined under its key support – the 50-day moving average, which stopped oil bears several times in the past. Taking all the above events into account and combining it with sell signals generated by almost all indicators, we think that the commodity will extend declines and we’ll see a realization of the bearish scenario in the coming week(s).
Very short-term outlook: bearish
Short-term outlook: bearish
MT outlook: bearish
LT outlook: mixed with bearish bias
Trading position (short-term; our opinion): Short positions (with a stop-loss order at $54.21 and initial downside target at $43.37) are justified from the risk/reward perspective.
This completes this month’s Oil Investment Update. Our next Oil Investment Update is scheduled for Friday, Aug 5, 2016. Oil Trading Alerts subscribers will additionally receive similar but shorter alerts on a daily basis (or more than once a day when the situation requires it). You – Oil Investment Updates subscribers – will receive short Investment Alert messages should the outlook for the medium or long term change before the next Update is posted.
Thank you.
Nadia Simmons
Forex & Oil Trading Strategist
Oil Investment Updates
Oil Trading Alerts

