

In recent weeks crude oil came back below the barrier of $50, which triggered declines and resulted in a drop to almost six-month lows. Such price action was mainly caused by increasing U.S. shale production, which climbed to the levels not seen since late April 2015. At this point, it is worth noting that U.S. output has risen by more than 10 percent since mid-2016 to 9.3 million barrels per day in 2017. These circumstances raised concerns over the OPEC’s ability to rebalance the market and pushed the price of the black gold lower.
Nevertheless, earlier this week, Saudi Energy Minister Khalid al-Falih and Russian energy Minister Alexander Novak renewed hopes for the oil market rebalancing, supporting the idea of extending the supply-cut agreement into 2018 (as a reminder, OPEC is expected to decide on May 25 whether to extend the current deal to cut production to the end of the year). Additionally, yesterday, the Energy Information Administration reported that crude oil inventories dropped by 5.25 million barrels, beating expectations of a draw of 1.79 million barrels. On top of that, distillate stockpiles declined by 1.6 million barrels, beating forecasts of a 1 million decline. Thanks to these bullish numbers, light crude bounced off the lower border of the declining trend channel and increased to the first resistance line. Will it manage to stop oil bulls in the coming days? Let’s jump right into the charts (charts courtesy of http://stockcharts.com) and try to find an answer to this important question.
Crude Oil
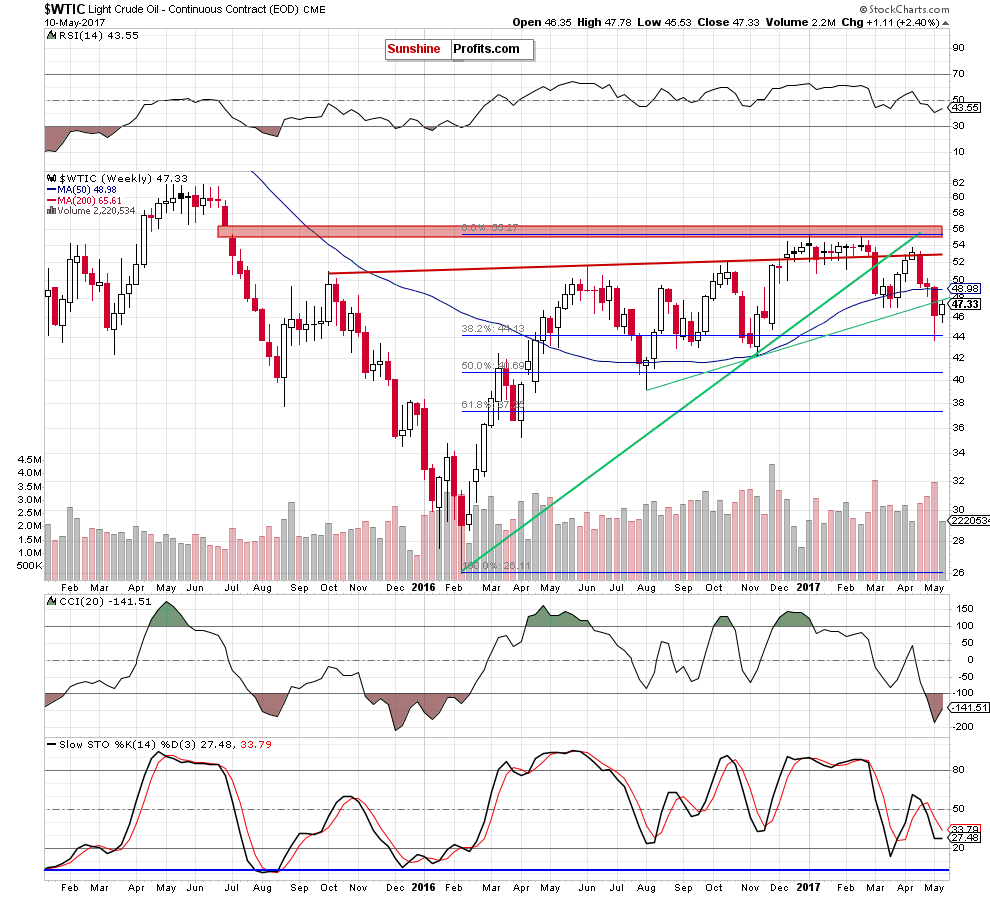
Looking at the weekly chart, we see that crude oil broke below the green line based on the August and November lows, which triggered an acceleration of declines. As a result, light crude slipped slightly below the 38.2% Fibonacci retracement based on the entire February-January upward move, but then reversed and rebound.
How did this price action affect the very short-term picture of the commodity? Let’s examine the daily chart and find out.
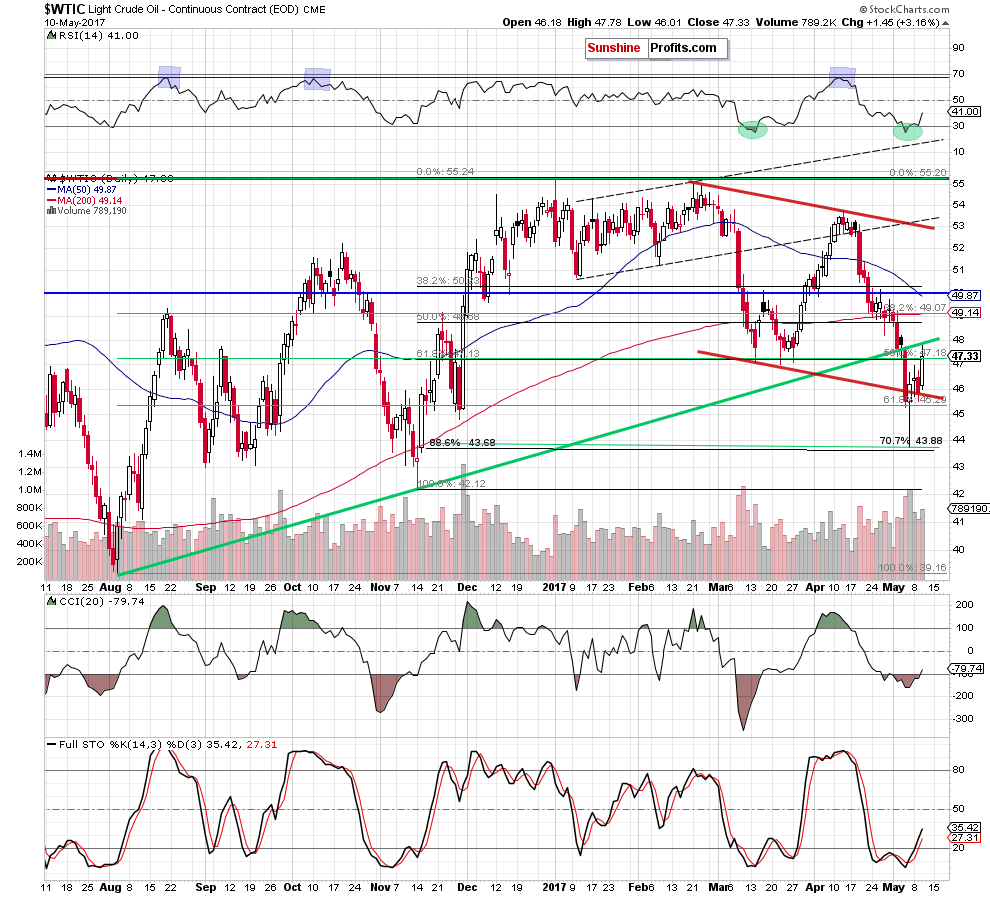
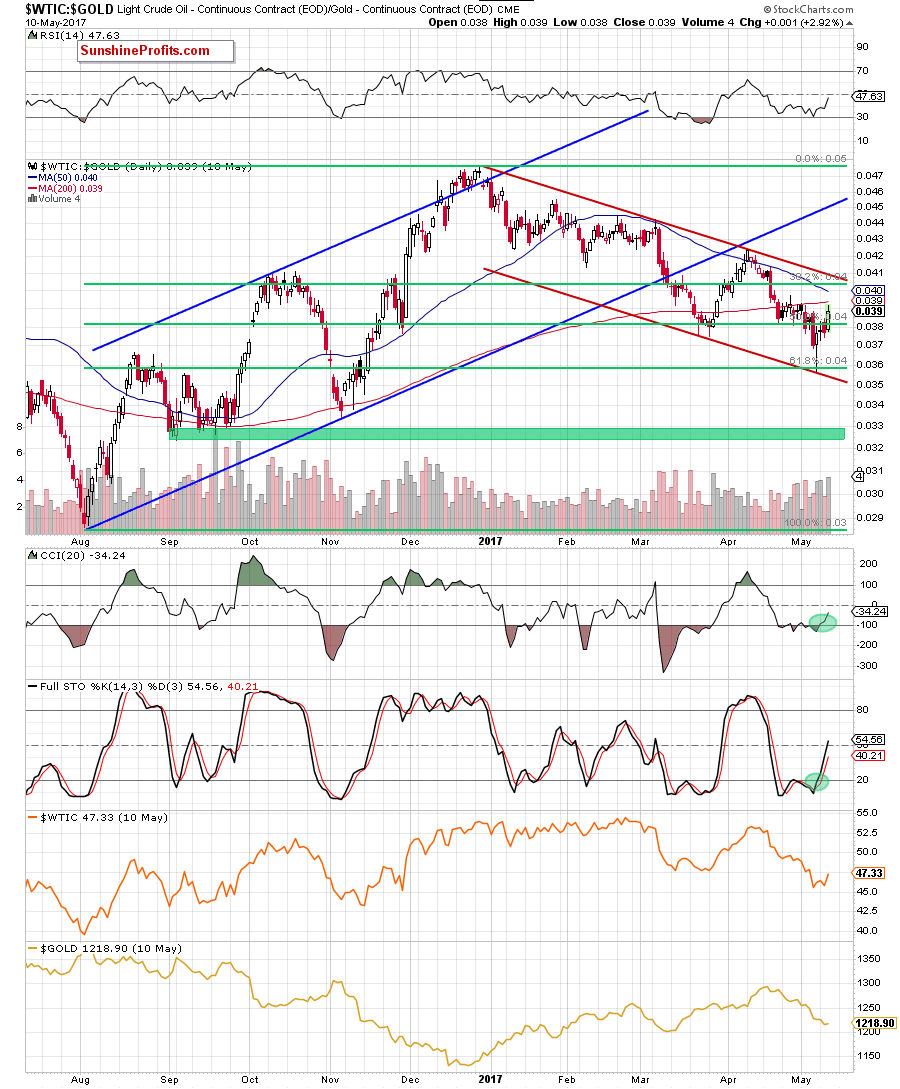
Looking at the daily chart, we see that although crude oil moved lower and dropped under the lower border of the red declining trend channel, the combination of the 70.7% retracement based on the August-January upward move and the 88.6% retracement based on the November-January increases (and reinforced y the 38.2% retracement seen on the weekly chart) encouraged oil bulls to act. As a result, light crude rebounded and invalidated the earlier breakdown, which was a bullish development.
On Tuesday, crude oil verified the earlier breakout above the lower red line, which together with the buy signals generated by the Stochastic Oscillator and the RSI triggered a sharp increase. Thanks to yesterday’s move, crude oil bounced off the previously-broken lower border of the red declining trend channel and climbed to the long-term green line based on the August and November lows.
What’s next? On one hand, the buy signals generated by the indicators together with the size of volume, which accompanied yesterday’s increase, suggest further improvement in the coming days. However, on the other hand, Wednesday’s move looks like a verification of the breakdown under the long-term green line, which could encourage oil bears to act and result in a comeback to the previously-broken lower border of the red declining trend channel.
All the above make the very short-term picture a bit unclear and suggest that waiting at the sidelines for another profitable opportunity is justified from the risk/reward perspective at the moment.
Is it possible that the current situation in our interesting ratios give us more clues about crude oil future moves? Let’s take a closer look at them and find out.
Ratio Analysis
A month ago, we wrote the following:
(…) although the ratio reversed and rebound, invalidating the earlier breakdown under the 50-week moving average, the key red resistance zone and the blue dashed line based on the previous highs continue to keep gains in check. This suggests that even if the ratio moves a bit higher from current levels, the space for gains seems limited. Why? As you see, in all previous cases, this major resistance zone was strong enough to stop upward moves, which increases the probability that we’ll see a similar price action in the coming week(s).
From today’s point of view, we see that the situation developed in line with the above scenario and the ratio declined in the previous weeks. Thanks to this drop the ratio slipped to the green support line based on the previous lows, which triggered a rebound.
What impact did this move have on the very short-term chart? Let’s take a closer look at the daily chart and find out.
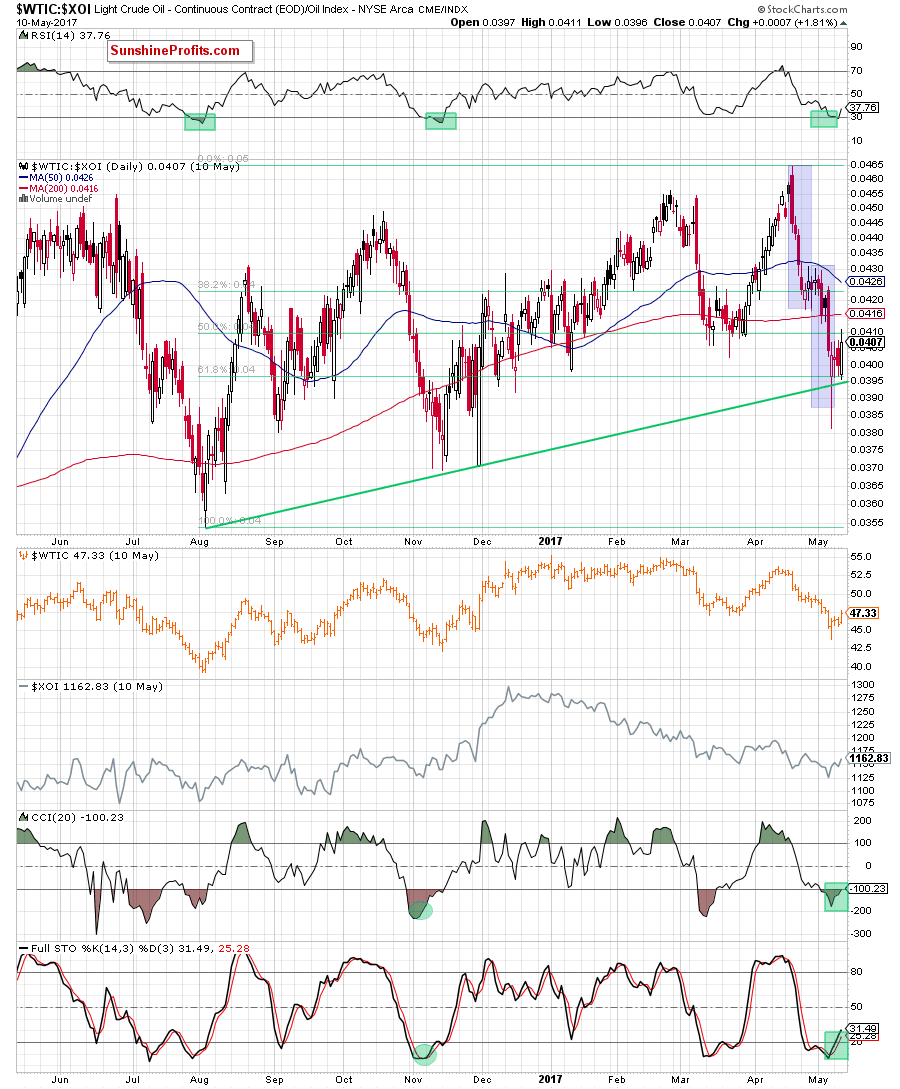
From this perspective, we see that the recent upward move took the ratio not only above the green support line based on the previous lows, but also above the previously-broken 61.8% Fibonacci retracement based on the April-May declines. In this way, the ratio invalidated earlier breakdowns, which is a bullish development, which suggests further improvement in the coming days – especially when we factor in the buy signals generated by all daily indicators. If this is the case and we see higher values of the ratio, the initial upside target will be around 0.043, where the late April and early May highs are. Such price action, will also likely translate into higher prices of crude oil as strong positive correlation between the ratio and the commodity remains in play.
Will the relationship between crude oil and gold give oil bulls another reason to act? Let’s check the charts below and find out.
On the daily chart, we see that the ratio bounced off the strong support area created by the lower border of the red declining trend channel and the 61.8% Fibonacci retracement in the previous week. As a result, the ratio approached to the previously-broken 200-day moving average, which could pause further improvement or even trigger a small pullback in very near future. Nevertheless, even if we see such price action, it should be temporary, because yesterday’s increase materialized on significant volume, which confirms oil bulls’ strength. Additionally, all indicators generated buy signals, supporting oil bulls and suggesting higher values of the ratio in the coming days. If this is the case and the ratio extends increases from here, will also see higher prices of light crude, because the positive correlation between the ratio and the black gold is still in cards.
Will the medium-term chart confirm this scenario? Let’s zoom out our picture and find out.
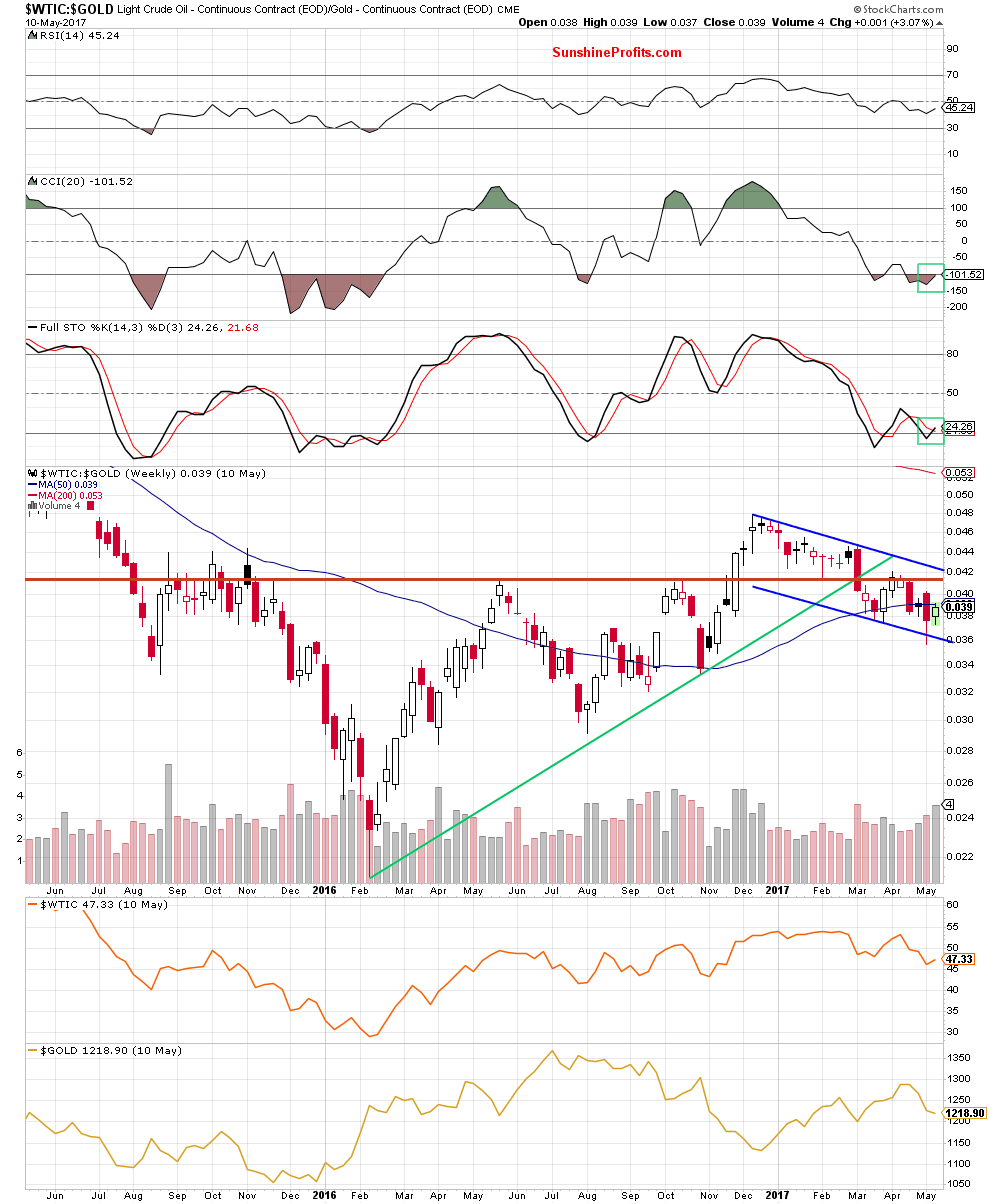
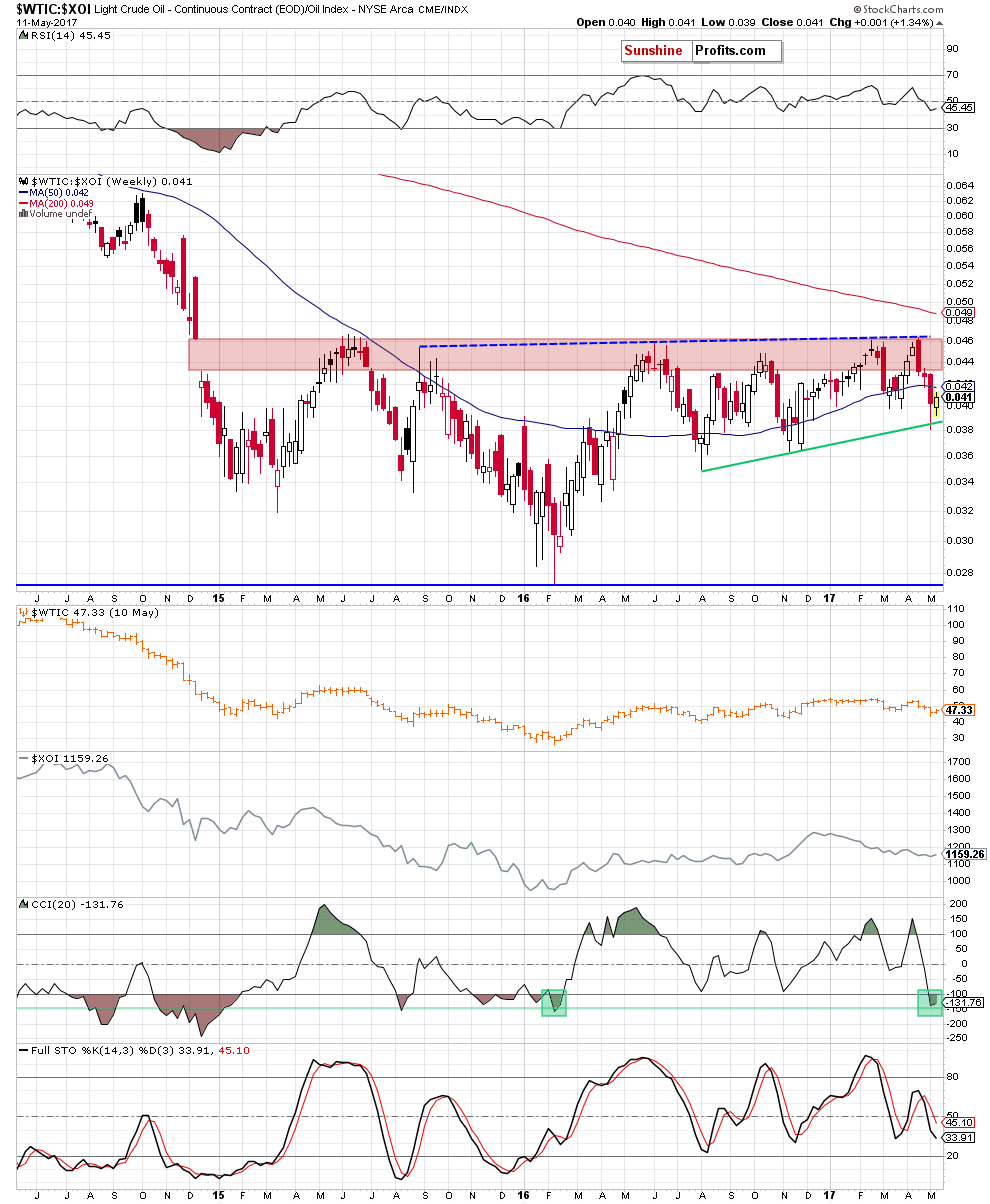
From the weekly perspective, we also see that the ratio invalidated the tiny breakdown under the lower border of the blue declining trend channel, which together with the current position of the weekly indicators (the Stochastic Oscillator generated the buy signal, while the CCI is very close to doing the same) suggest a test of the red horizontal resistance line or even the upper border of the trend channel in the following weeks.
Having said that, let’s take a closer look at the relationship between crude oil and the general stock market.
Quoting our last Oil Investment Update
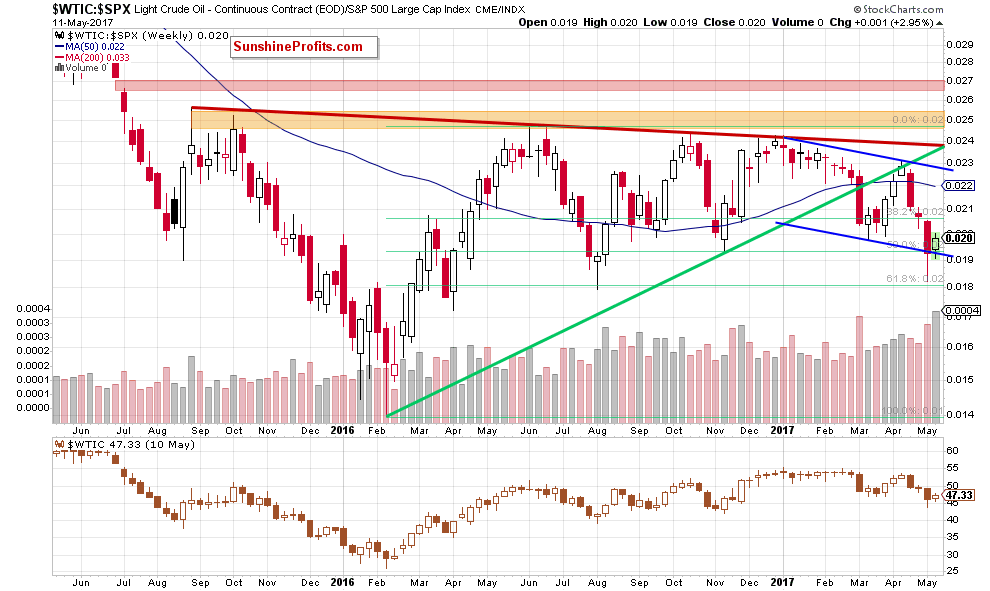
(…) despite the last week’s increase, the ratio is still trading under the previously-broken long-term green line based on the February and November lows and the 50-week moving average, which (…) suggests that (…) another move to the downside is likely (even if the ratio increases a bit and verifies the earlier breakdowns.
From today’s point of view, we see that the situation developed in tune with the above scenario as the ratio reversed and declined in the previous weeks. Thanks to this move, the ratio slipped slightly below the lower border of the blue declining trend channel, but the combination of the 61.8% Fibonacci retracement and the August low was strong enough to stop further deterioration and encourage bulls to act. As a result, the ratio rebounded, invalidating the earlier breakdown under the blue line, which is a bullish improvement.
What’s interesting, on the daily chart below, we can notice one more pro bullish factor.
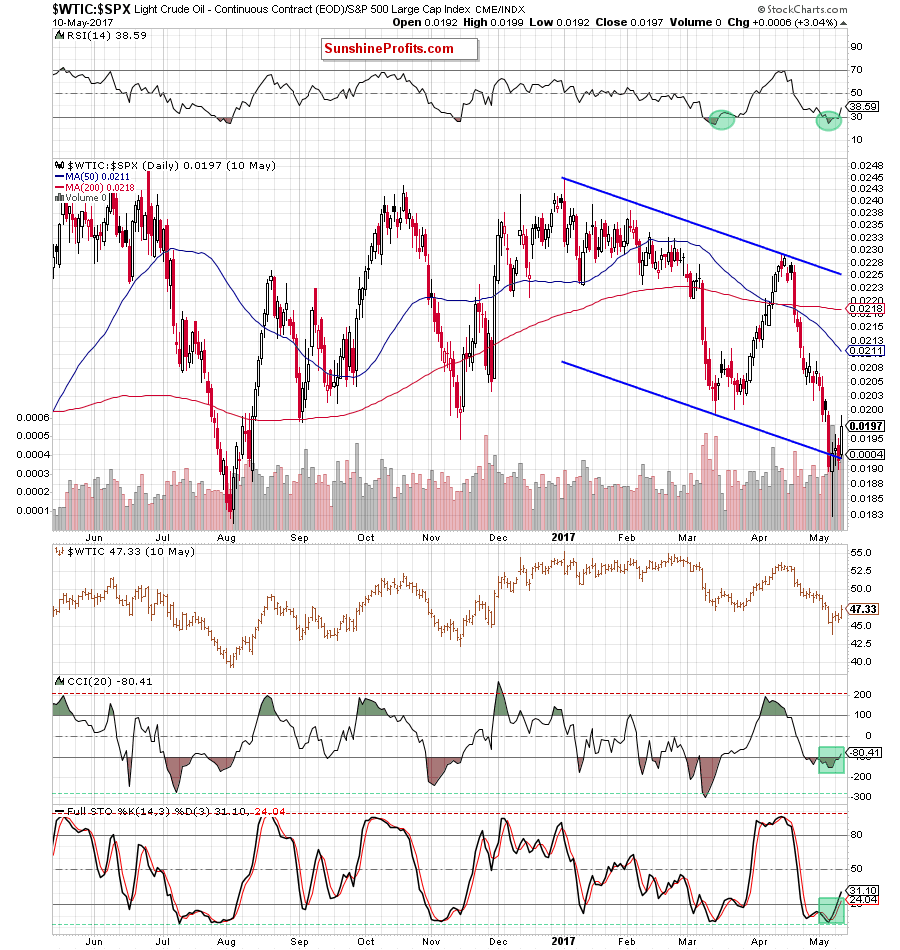
From this perspective, we see that all daily indicators generated buy signals, supporting further improvement in the ratio (and also in crude oil) in the coming days.
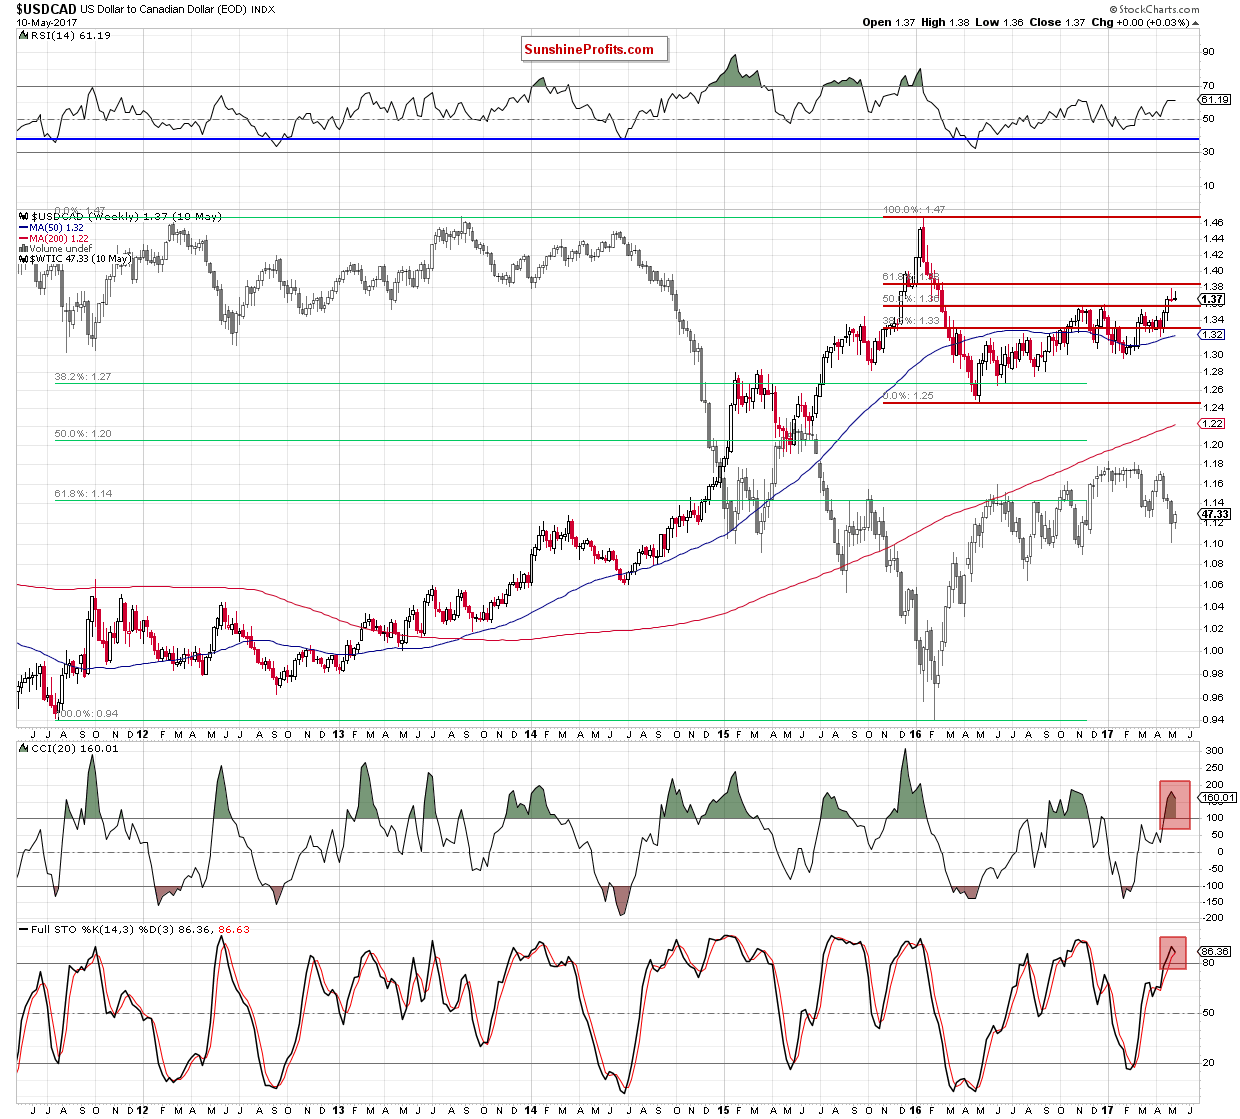
Before we move to the current situation in oil stocks, let’s take a closer look at the technical picture of USD/CAD. Why? As you see on the chart below, the negative correlation between crude oil and the exchange rate came back to the market, which could give us more clues about light crude future moves.
Let’s start today’s analyze from the very short-term perspective.
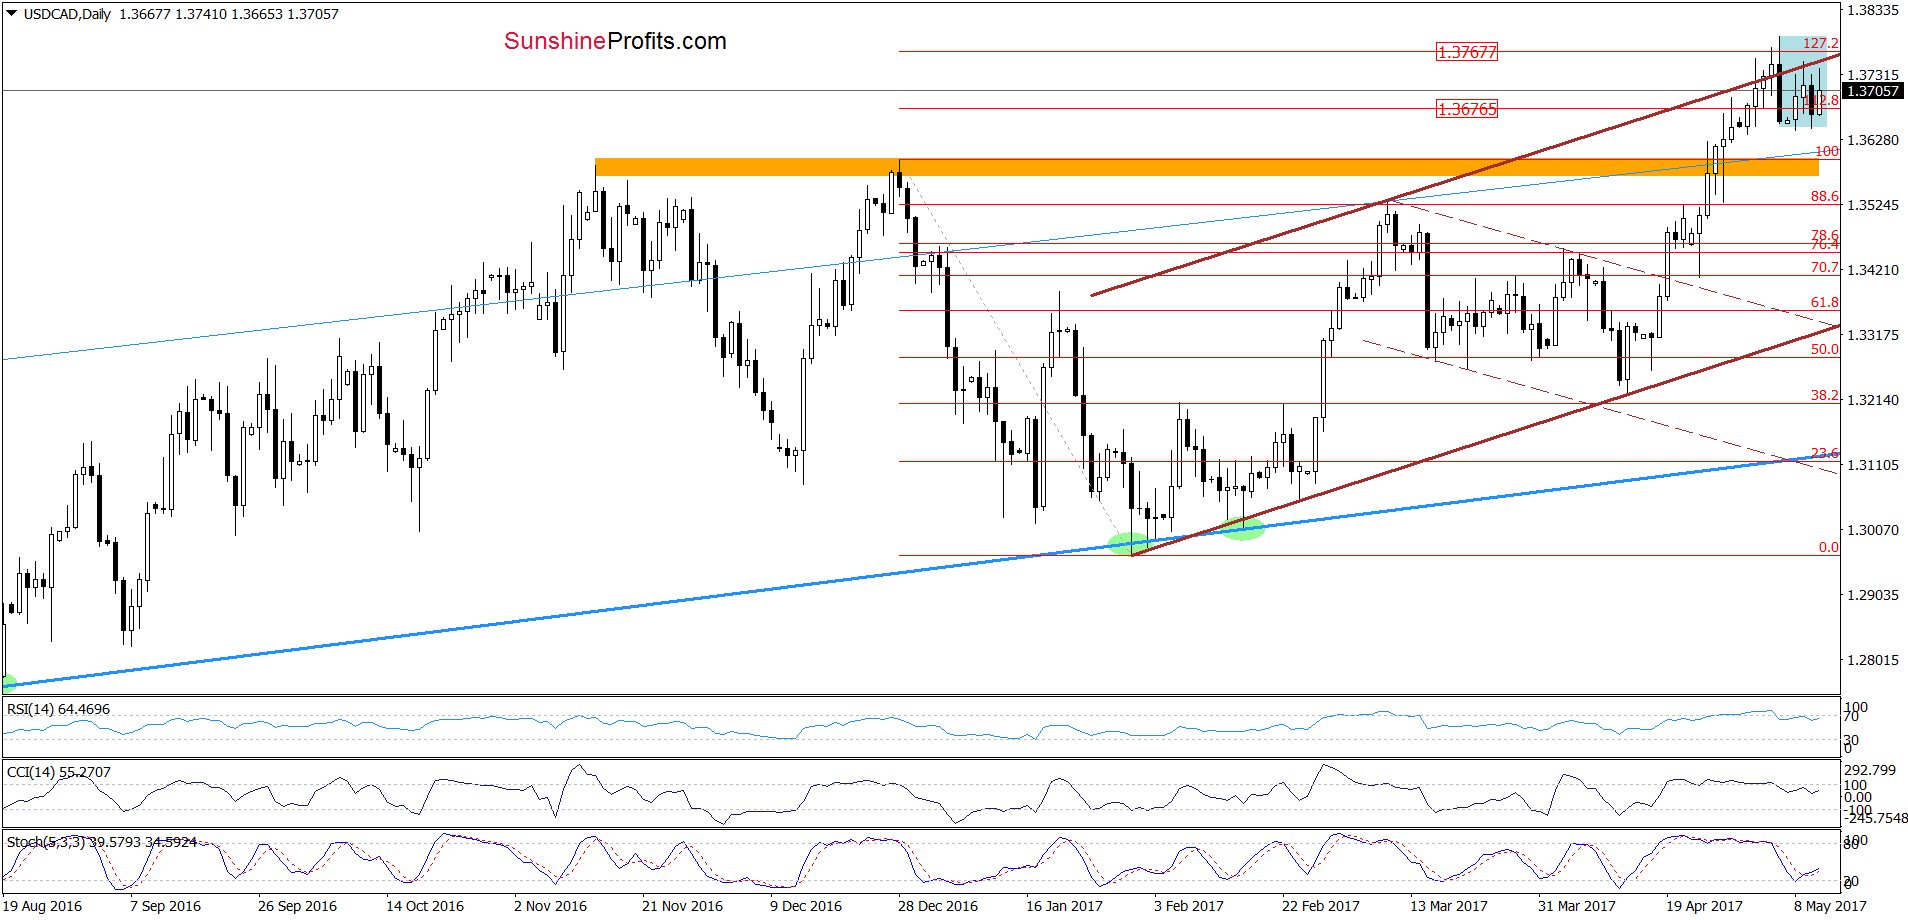
On the daily chart, we see that although USD/CAD moved higher earlier today, the upper border of the brown rising tend channel continues to keep gains in check. Additionally, the pair remains in the blue consolidation, which means that as long as there is no breakout above the upper line of the formation or a breakdown under the lower border another bigger move to the upside/downside is not likely to be seen and short-lived moves in both directions should not surprise us.
Nevertheless, the long- and medium-term charts suggest that the space for gains is limited and lower values of the exchange rate are just around the corner.
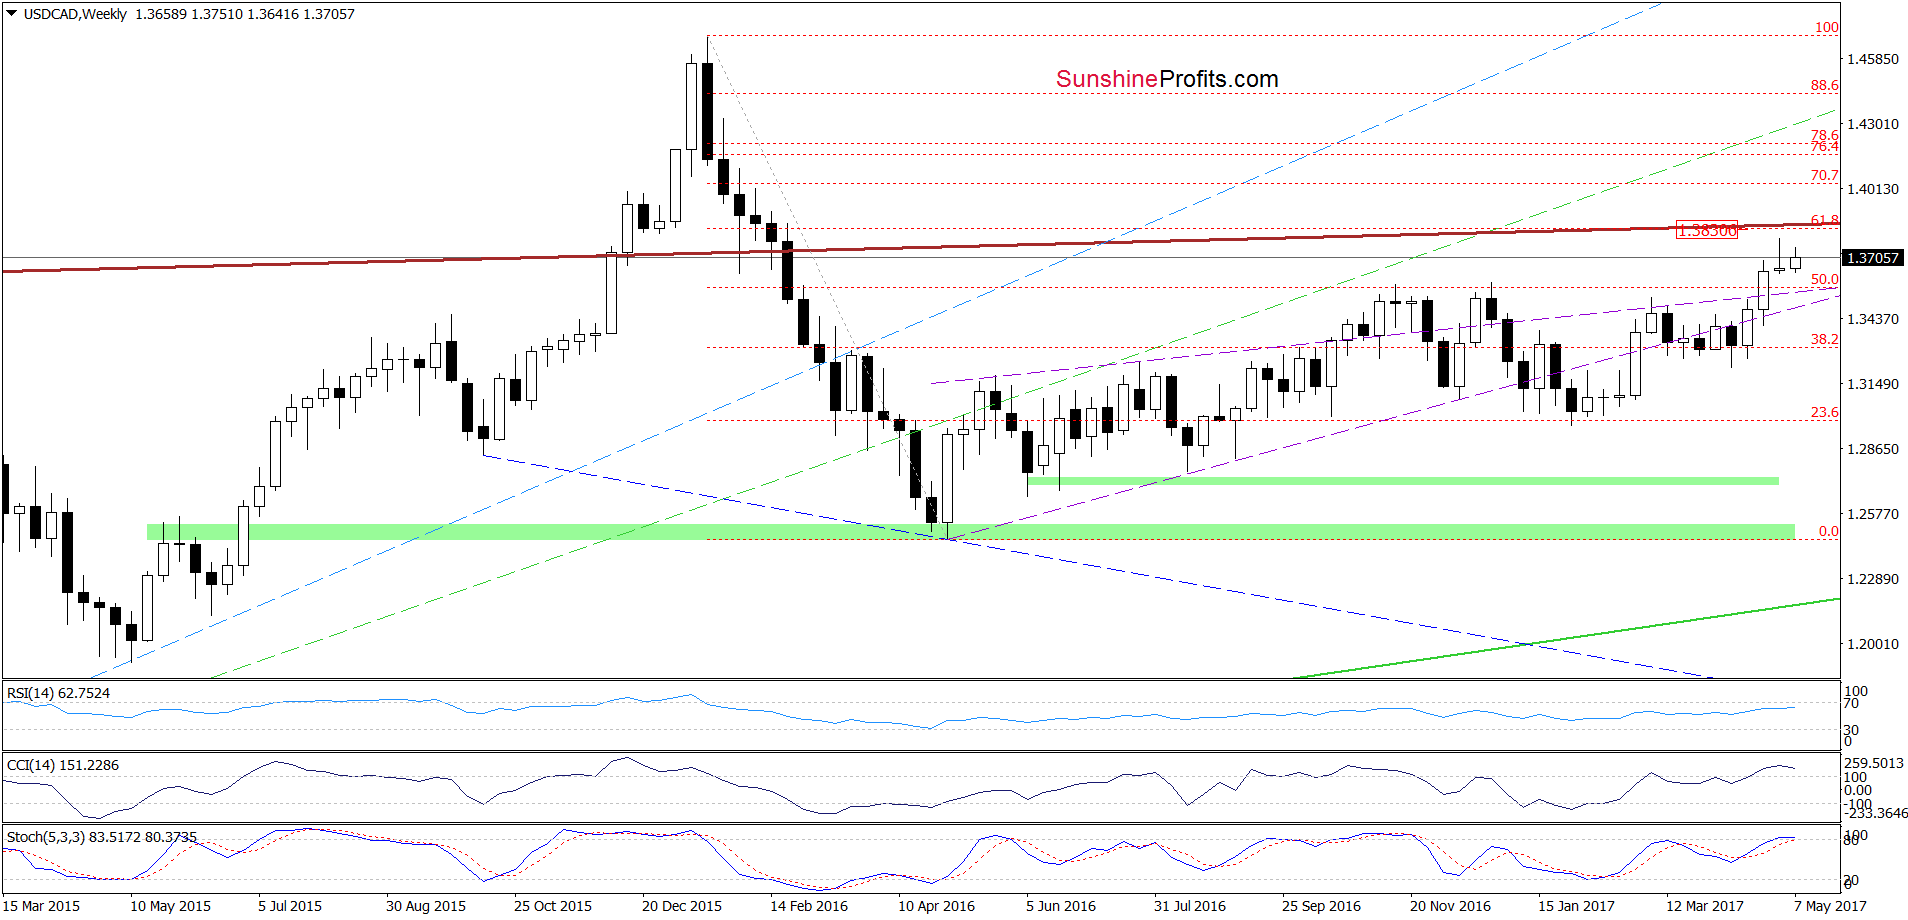
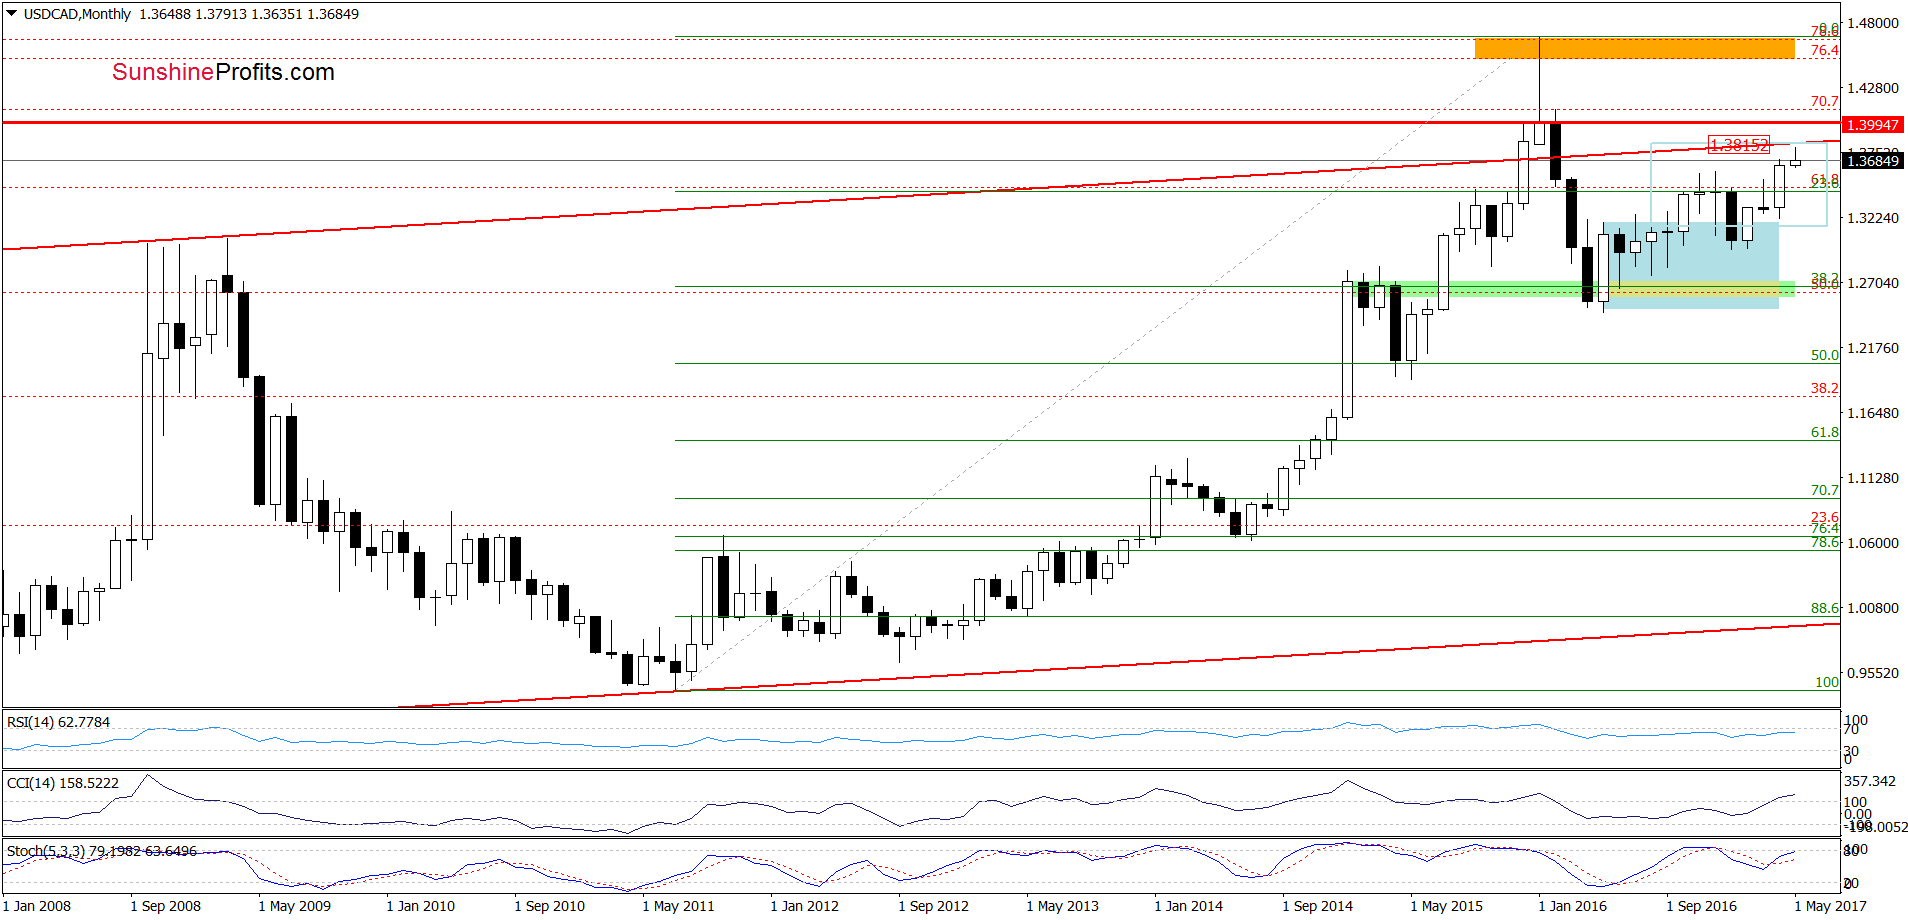
On the monthly chart, we see that USD/CAD approached the 61.8% Fibonacci retracement, which together with the proximity to the upper border of the red rising trend channel marked on the weekly chart below increase the probability of reversal in the coming week.
If this is the case and USD/CAD reverses and declines, we’ll likely see a move to the upside in the case of crude oil.
Finishing this month’s Oil Investment Update let’s examine the NYSE Arca Oil Index (XOI) to find out what the current outlook for oil stocks is.
Oil Stocks
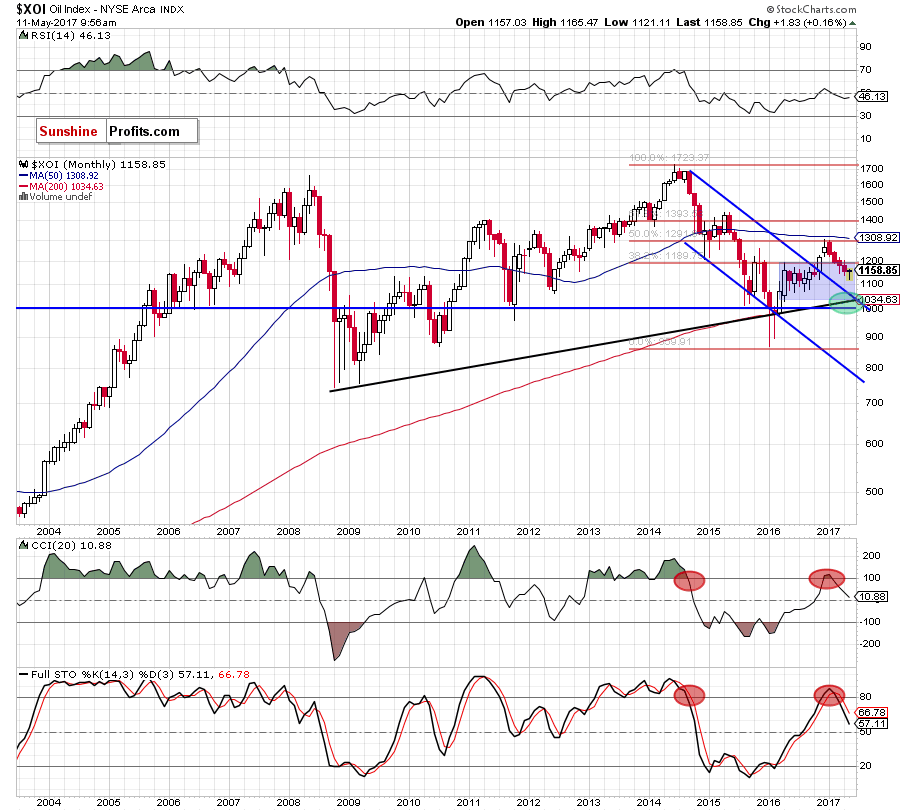
Looking at the long-term chart, we see that the overall situation hasn’t changed much as oil stocks are still trading slightly below the previously-broken upper border of the blue consolidation. Additionally, the sell signals generated by the CCI and the Stochastic Oscillator remain in place, suggesting another attempt to move lower.
But will we see such price action in the coming weeks? Let’s examine the medium-term chart and find out.
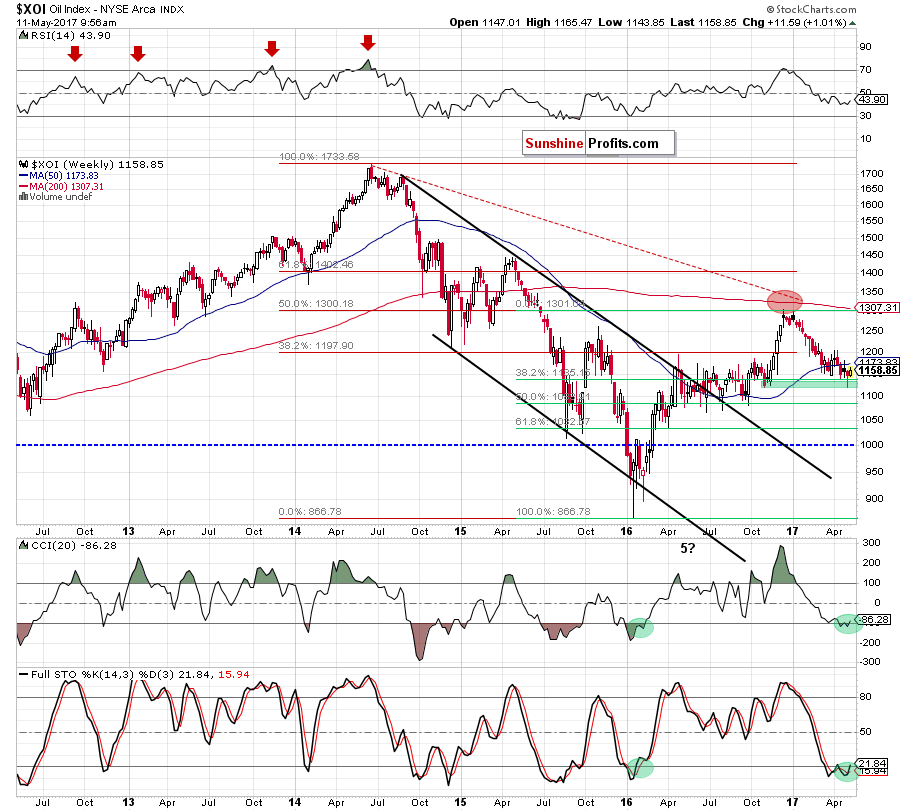
From this perspective, we see that the XOI moved a bit lower in the previous weeks, which resulted in a drop to the green support zone created by the October and November lows. As you see, this area triggered a rebound, which took oil stocks above the previously-broken 38.2% Fibonacci retracement. In this way, the index invalidated the earlier breakdown, which together with the current position of the indicators (the CCI and the Stochastic Oscillator generated buy signals) suggests further improvement in the coming weeks.
How high could oil stocks go? Let’s take a closer look at the daily chart.
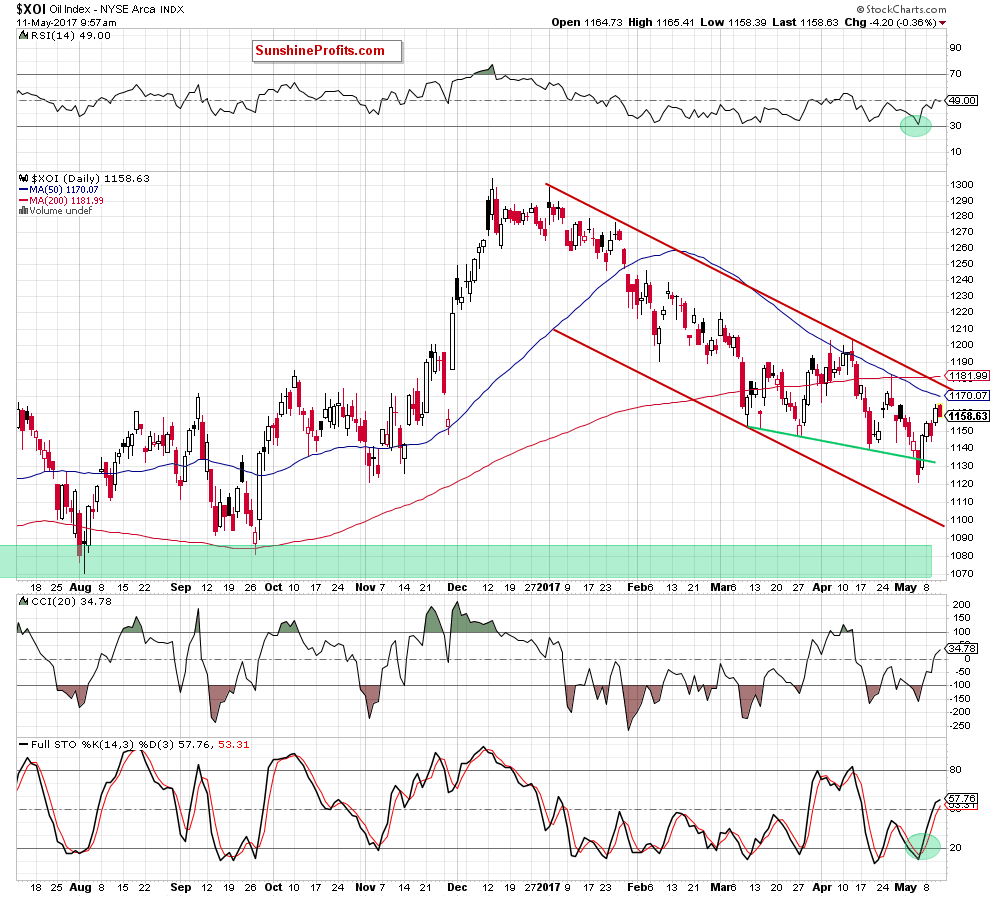
On the daily chart, we see that oil stocks rebounded in the previous week, invalidating the earlier small breakdown under the green support line based on the previous lows. Additionally, all indicators supported oil bulls generating buy signals. Taking all the above into account, we think that oil stocks will extend gains and the initial upside target will be around 1,176, where the upper border of the red declining trend channel currently is.
Summing up, the short-term outlook for oil stocks is currently bullish as the XOI invalidated the earlier breakdown under the green support line based on the previous lows. Additionally, oil stocks bounced off the green support zone (seen on the weekly chart), which together with the buy signals generated by the daily and weekly indicators suggest further improvement in the coming week(s).
Scenarios
Just like a month ago, today’s Oil Investment Update includes scenarios of what could happen in the coming weeks. Naturally, we will continue to monitor the market in the coming days and if anything invalidates our long-term outlook we will send you an additional message.
Bullish scenario
If crude oil breaks above the previously-broken long-term green line based on the August and November lows, we’ll see further improvement and an increase to around $50, where the psychologically important barrier and the 61.8% Fibonacci retracement (based on the entire April-May downward move) are. If this resistance area is broken, the next upside target will be around $53.30-$53.76, where the April highs are.
Bearish scenario
If the commodity drops under the lower border of the red declining trend channel, we’ll see a test of the recent lows and the 38.1% Fibonacci retracement seen on the weekly chart. If this support is broken, the next downside target for oil bears will be around $42.20-$43.06, where the September and mid-November lows are. What could happen if this area is broken? In our opinion, we’ll see a test of the barrier of $40.
Summary
In recent days crude oil bounced off the 38.2% Fibonacci retracement (seen on the weekly chart) and invalidated the earlier breakdown under the lower border of the red declining trend channel, which resulted in a sharp increase to the long-term green line. At the same time, we noticed similar price actions in all of the above-mentioned ratios, which increases the probability of further improvement – especially when we factor in the buy signals generated by the indicators (not only in the case of crude oil, but also in the case of our ratios). Nevertheless, in our opinion, such price action will be more likely and reliable if we see an invalidation of the breakdown under the long-term green line. Why? Because, yesterday’s increase looks like a verification of the earlier breakdown (at least at the first sight), which increases the probability of a pullback in the coming day(s). This scenario is also reinforced by the current situation in the oil-to-gold ratio. As a reminder, the ratio approached the previously-broken 200-day moving average, which could pause further improvement or even trigger a small pullback in very near future. If this is the case, we’ll likely see a re-test of the strength of the lower border of the red declining trend channel in the coming week. If it holds, the way to higher levels will be open (at least to the barrier of $50).
Very short-term outlook: mixed with bearish bias
Short-term outlook: mixed with bullish bias
MT outlook: mixed
LT outlook: mixed
This completes this month’s Oil Investment Update. Our next Oil Investment Update is scheduled for Monday, June 5, 2017. Oil Trading Alerts subscribers will additionally receive similar but shorter alerts on a daily basis (or more than once a day when the situation requires it). You – Oil Investment Updates subscribers – will receive short Investment Alert messages should the outlook for the medium or long term change before the next Update is posted.
Thank you.
Nadia Simmons
Forex & Oil Trading Strategist
Oil Investment Updates
Oil Trading Alerts

