

Without a doubt the most important event of the recent month (or even the recent years) was unexpected OPEC’s decision to limit its production to a range of 32.5-33.0 million barrels per day. The agreement reached in Algiers (which is expected to be implemented this year) improved oil investors’ sentiment and pushed the price of the commodity above the barrier of $50.
But is this event as positive as it look at the first sight? In our opinion, it is not. Why? Firstly, Iran and Libya have continued to increase production. Iran's crude oil and condensate sales have likely approached levels from 2011 (before western sanctions were imposed), while in Libya, Arabian Gulf Oil Company raised its production to 320,000 bpd, increasing the country's production above 500,000 bpd. Secondly, Iran signed a contract with a domestic company to upgrade two of its oil fields, which suggests that the country will strive to return to its pre-sanctions production level of 4 million bpd instead of restricting production. Thirdly, Iraq said over the weekend that it wants to raise output further in 2017, which increases worries over a cut deal.
Although Russian President Vladimir Putin said that his country was ready to join OPEC's proposal to cut oil production, recent data showed that OPEC's oil production reached the record highs in Sep, rising by 160K barrels to 33.6M bpd. On top of that, the Friday’s Baker Hughes report showed that U.S. oil rigs increased by 3 in the previous week. Although this number is not significant, it’s worth keeping in mind that since May 2016 shale producers have added 112 oil rigs in the U.S., which is an increase of 35%. They've lowered their costs (with crude oil at about $40 per barrel), which raises concerns that we will see further increase in the number of oil rigs and oil production, which, in broader perspective, affect negatively crude oil inventories.
In these circumstances, a cut in oil production is probably the only proper decision to preserve stability in the global energy market, however, taking into account the above-mentioned numbers, it is hard to assess how large cuts could balance the market. Is another big correction in the price of crude oil wait for us just around the corner? Let’s jump right into charts (charts courtesy of http://stockcharts.com) and try to find answers to this question.
Crude Oil
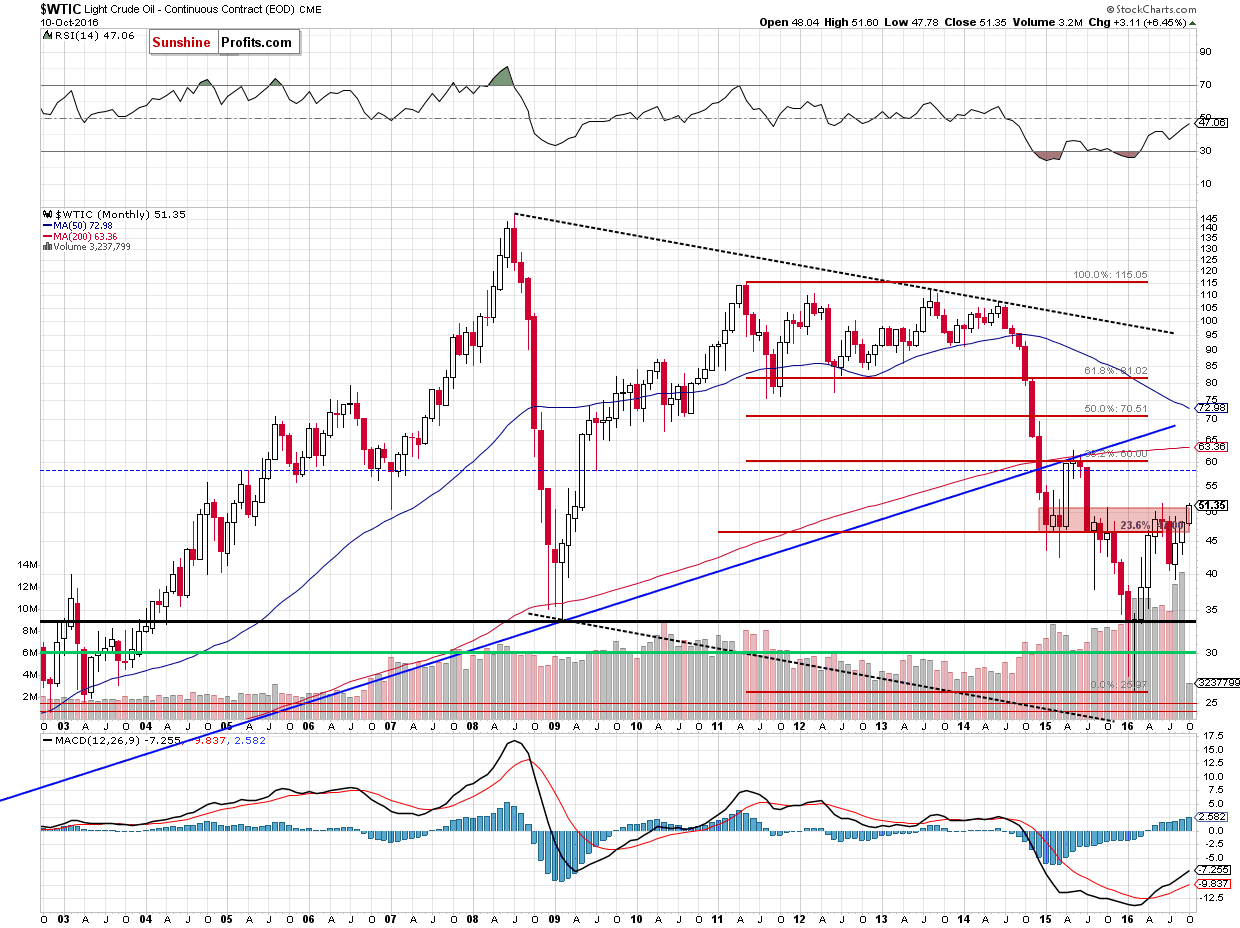
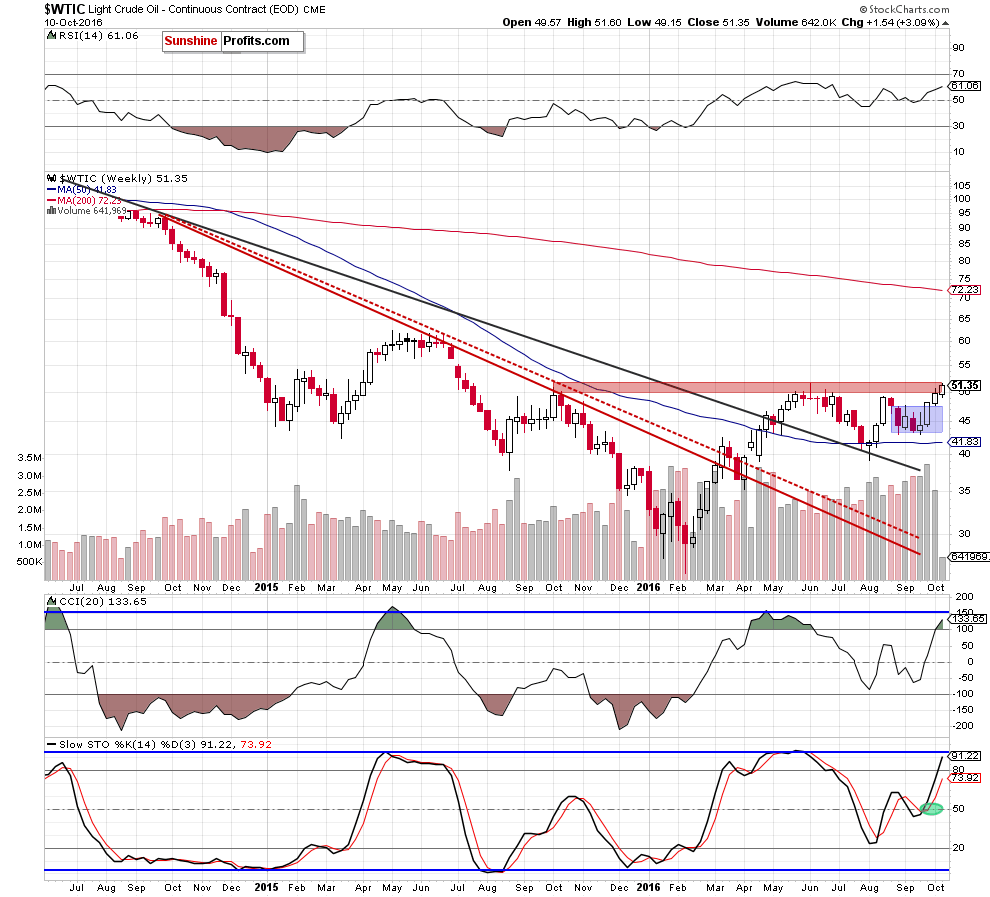
Looking at crude oil from the long- and medium-term perspective we see that although light crude moved higher since our previous Oil Investment Update was posted, the red resistance zone marked on both charts continues to keep gains in check. Additionally, when we focus on the weekly chart, we notice that the last week’s volume was much smaller compared to what we saw a week earlier, which suggests that oil bulls may run out of steam. If this is the case, a reversal and correction from current levels should not surprise us.
Are there any other technical factors that could encourage oil bears to action? Let’s examine the daily chart and find out.
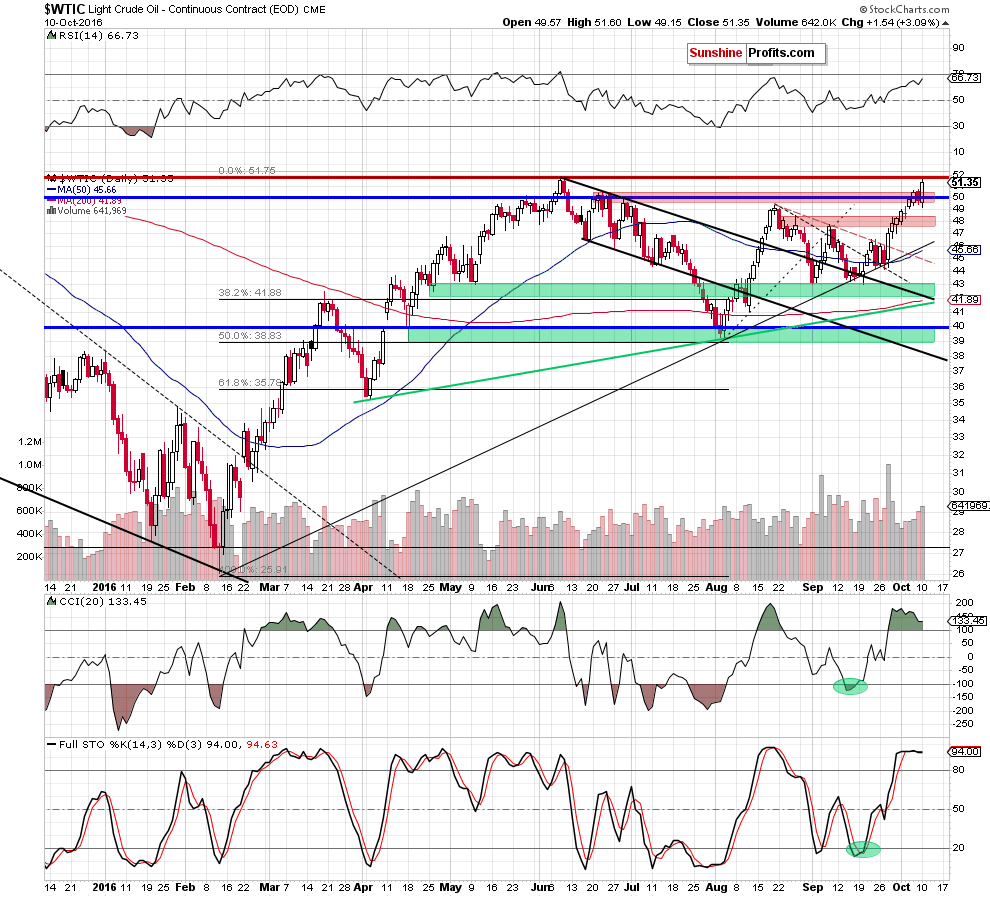
Looking at the daily chart, we see that although crude oil moved lower after yesterday’s markets open, oil bulls managed to stop their opponents, which resulted in a comeback above the barrier of $50. As you see, this positive event (an invalidation of a breakdown) triggered further improvement, which resulted in a rally to an intraday high of $51.60. In this way, the commodity almost touched the Jun high, which is also the upper border of the red key resistance zone marked on the weekly chart.
What’s next? We believe that as long as there won’t be a confirmed breakout above the Jun high a reversal and lower values of crude oil are very likely – especially when we factor in the fact that there are negative divergences (between the RSI CCI, Stochastic Oscillator and the price of the commodity) and a sell signal generated by the Stochastic Oscillator (not strong yet, but still).
If this is the case, and light crude corrects the recent rally, the initial downside target would be the barrier of $50. If it is broken, the next target would be around $47.75-$48.46, where the lower red zone (which serves now as support) is.
Summing up, crude oil extended gains and almost touched the upper border of the key resistance zone - the Jun high of $51.67. Although this is a positive signal, a sell signal generated by the Stochastic Oscillator in combination with negative divergences between other indicators and the price of the commodity suggests that the space for gains is limited and reversal is just around the corner.
Having discussed the situation in crude oil, let’s examine the NYSE Arca Oil Index (XOI) to find out what the current outlook for oil stocks is.
Oil Stocks
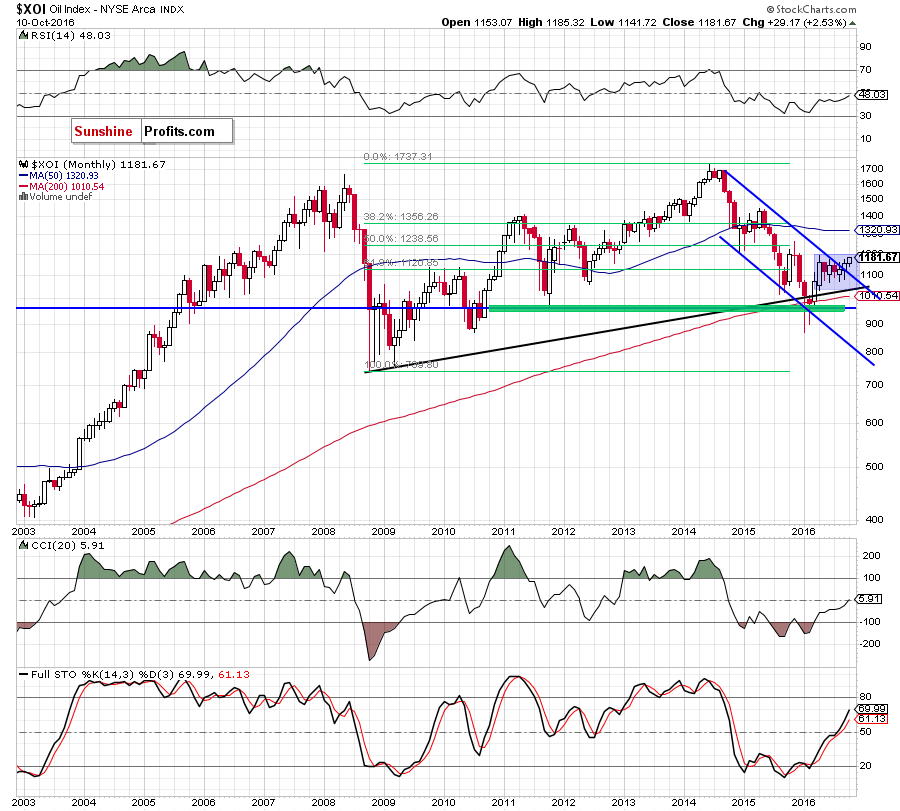
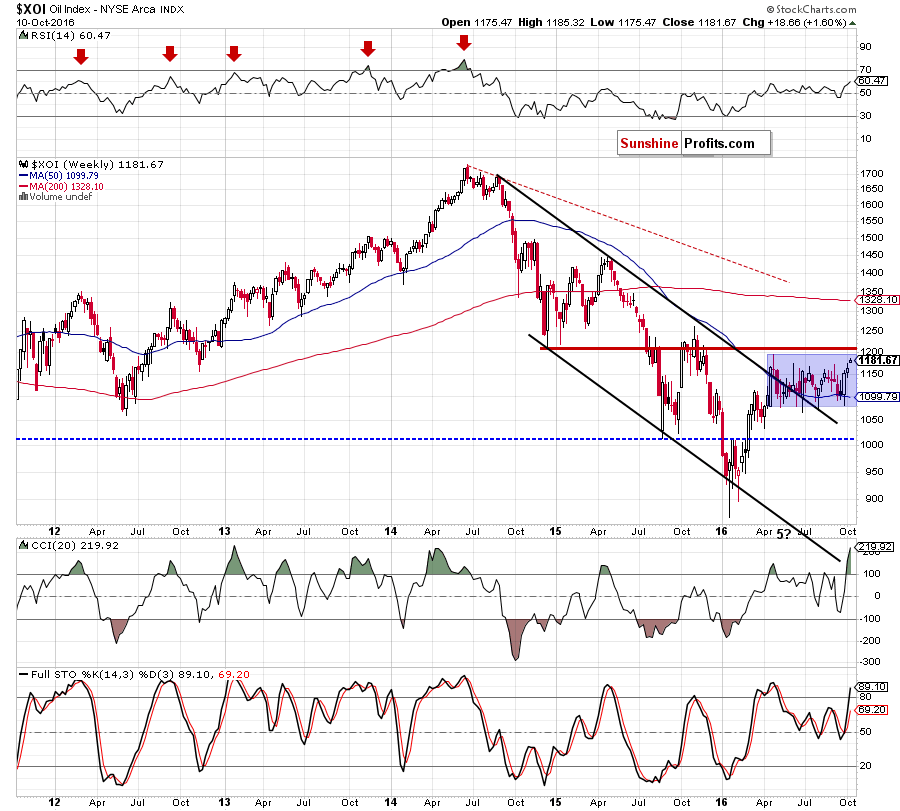
Looking at the XOI from the long- and medium-term perspective, we see that the overall situation hasn’t changed much as oil stocks are trading in a blue consolidation between the upper border of the black declining trend channel (seen on the weekly chart) and the Jun and Jul highs. This means that as long there won’t be a breakout above the upper line of the formation (or a breakdown under the lower border of consolidation) another bigger move is not likely to be seen.
Having said the above, let’s examine the daily chart.
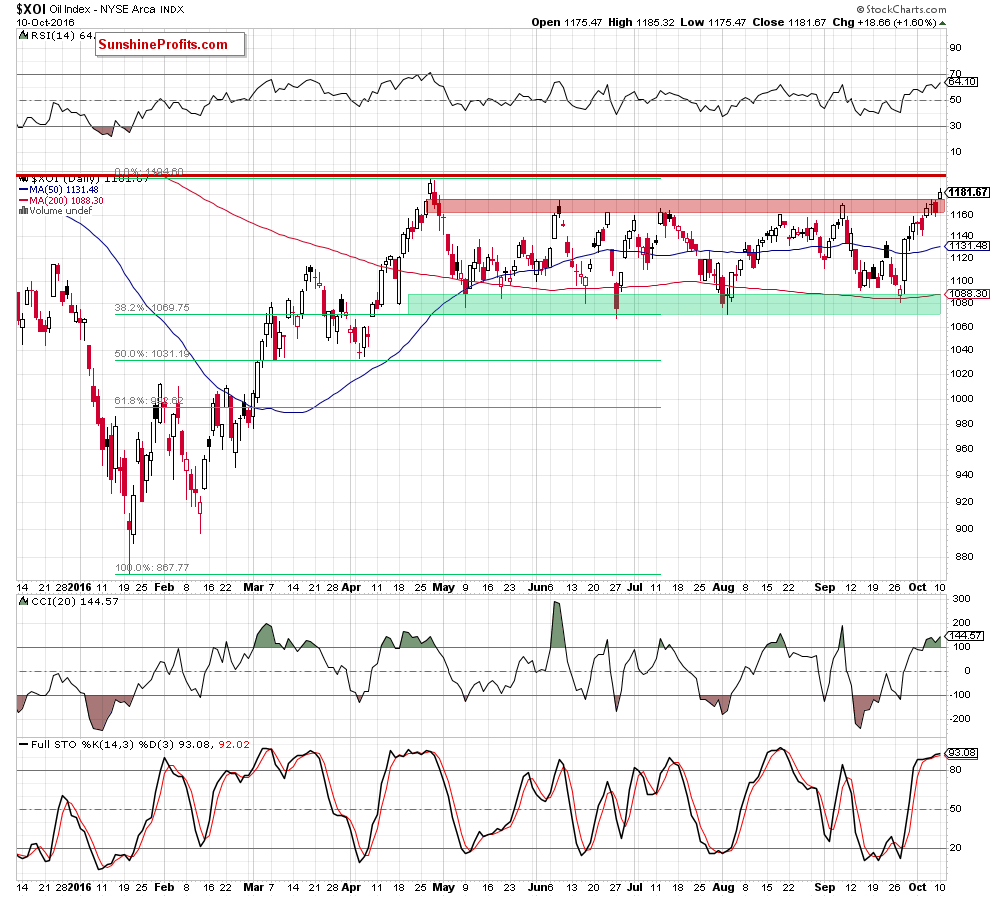
The first thing that catches the eye on the daily chart is a breakout above the upper border of the red resistance zone. Although this is a positive signal that suggests further improvement, we should keep in mind that slightly above the current levels there is another resistance zone based on the Apr highs. On top of that, when we focus on the position of the indicators, we see that the CCI and Stochastic Oscillator are overbought and very close to generating sell signals, which suggests that the space for gains is limited. If this is the case, oil stocks will reverse and invalidate yesterday’s breakout above the red zone. If we see such price action, it would be a bearish signal, which will likely accelerate further deterioration in the following days.
How low could the XOI go in the coming week(s)? In our opinion, the initial downside target would be around 1,133-1,135, where the 50-day moving average and the Sep 22 high are. If this area is broken, we may see another test of the green support zone, which is currently reinforced by the 200-day moving average and the 38.2% Fibonacci retracement.
Summing up, although oil stocks broke above the red resistance zone marked on the daily chart, they are still trading in the blue consolidation marked on the weekly chart. Therefore, in our opinion, as long there won’t be breakout above the upper line of the formation (or a breakdown under the green support zone seen on the daily chart) another bigger move is not likely to be seen. Nevertheless, the current position of the daily indicators suggests further deterioration in (at least) the coming days.
Ratio Analysis
Today, we start this section by focusing on the oil-to-oil stocks ratio. What can we infer from the chart below?
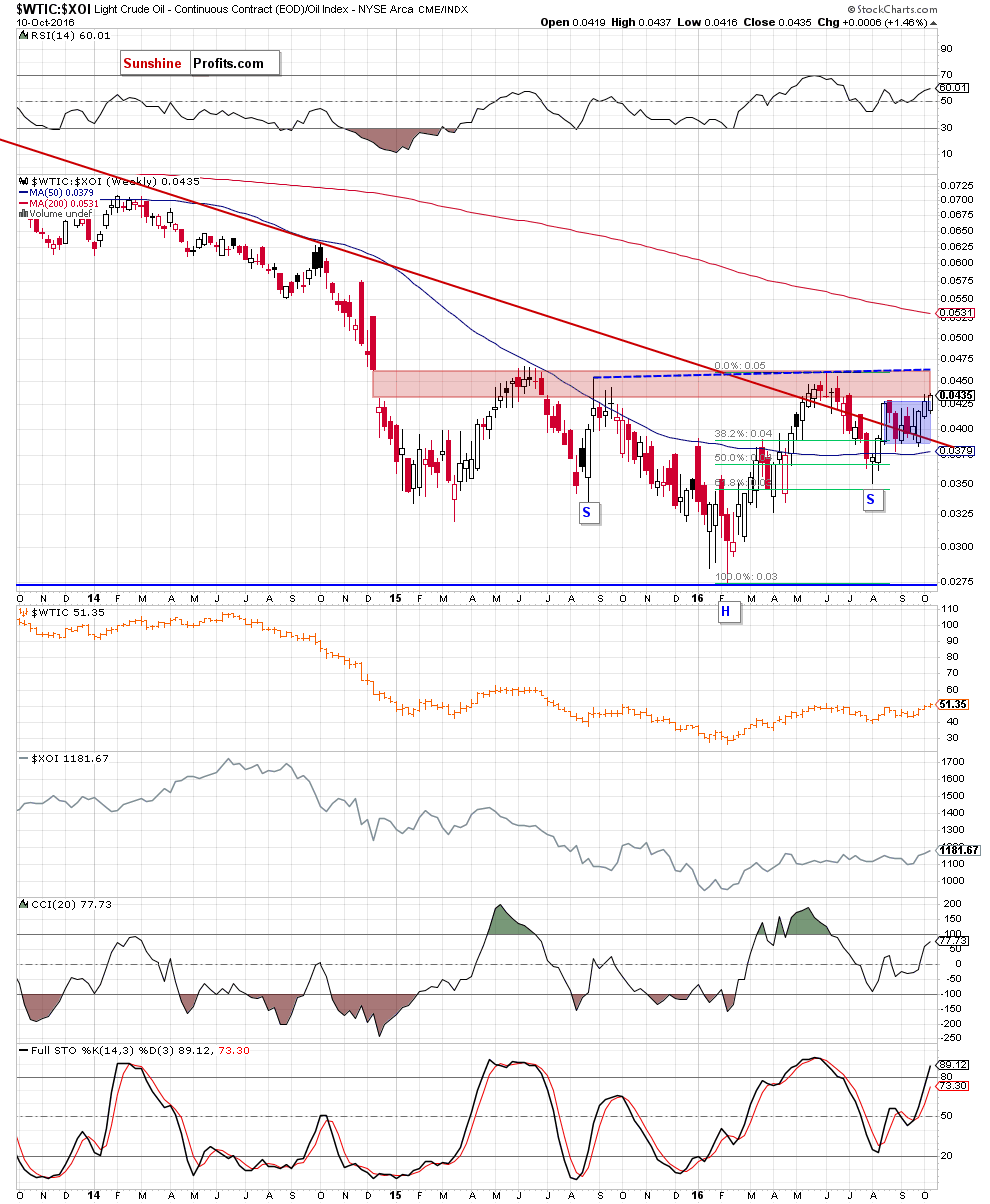
On the above chart, we see that although the ratio moved higher and broke above the upper border of the blue consolidation earlier this week, the key red resistance zone (based on the Dec 2014 gap) continues to keep gains in check. Therefore, we think that even if the ratio increases slightly from here, as long as there won’t be a breakout and a weekly closure above the upper border of the zone (which is currently reinforced by the neck line of a potential reverse head and shoulders formation) further rally is not likely to be seen and another reversal is very likely (not only in the case of ratio, but also in the case of crude oil as strong positive relationship remains in play).
Additionally, the ratio stopped in the red resistance zone based on the previous highs seen on the chart below.
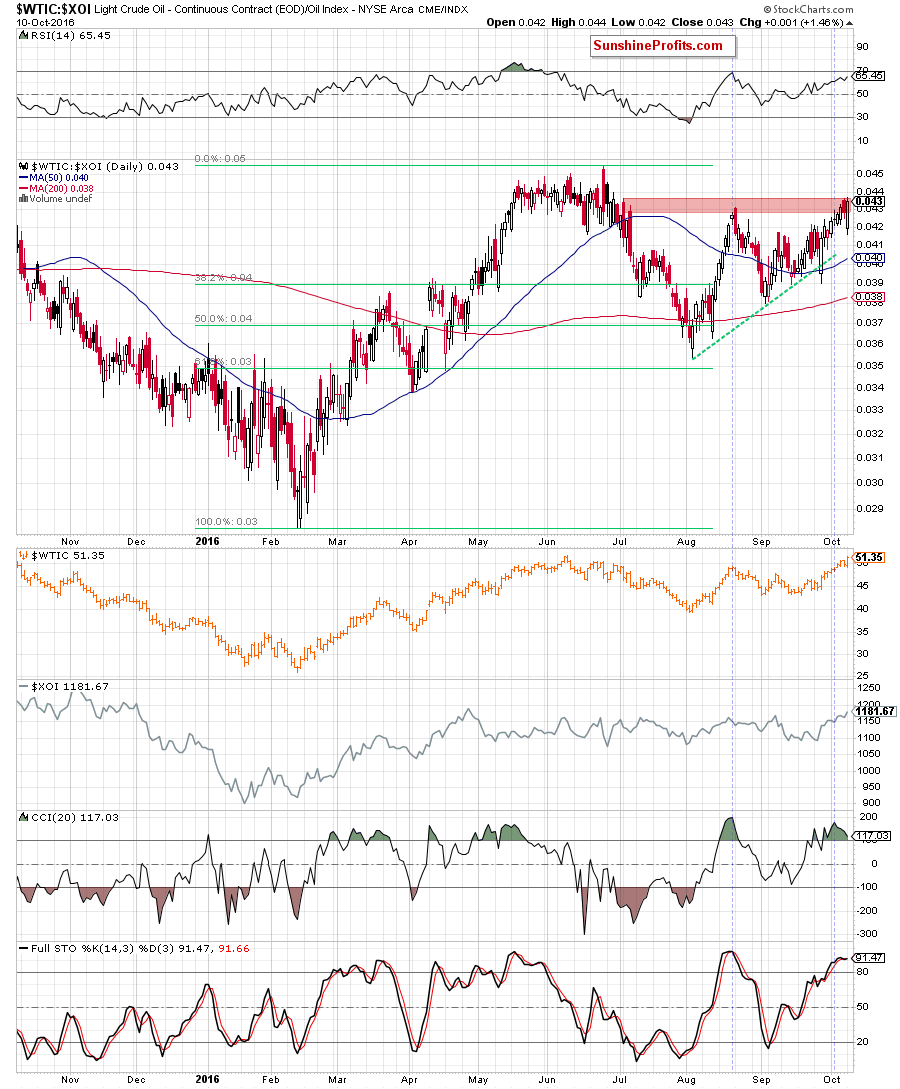
On top of that, there are negative divergences between indicators and the ratio and Stochastic Oscillator generated a sell signal, suggesting an attempt to move lower in the coming days. Taking all the above into account, we think that further improvement will be more likely only if the ratio closes at least one of the following weeks above the upper border of the red gap (since Dec 2014 oil bulls haven’t got enough power to do this). Until this time, another downswing (and even a comeback to the previously-broken long-term red declining support line) is very likely.
Will the oil-to-gold ratio confirm this bearish scenario? Let’s check the chart below and find out.
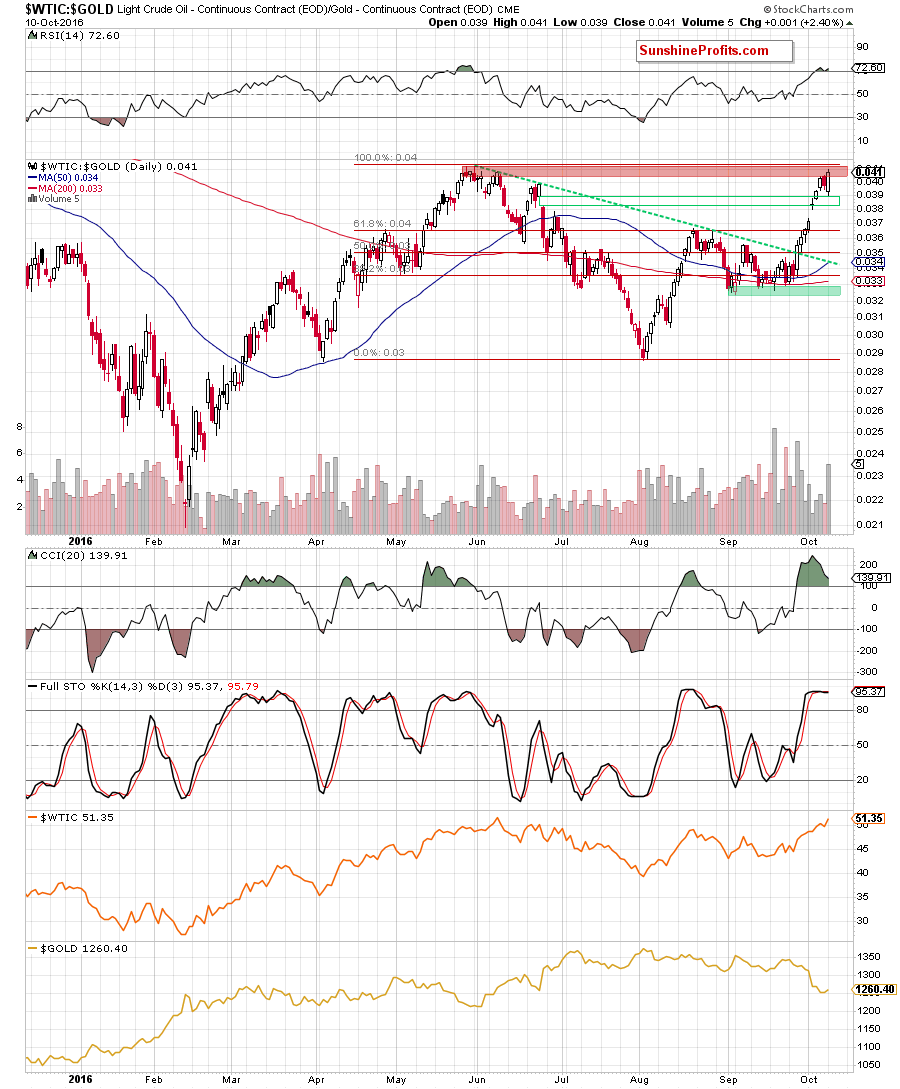
Looking at the daily chart, we see that the ratio moved sharply higher in recent days, which resulted in a bullish gap in the previous week. This event triggered another upswing, which closed the bearish gap from Jun 24 and encouraged bulls to further action. Thanks to these circumstances, we saw a rally, which approached the ratio to the red resistance zone based on May and Jun highs. What can we expect in the coming days? Taking into account the proximity to this important resistance zone and the current position of the indicators (the RSI climbed above the level of 70, the CCI moved lower, creating a negative divergence between itself and the value of the ratio and the Stochastic Oscillator generated a sell signal), we think that reversal is just around the corner.
How did this move affect the medium-term picture? Let’s check.
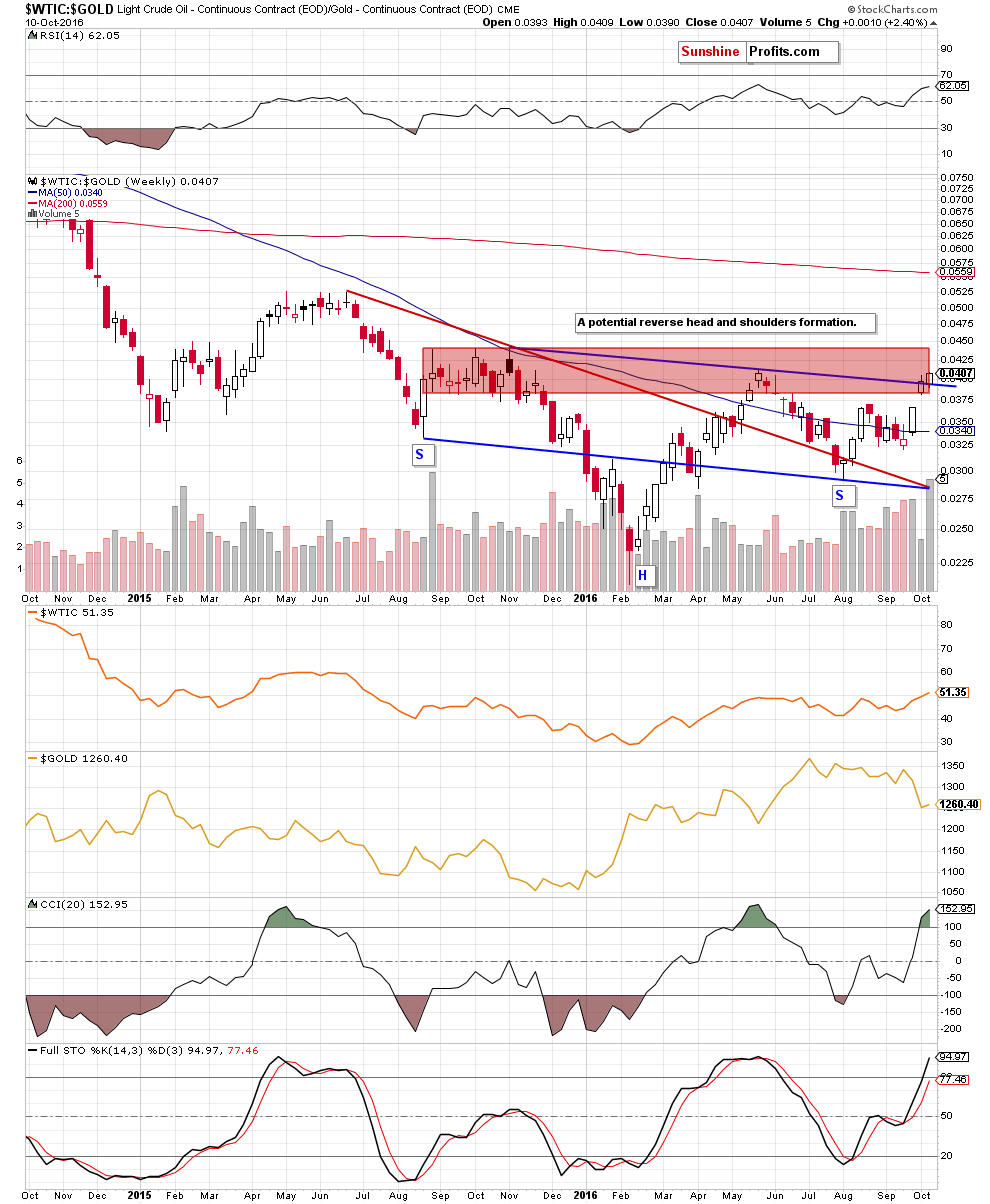
The first thing that catches the eye on the weekly chart is a breakout above the neck line of a potential reverse head and shoulders formation. Although this is a bullish signal, we should keep in mind that there was a similar price action in the previous week. Back then, bulls didn’t manage to hold gained levels, which resulted in a pullback. Therefore, in our opinion, this week’s breakout would be more reliable only if the ratio closes this Friday’s session above 0.04.
Once we know the above, let’s take a closer look at the relation between oil and the general stock market.
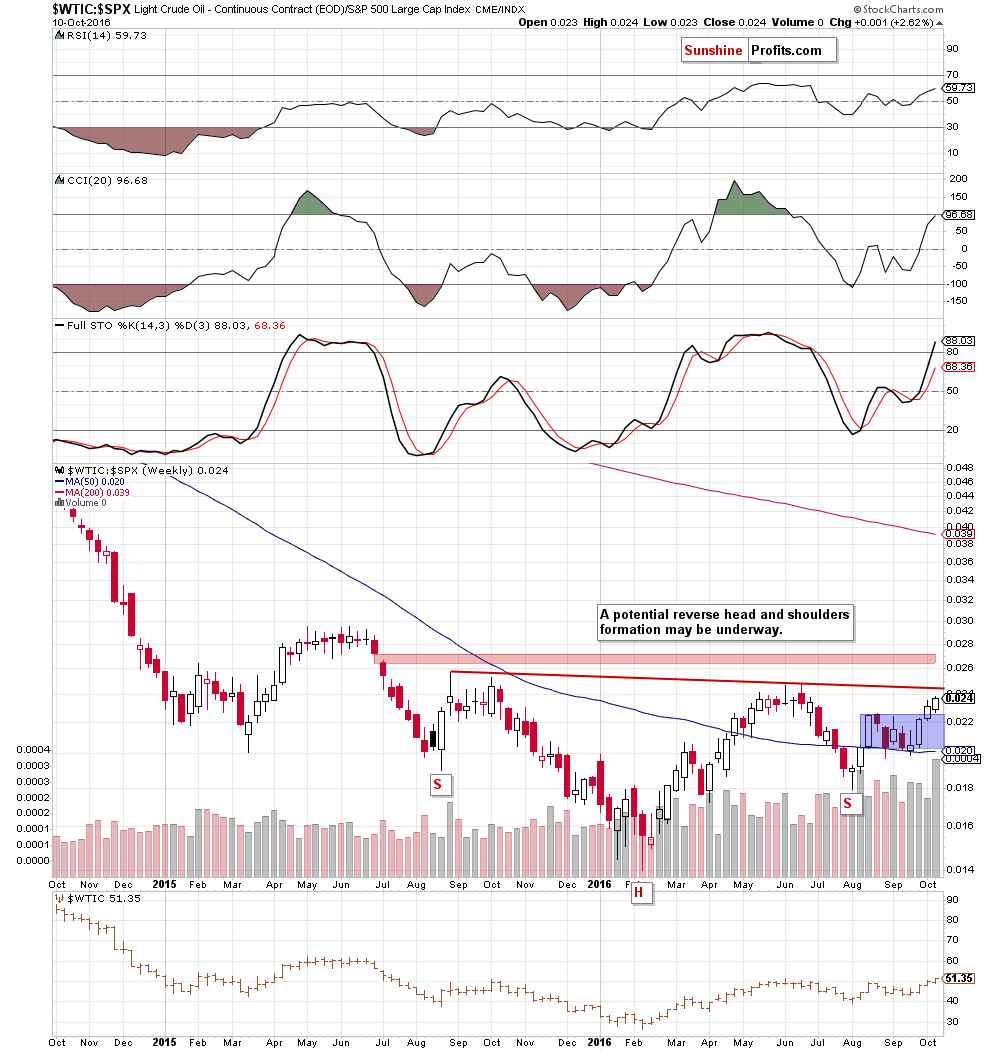
On the weekly chart, we see that although the ratio broke above the upper border of the blue consolidation, the red resistance line based on the Aug 2015 and Jun 2016 highs continues to keep gains in check. Additionally, the ratio remains under the red resistance zone marked on the very short-term chart below.
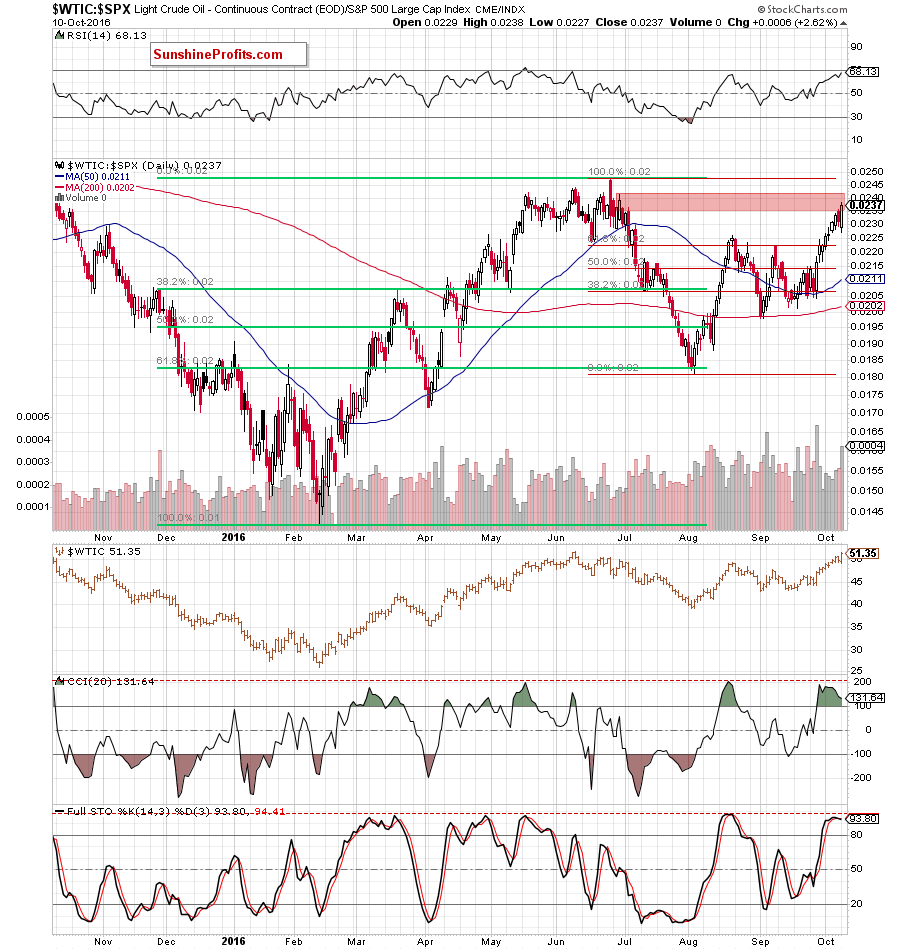
From the daily perspective, we also see that (similarly to what we wrote in case of both above-mentioned ratios) there are negative divergences between indicators and the ratio, which do not bode well further rally. On top of that, the Stochastic Oscillator generated a sell signal, which would become even more bearish if drops below the level of 80 in the coming days.
Non-USD Crude Oil Price
Know the situation for the above ratios, let’s move on to the non-USD (WTIC:UDN ratio) chart of crude oil. As a reminder, UDN is the symbol for the PowerShares DB US Dollar Index Bearish Fund, which moves in the exact opposite direction to the USD Index. Since the USD Index is a weighted average of the dollar's exchange rates with world's most important currencies, the WTIC:UDN ratio displays the value of crude oil priced in "other currencies".
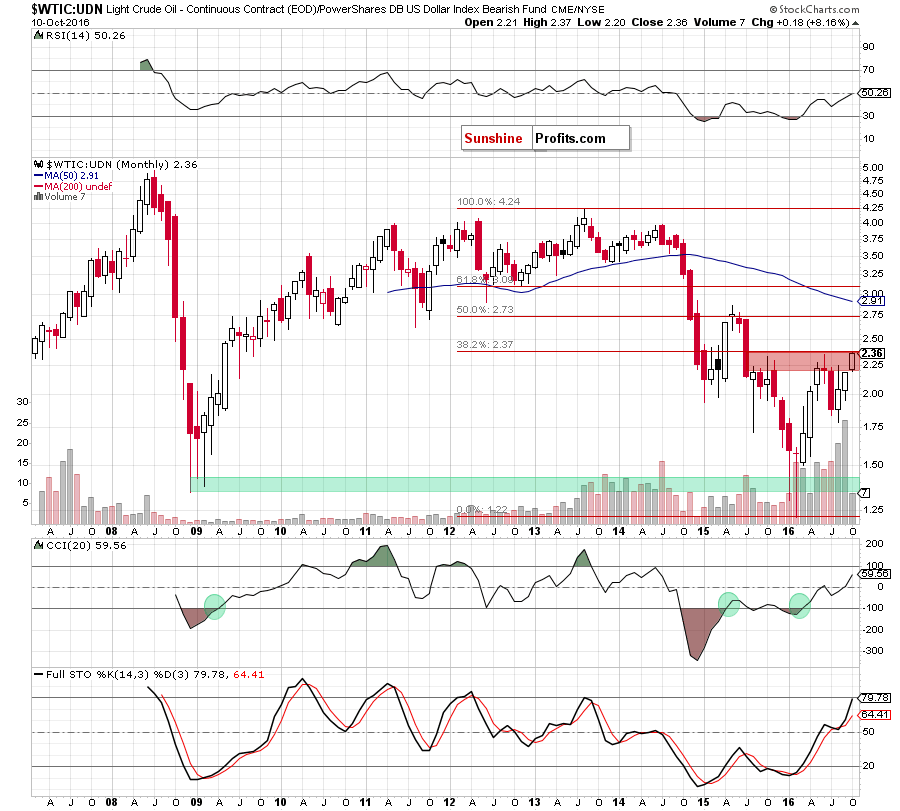
Looking at the above chart, we see that although the ratio extended gains and broke above the Jun high (the breakout is unconfirmed), the 38.2% Fibonacci retracement (based on the entire Aug 2013-Feb 2016 downward move) continues to keep gains in check. This suggests that only a confirmed breakout above this resistance would open the way to higher levels. Until this time, another reversal should not surprise us. If we see such price action, light crude (priced in the U.S. dollars) will also reverse and correct the recent upward move in near future.
Scenarios
Just like a month ago, today’s Oil Investment Update includes scenarios of what could happen in the coming weeks. Naturally, we will continue to monitor the market in the coming days and if anything invalidates our long-term outlook we will send you an additional message.
- Bullish scenario
If crude oil extends gains and climbs above the Jun high of $51.67, the next upside target would be around $60-$62.58, where the 38.2% Fibonacci retracement (based on the entire 2011-2016 downward move), May and Jun 2015 highs are. - Bearish scenario
If the commodity drops under the barrier of $50, invalidating earlier breakout, the initial downside target would be around $47.75-$48.46, where the lower red zone (marked on the daily chart) is. If this area is broken, the next targets would be: the medium-term black rising line based on the Feb and Aug lows (at the moment of writing these words at $46.08), the late-Sep lows (around $44.19-$44.35), the green support zone based on the Sep lows (and reinforced by the 200-day moving average) and finally the barrier of $40 with the next green support zone slightly below it.
Summary
Although oil bulls managed to push crude oil higher in recent weeks, the upper border of the key resistance zone (based on the Jun high of $51.67) continues to keep gains in check. On one hand, such rally looks bullish (especially if someone focus only on higher volume that accompanied yesterday’s session), but if we take a closer look at the charts, we easily notice disturbing factors. Firstly, the current position of the daily indicators (not only in the case of crude oil, but also in the case of all our above-mentioned ratios) suggests that the space for gains is limited as there are not only negative divergences between indicators and the price of light crude (or between indicators and the value of the ratios), but also Stochastic Oscillators generated sell signals in almost all the above-mentioned ratios (and crude oil of course). Secondly, not only crude oil reached its critical technical point, but also the oil-to-oil stock, oil-to-gold, oil-to-stocks and non-USD met their very important resistance zones or lines, which increases the probability of reversal in near future. If we see such price action, and crude oil invalidates earlier breakout above the barrier of $50, we’ll see a realization of the bearish scenario in the coming weeks.
Very short-term outlook: mixed with bearish bias
Short-term outlook: mixed
MT outlook: mixed
LT outlook: mixed
Trading position (our opinion): No positions justified from the risk/reward perspective.
This completes this month’s Oil Investment Update. Our next Oil Investment Update is scheduled for Friday, Nov 4, 2016. Oil Trading Alerts subscribers will additionally receive similar but shorter alerts on a daily basis (or more than once a day when the situation requires it). You – Oil Investment Updates subscribers – will receive short Investment Alert messages should the outlook for the medium or long term change before the next Update is posted.
Thank you.
Nadia Simmons
Forex & Oil Trading Strategist
Oil Investment Updates
Oil Trading Alerts

