

Although the world's largest oil exporters failed to reach an agreement in Doha to freeze output at January levels, the price of crude oil extended gains and hit a fresh 2016 high of $46.78 in less than two weeks after this negative event for oil. What were the main reasons for this rally? First improvement came after Iran deputy oil minister commentary told that Iranian production could return to pre-sanction levels in two months, which raised hopes that Iran might want to renew talks on freezing output when OPEC meets next in June. In the following days, the price of the commodity was also supported by hopes that demand could grow ahead of the summer driving season, however, Wednesday’s report showed that gasoline inventories surged by 0.536 million barrels in the week ending on April 29, which doesn’t bode well for the oil market – especially when we factor in the fact that the recent increase in crude oil stockpiles pushed inventories on the East Coast and in the Midwest to their highest levels since at least 1990. Additionally, supplies at Cushing, Oklahoma stood at 543.4 million barrels, which was the highest level on record. Despite these bearish numbers, market participants have focused on U.S. production, which has fallen in 11 consecutive weeks and dropped to the lowest level since Sept., 2014. Is it as bullish signal as it seems at the first sight? In our opinion, not really. Why? Because despite all declines, crude oil inventories have rising almost every week. At this point, it is worth noting that they decreased only 3 times since the beginning of the year. In all other cases they rose more or less than analysts’ forecasts, which suggest that that market conditions remained weak due to an ongoing glut. On top of that, we should also keep in mind that OPEC increased production by 170,000 barrels per day in Apr., which is an additional bearish signal for the market. Nevertheless, before we know what the future will bring, let’s jump right into charts (charts courtesy of http://stockcharts.com) and find out what can we infer from them about next oil market’s moves.
Crude Oil
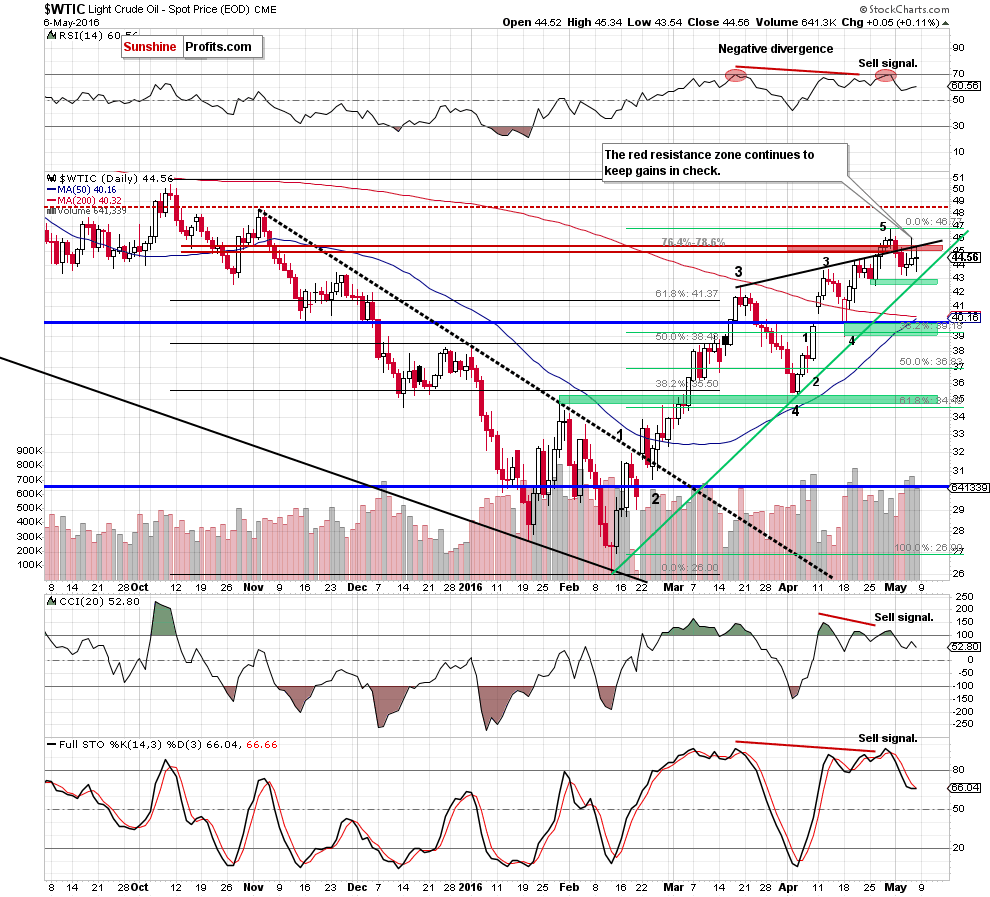
Looking at the daily chart, we see that light crude climbed to an intraday high of $46.07 and approached the May 2 peak on Thursday. Despite this improvement, oil bulls didn’t manage to push the commodity higher, which resulted in a sharp pullback. As a result, crude oil slipped under the black resistance line and the red resistance zone, invalidating earlier breakout once again. In our opinion, this is an additional negative signal, which suggests further deterioration in the coming week – especially when we factor in sell signals generated by the indicators, which continue to support oil bears and lower prices. On top of that, on the following day, bulls failed once again and light crude closed the week under the above-mentioned resistance area, which increases the probability of reversal in the coming week. If this is the case, and light crude moves lower from current levels – we’ll see a drop to the first support area and the green support line (around $42.68) in near future.
Having said the above, let’s check whether yesterday’s increase change anything in the long- and medium-term picture or not. Let’s examine charts and find out.
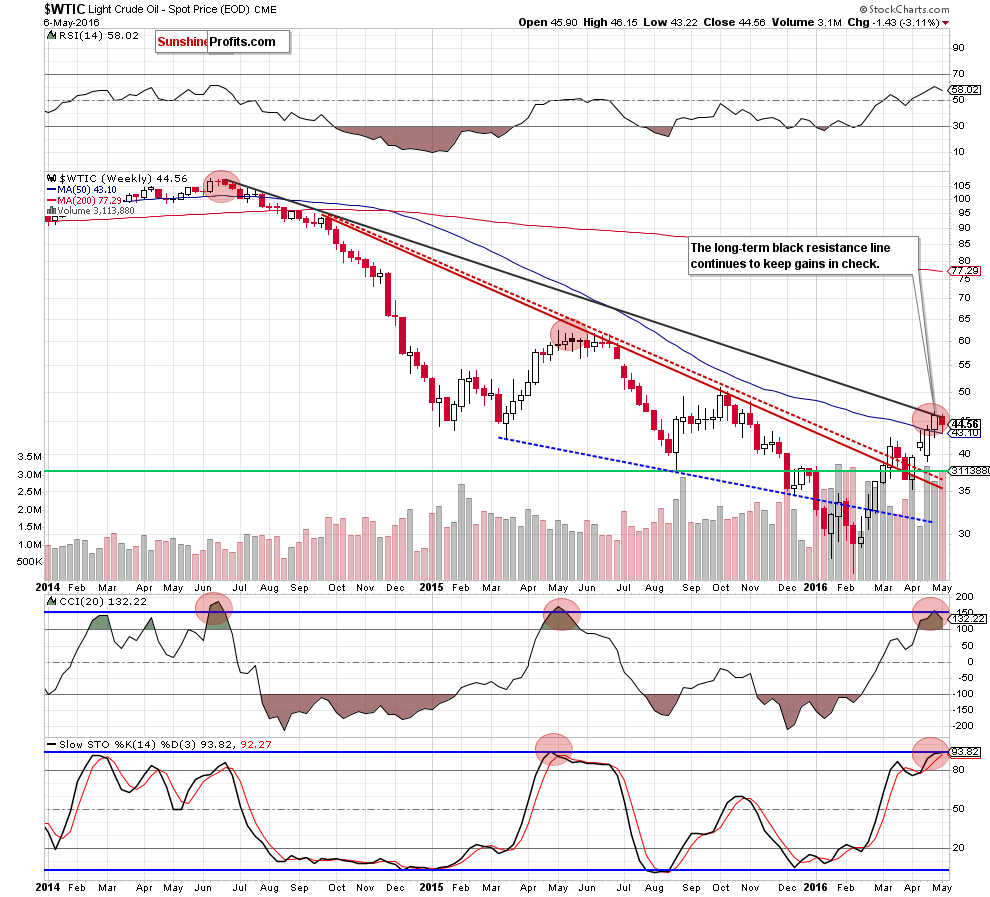
From this perspective, we see that although crude oil moved little higher yesterday, this upswing didn’t change anything as black gold is still trading under the long-term black resistance line, which means that invalidation of earlier small breakout and its negative impact on the price is still in play. Therefore, further deterioration in the coming week should not surprise us – especially when we factor in the fact that light crude closed last week under the black line.
What can we infer from the monthly chart? Let’s find out.
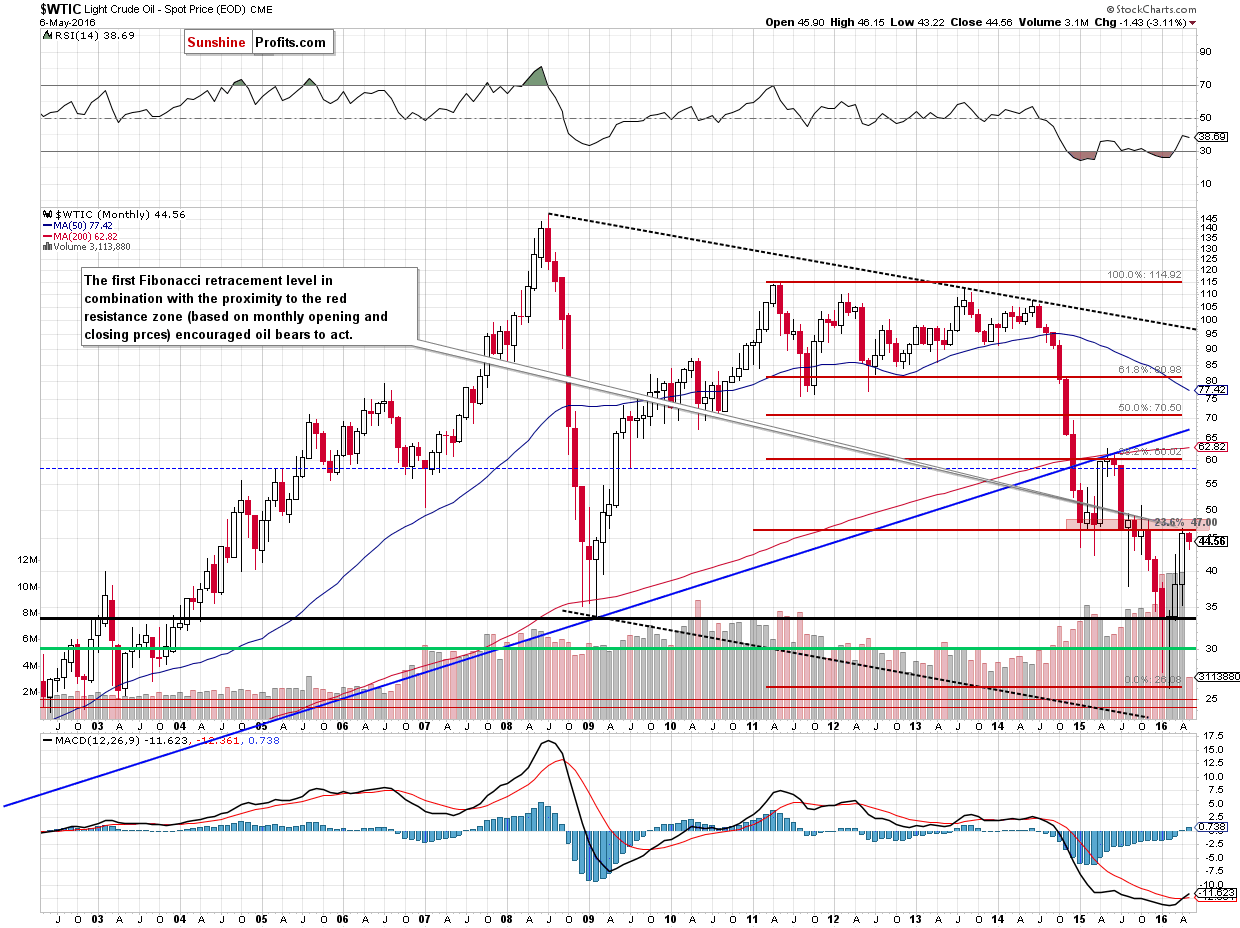
Looking at the monthly chart, we see that the commodity remains under the 23.6% Fibonacci retracement and the red resistance zone (created by the Jan, Feb, March, Apr, Jul, Aug, Oct and Nov 2015 monthly opening and closing prices), which means that further deterioration is just around the corner.
Summing up, although crude oil moved sharply higher on Thursday, oil bulls didn’t manage to hold gained levels, which resulted in equally sharp decline that took the commodity under the long-term black resistance line (marked on the weekly chart), the black resistance line and red resistance zone (seen on the daily chart). In this way, light crude invalidated earlier breakouts once again, which is a negative signal that suggests further deterioration to at least $42.68 in near future.
Having discussed the situation in crude oil, let’s examine the NYSE Arca Oil Index (XOI) to find out what the current outlook for oil stocks is.
Oil Stocks
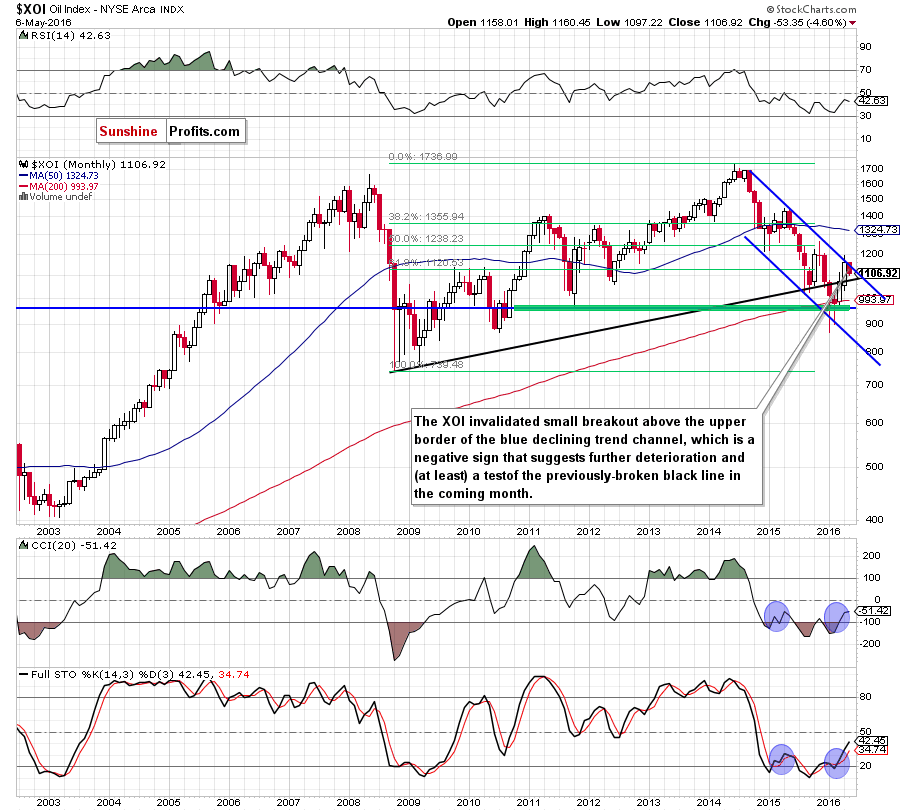
Looking at the monthly chart, we see that oil bulls push the XOI higher in the previous month, which resulted in invalidation of the breakdown under the long-term black resistance line. This positive signal triggered further improvement and oil stocks increased slightly above the upper border of the blue declining trend channel. Despite this improvement, oil bulls didn’t manage to hold gained levels, which resulted in a decline under this important resistance line. Earlier this month, we saw similar price action, but the index dropped once again, invalidating earlier breakout. This is a bearish signal, which suggests further deterioration and (at least) a test of the previously-broken black long-term support/resistance line (currently around 1,070) in the coming weeks.
Finishing today’s commentary on the long-term picture, we would also like to draw your attention to the current position of the monthly indicators. As you see, we saw similar signals at the beginning of Feb 2015. Back then, they didn’t trigger significant upward move, which suggests that they are not reliable enough.
Are there any other factors that could encourage oil bears to act? Let’s examine the weekly chart and find out what can we infer from it.
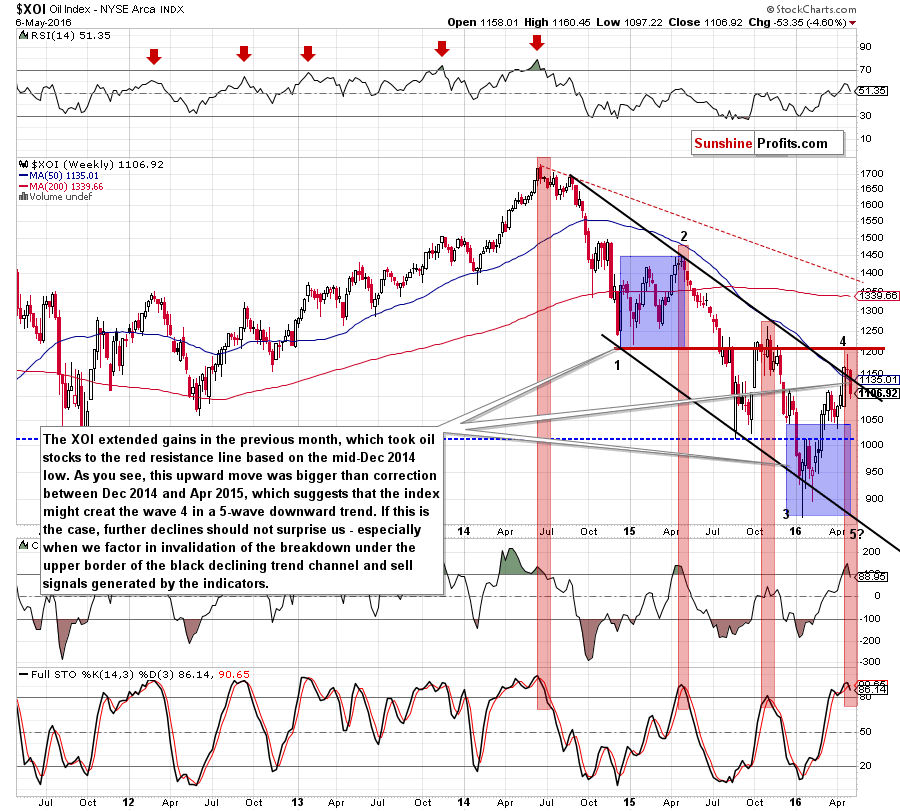
From this perspective, we see that the recent upward move took oil stocks to the red resistance line based on the mid-Dec 2014 low (the bottom of the potential first wave). As you see the upward move since Jan was much bigger than correction between Dec 2014 and Apr 2015, which suggests that the index might create a wave 4 in a 5-waves downward trend (according to Elliot’s waves theory).
If this is the case, further declines in the coming weeks should not surprise us – especially when we factor in sell signals generated by the CCI and Stochastic Oscillator. Is it more reliable than monthly indicator? In our opinion, it is, because all sell signals generated since 2014 preceded sizable downward moves, which increases the probability that we’ll see similar price action later this month.
Will the very short-term picture confirm this scenario? Let’s check the daily chart.
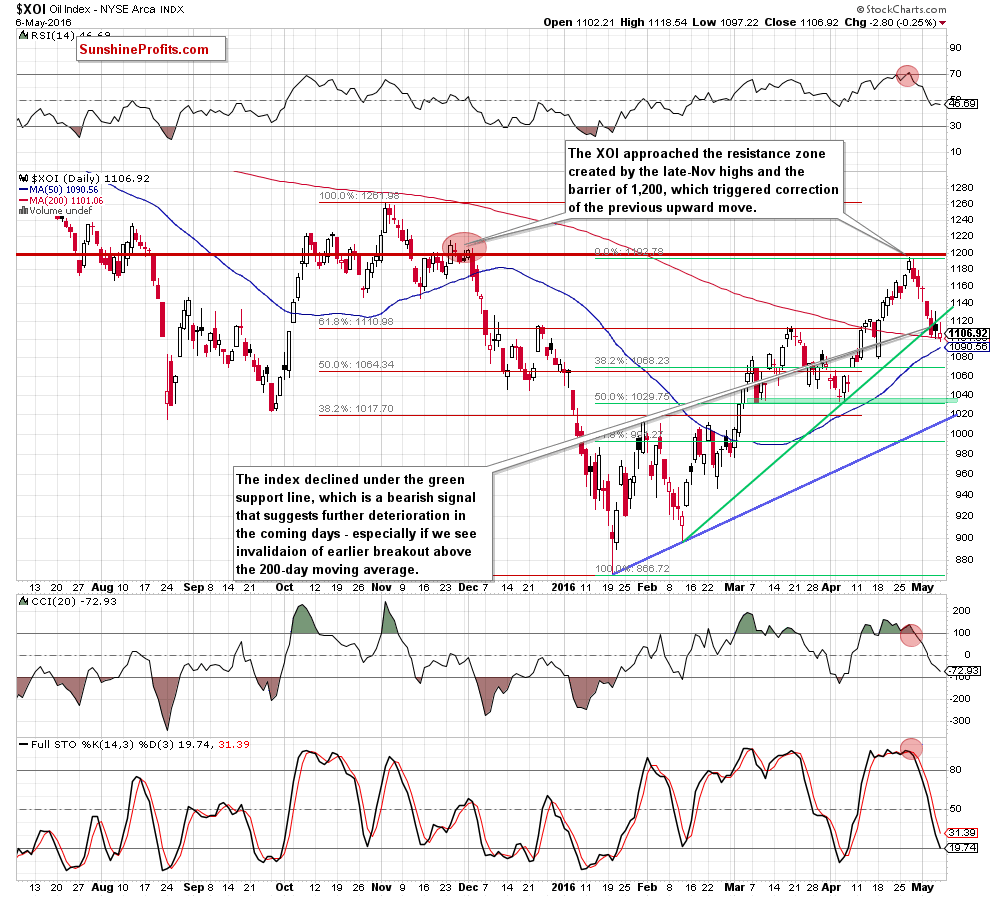
On the very short-term chart, we see that oil stocks extended gains since our previous Oil Investment Update was posted and approached the resistance zone created by the late-Nov highs and the barrier of 1,200, which triggered a correction of the earlier upward move. With this decline, the XOI dropped under the medium-term green support line, which is a bearish signal that suggests further deterioration - especially if we see invalidation of the breakout above the 200-day moving average. Additionally, sell signals generated by the indicators are still in play, supporting oil bears and lower prices. If this is the case and oil stocks move lower once again, the initial downside target would be around 1,032-1,038, where the green support zone and the 50% Fibonacci retracement level (based on the Jan-Apr rally) are.
Summing up, the resistance zone created by the late-Nov highs and the barrier of 1,200 triggered a correction, which took oil stocks not only under the medium-term green support line (seen on the daily chart), but also below the upper border of the long-term declining trend channel marked on the long- and medium-term charts. In this way, the XOI invalidated earlier small breakouts, which is a bearish signal that suggests further deterioration in the coming weeks.
Ratio Analysis
Today, we start this section by focusing on the oil-to-oil stocks ratio. What can we infer from the chart below?
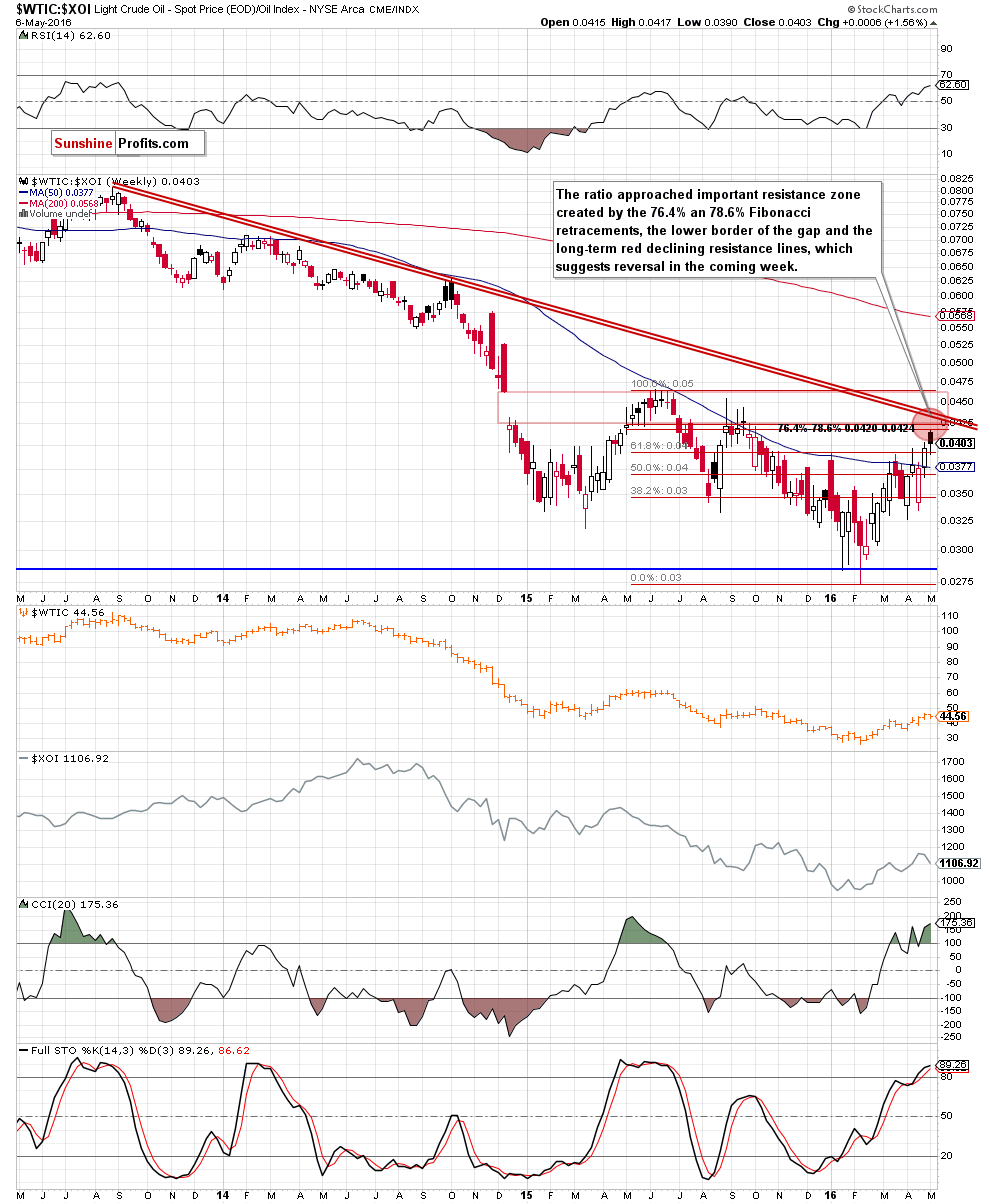
Looking at the above chart, we see that the ratio approached important resistance zone created by the 76.4% and 78.6% Fibonacci retracement levels (based on the entire Jun 2015-Feb 2016 declines). In this area is also the lower border of the gap (seen in Dec 2014) and the long-term red declining resistance lines, which could stop further improvement in the coming week. Additionally, the CCI and Stochastic Oscillator increased to levels not seen since Jun 2015, which suggests that the space for increases may be limited and reversal in the coming week is very likely. If this is the case and the ratio declines from current levels, we’ll also see lower values of crude oil and oil stocks later in May – similarly to what we noticed in the past.
Having said the above, let’s analyze the oil-to-gold ratio.
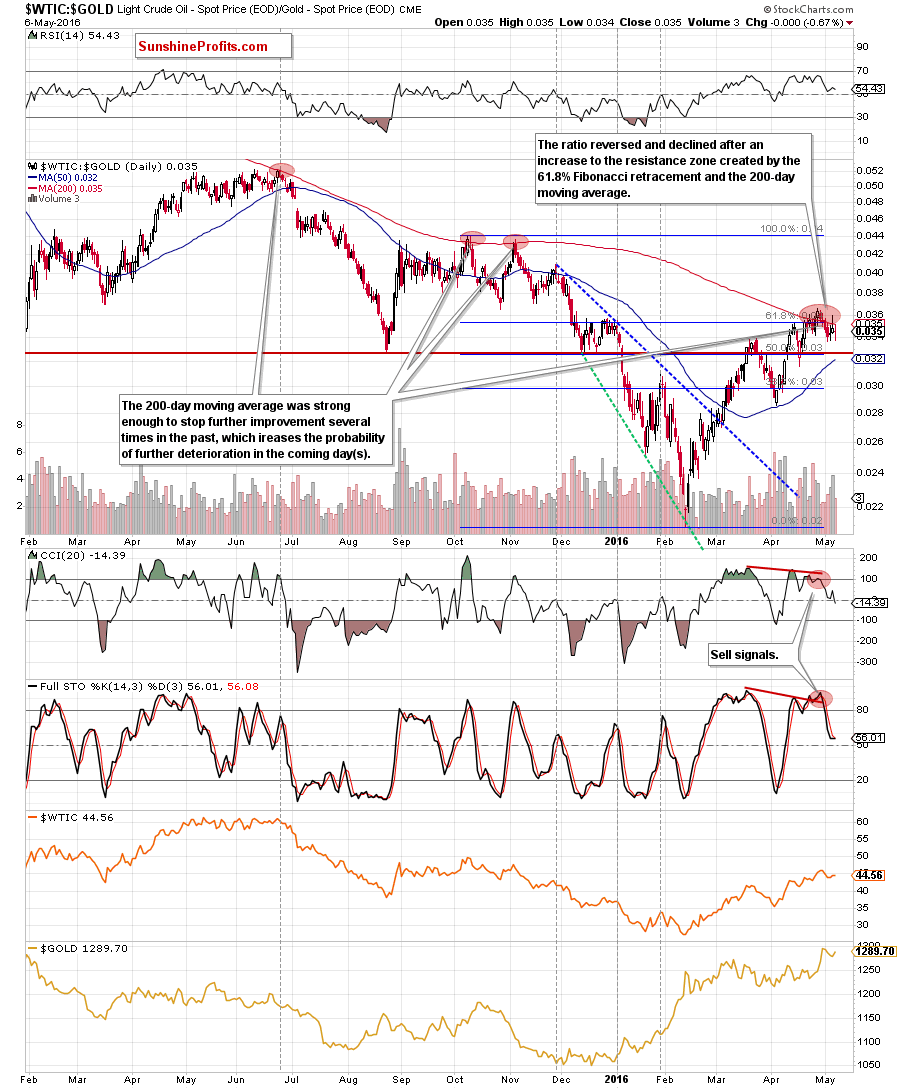
Looking at the above chart, we see that the ratio re-tested the red resistance zone created by the 61.8% Fibonacci retracement (based on the Oct-Feb downward move) and the 200-day moving average. As you see several times in the past, this important moving average was strong enough to stop further improvement (even if we saw small and very short-lived breakouts above it), which increases the probability of declines in the coming day(s). Additionally, the CCI and Stochastic Oscillator generated sell signals, supporting further deterioration and lower prices of both commodities.
On top of that when we zoom out our picture, we notice one more interesting fact.
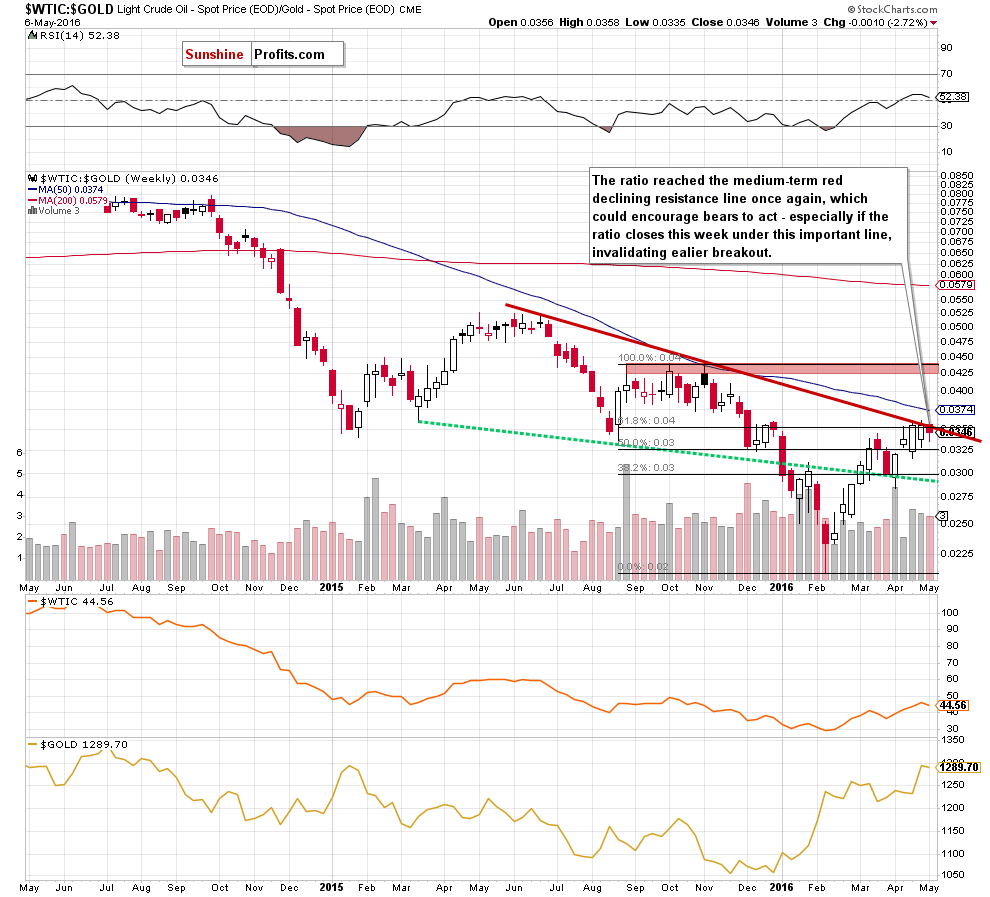
From this perspective, we see that although the ratio re-tested the medium-term red declining resistance line, bulls failed and we saw a comeback under this key resistance, which is another pro-bearish factor that could encourage bears to act in near future.
Additionally, there is one more interesting fact, which supports declines. Let’s take a closer look at the long-term chart and find out what it is.
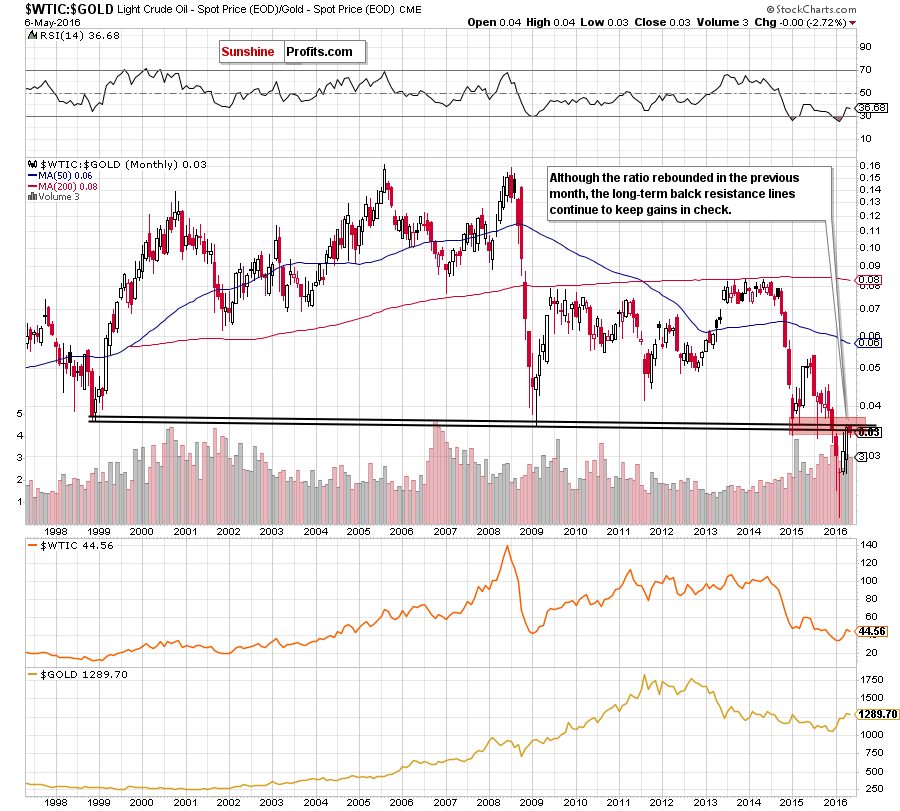
On the monthly chart, we see that the recent upward move took the ratio to the long-term black resistance lines based on the Nov, Dec 1998 and Feb 2009 lows. In this area is also the red resistance zone, which suggests that as long as there won’t be comeback above this area, further rally is not likely to be seen. Therefore, in our opinion, reversal from current levels is more likely than not and lower values of both commodities are just around the corner.
Having said the above, let’s check whether the oil-to-silver ratio give us more clues about future moves or not.
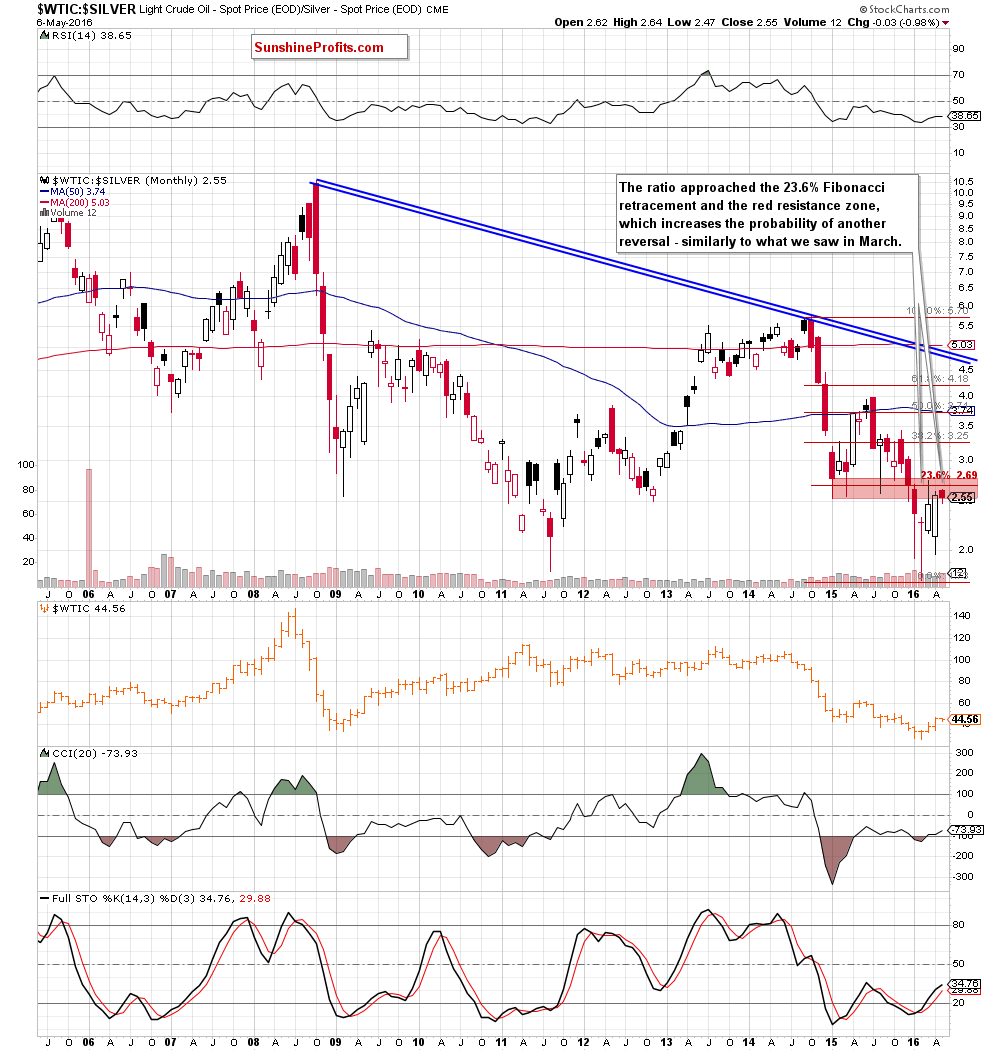
On the long-term chart, we see that the ratio approached the 23.6% Fibonacci retracement and the red resistance zone, which increases the probability of another reversal in the coming month – similarly to what we saw in March.
Can we infer something more from the weekly chart? Let’s examine the chart below and find out.
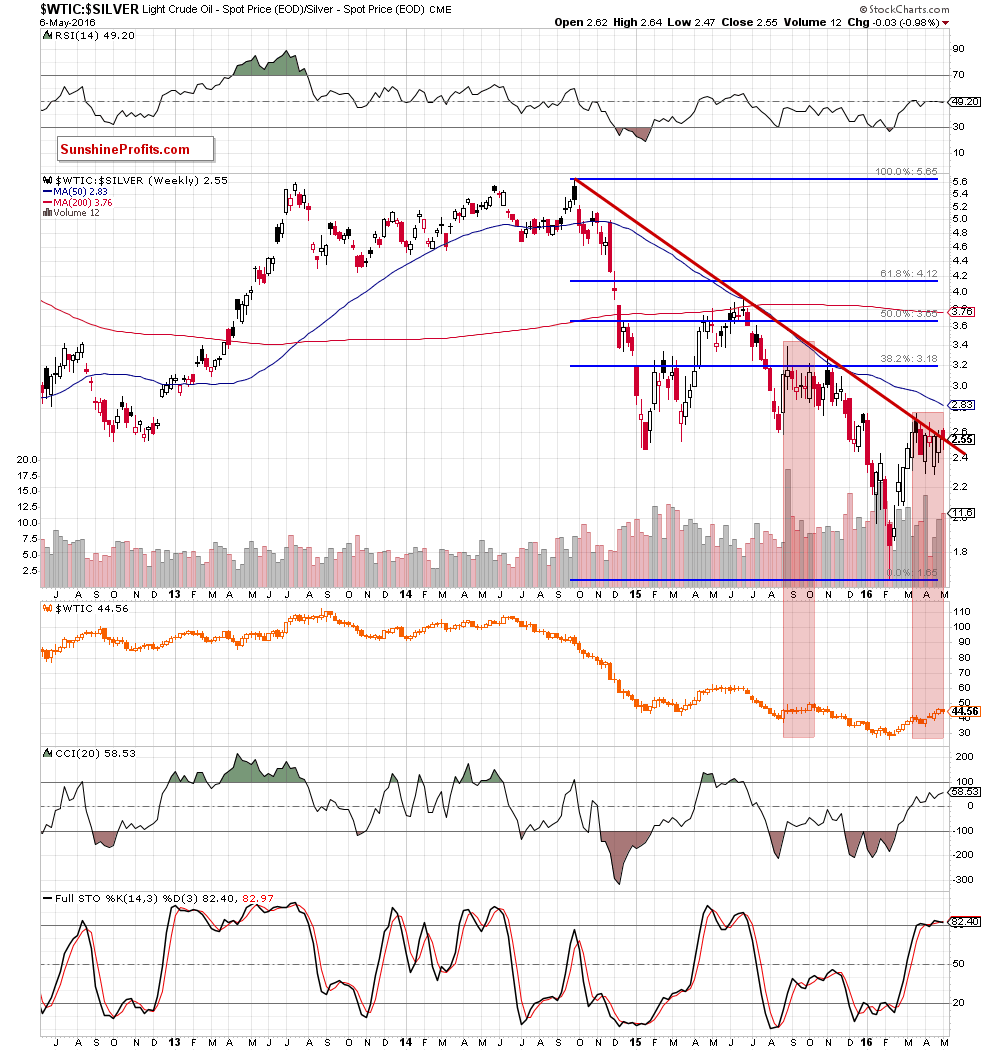
The first thing that catches the eye on the above chart is negative divergence between the ratio and the price of crude oil. When we took a closer look at the chart we noticed similar situation in the previous year. Back then, such price action preceded declines in the commodity, which suggests that history may repeat itself once again – especially when we factor in another invalidation of the breakout above the long-term red declining resistance line and high readings of the CCI and Stochastic Oscillator.
Finishing today’s Oil Investment Update, we would like to draw your attention to the current picture of the USD Index as the greenback is one of major factors that affect the price of the commodity.
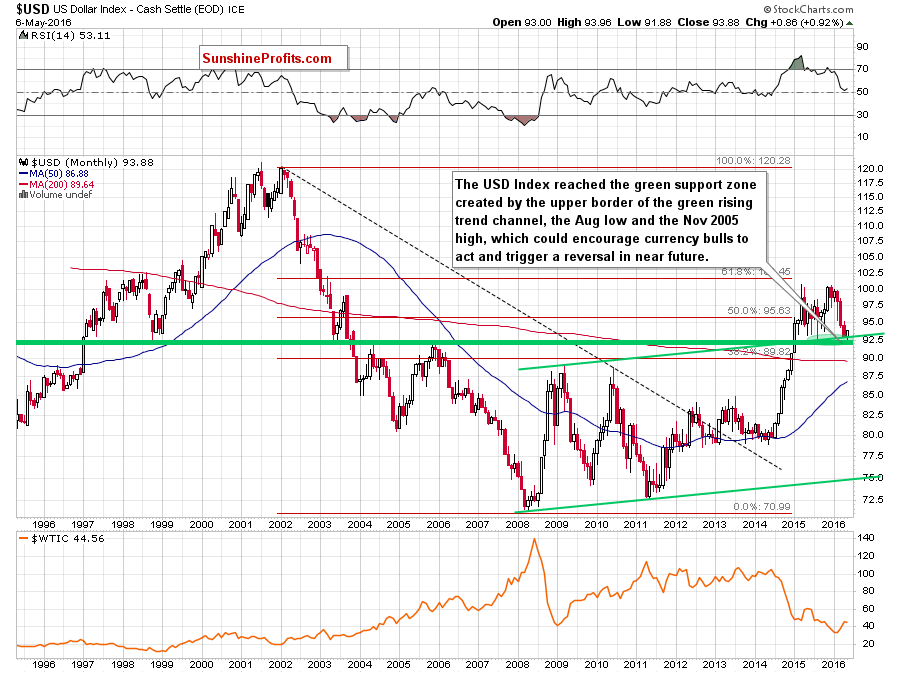
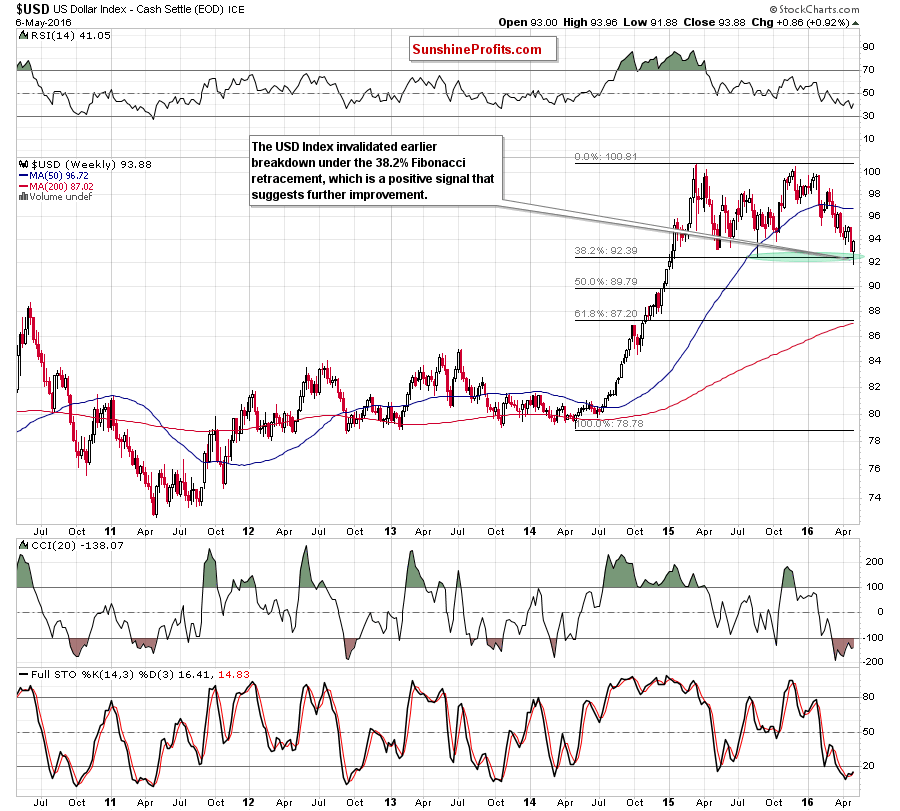
From the long- and medium-term perspective, we see that the USD Index extended losses and slipped slightly below the green support zone created by the upper border of the long-term green rising trend channel, the Aug low, the Nov 2005 high and the 38.2% Fibonacci retracement (based on the May 2014-Mar 2015 rally). Despite this deterioration, currency bulls didn’t give up and the index rebounded, invalidating earlier breakdowns. This is a bullish signal, which in combination with buy signal generated by the Stochastic Oscillator (so far weak, but still) suggests further improvement. If this is the case and the greenback extends gains in the coming weeks, the price of crude oil will likely decline as stronger U.S. dollar usually makes the commodity less attractive for buyers holding other currencies.
Scenarios
Just like a month ago, today’s Oil Investment Update includes scenarios of what could happen in the coming weeks. Naturally, we will continue to monitor the market in the coming days and if anything invalidates our long-term outlook we will send you an additional message.
- Bullish scenario
If crude oil breaks successfully above the red resistance zone created by the 76.4% and 78.6% Fibonacci retracement levels based on the entire Oct-Feb downward move (marked on the daily chart), we’ll see a test of the next resistance zone (around $48.46-$50.92) created by the Oct, Nov highs and the next psychologically important barrier. If this area is broken, oil bulls could push the commodity even to around $60, where the 38.2% Fibonacci retracement (based on the entire 2011-2016 downward move), May and Jun 2015 highs are. - Bearish scenario
If the commodity extends declines from current levels, the first downside target would be the green support zone (marked on the daily chart) around $42.68. If it is broken, oil bears will likely push the commodity to around $38.86-$40, where the next psychologically important barrier, the 38.2% Fibonacci retracement based on the entire Feb-Apr rally and mid-Apr low (the bottom of the previous bigger correction) are. If this area doesn’t stop declines, we may see correction to around $36.41 (the 50% retracement), $34 (the 61.8% retracement or even to around $30.48-$30.94, where the next important support zone (created by the 76.4% and 78.6% Fibonacci retracement levels) is.
Summary
In recent weeks crude oil extended gains and climbed temporary above the resistance zone created by the 76.4%, 78.6% Fibonacci retracement levels (based on the Oct-Feb downward move) and reinforced by the long-term black resistance line based on the Jun and Sept 2014 highs. With this upward move, the commodity also approached the 23.6% Fibonacci retracement (based on the entire Apr 2011-Feb 2016 declines), which successfully stopped further improvement, encouraging oil bears to act. At the end of the previous week, their opponents tried to push light crude higher, but this key resistance zone stopped them once again. As a result, we saw another invalidation of earlier small breakouts, which is a negative signal that suggests further deterioration in the coming week(s) – especially when we factor in sell signals generated by the indicators, the current situation in all the above-mentioned ratios and a bullish picture of the U.S. dollar.
Very short-term outlook: bearish
Short-term outlook: bearish
MT outlook: mixed with bearish bias
LT outlook: mixed
Trading position (our opinion): Short positions (with a stop-loss order at $48.56 and initial downside target at $35.24) are justified from the risk/reward perspective. We will keep you informed should anything change, or should we see a confirmation/invalidation of the above.
This completes this month’s Oil Investment Update. Our next Oil Investment Update is scheduled for Friday, Jun 10, 2016. Oil Trading Alerts subscribers will additionally receive similar but shorter alerts on a daily basis (or more than once a day when the situation requires it). You – Oil Investment Updates subscribers – will receive short Investment Alert messages should the outlook for the medium or long term change before the next Update is posted.
Thank you.
Nadia Simmons
Forex & Oil Trading Strategist
Oil Investment Updates
Oil Trading Alerts

