

From today’s point of view, we can say with full conviction that March increases crude oil owes mostly due to hopes that the deal between OPEC and non-OPEC producers to freeze oil output at Jan (near-record) levels will be reached. Nevertheless, in recent weeks, a lot of uncertainty appeared around the participation of Iran in this historical project, which in combination with the subsequent rises in U.S. crude oil stocks pushed the price of the commodity below $40. As a reminder, in mid-March Iranian Oil Minister said that his country won't join a production freeze deal until Iran increases its output to 4 million barrels a day (bpd). In response to this comment, Russian energy minister said that Iran had the right to increase output after years of sanctions, which increased uncertainty surrounding the agreement. On top of that, at the begining of Apr, Saudi Arabia's deputy crown prince Mohammed bin Salman told that his country will only freeze its oil output if Iran and other producers agree to cut theirs. Several days later, Russia reported that its oil production rose to 10.91M bbl per day in the previous month (up 0.3% from Feb), which was the highest level since 1987 when the country produced 11.5M bbl per day. This news, in combination with earlier Saudi Arabia comments increased doubts about the ability of the largest oil exporters to reach an agreement when they meet in Doha on April 17. As a result, light crude extended losses and dropped below $36 in recent days. Despite this deterioration, the commodity rebounded after Wednesday’s EIA report showed that U.S. crude oil inventories decreased by 4.94 million barrels for the week ending on April 1, which was the first important drop since mid-Jan. Will we see further improvement and a comeback above $40 in the coming weeks? Will potential freeze deal be as bullish for crude oil as it seems at the first sight? Or maybe OPEC and non-OPEC producers will not reach an agreement and we’ll see further declines? Before we know what the future will bring, let’s jump right into charts (chart courtesy of http://stockcharts.com) and find out what can we infer from them about next oil market’s moves.
Crude Oil
In our Wednesday’s Oil Trading Alert, we wrote the following:
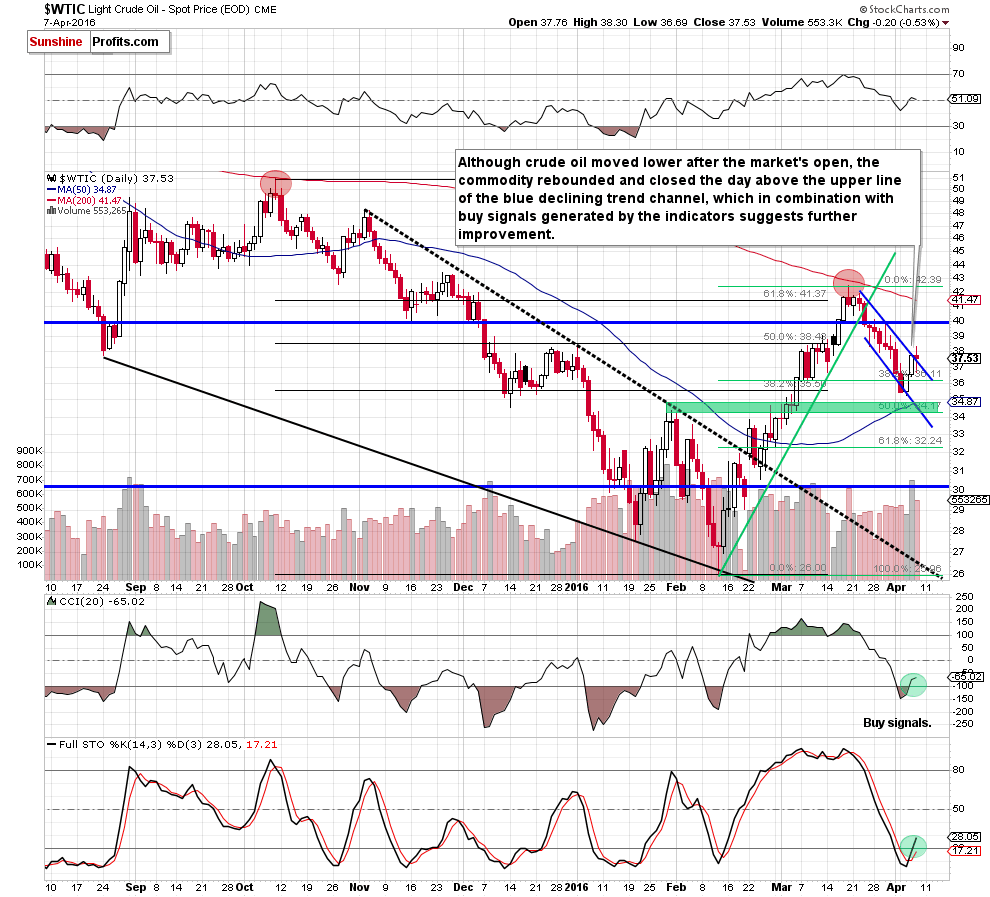
(…) oil bulls (…) pushed light crude above the lower border of the blue declining trend channel, invalidating earlier breakdown. This positive signal triggered further improvement and (…) we think that light crude will extend gains in the coming day and we’ll see (at least) a test of the upper line of the blue declining trend channel (currently around $37.65).
On the daily chart, we see that the situation developed in line with the above scenario and crude oil reached our upside target on the following day. As you see, Thursday’s increase materialized on significant volume (compared to earlier declines), which confirmed oil bulls’ strength. On top of that, the CCI and Stochastic Oscillator generated buy signals, which suggests that further improvement is just around the corner. Nevertheless, before yesterday’s increase above the upper border of the blue trend channel, oil bears pushed the commodity little lower as the upper blue line encouraged some day traders to take profits off the table. With yesterday’s move, light crude climbed to the 38.2% Fibonacci retracement based on entire Mar-Apr decline, which resulted in a reversal and a small pullback. Despite this fact, the commodity closed the day above the blue line, which suggests a verification of earlier breakout. If this is the case, light crude will extend gains from here and the initial upside target would be around $38.86 (the 50% Fibonacci retracement based on entire Mar-Apr decline).
Having said the above, let’s examine the weekly chart and find out how this increase affected the medium-term picture.
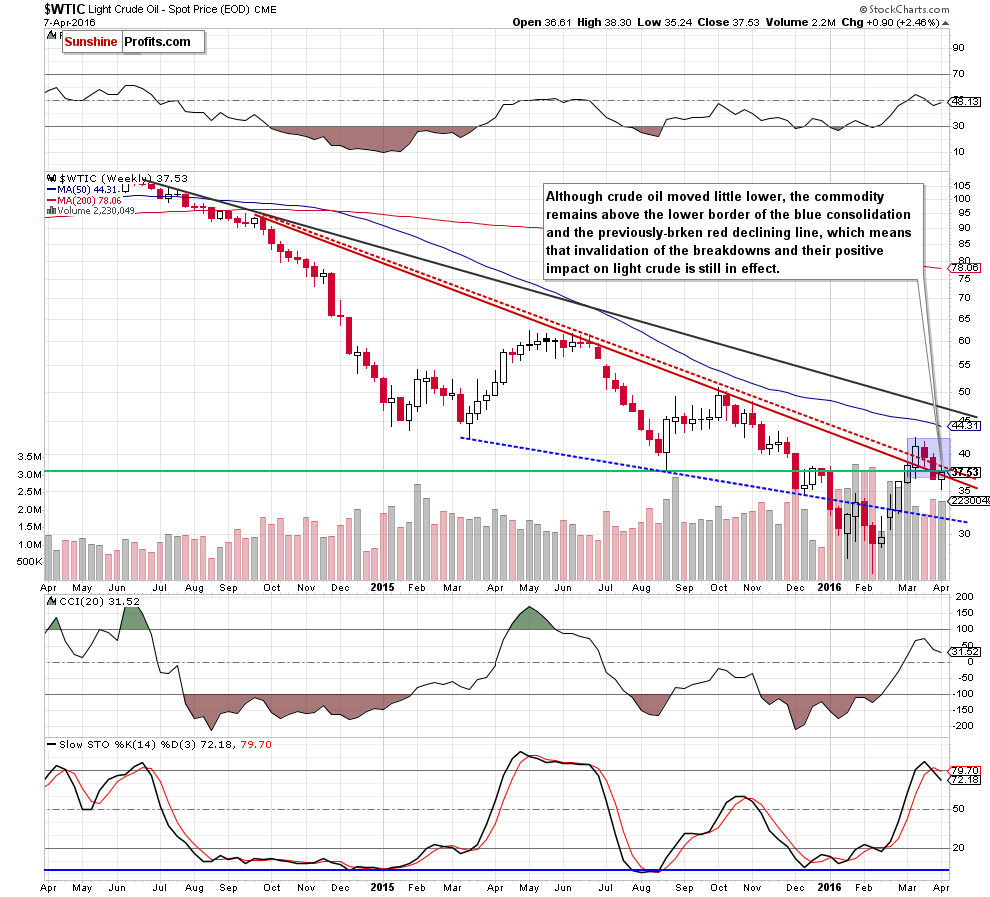
The first thing that catches the eye on the above chart is an invalidation of the breakdown under the lower border of the blue consolidation. This positive signal triggered further improvement and crude oil climbed above the red declining line, invalidating earlier breakdown. Although crude oil moved little lower yesterday, the commodity remains above the lower border of the blue consolidation and the red declining line, which means that invalidation of earlier breakdowns and its positive impact on light crude is still in effect, suggesting further improvement. However, such price action will be more likely and reliable if the commodity increases above the red dashed declining line (currently around $38.40). Until this time pullback can’t be ruled out.
Summing up, crude oil climbed to the 38.2% Fibonacci retracement (based on entire Mar-Apr decline), which triggered a small pullback and a comeback to the previously-broken upper border of the blue declining trend channel, which looks like a verification of earlier breakout. If this is the case, light crude will extend gains from here and the initial upside target would be around $38.86 (the 50% Fibonacci retracement).
Having discussed the situation in crude oil, let’s examine the NYSE Arca Oil Index (XOI) to find out what the current outlook for oil stocks is.
Oil Stocks
Quoting our previous Oil Investment Update:
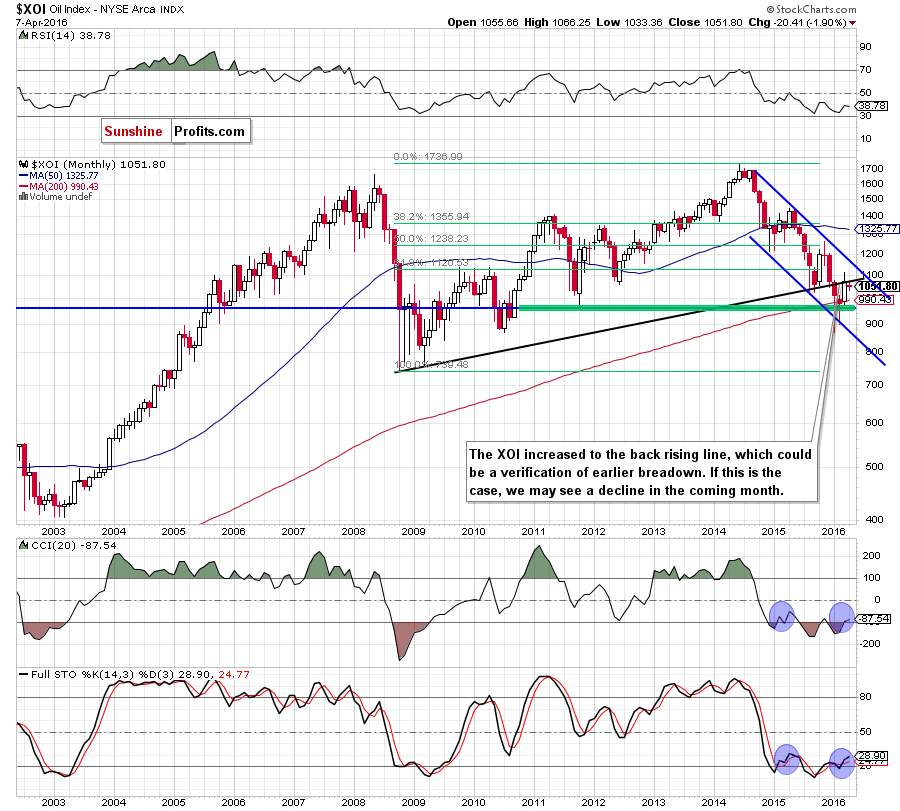
(…) the XOI invalidated earlier breakdown under the previous lows and the 200-month moving average, which suggests further improvement and an increase to the previously-broken black resistance line (…) around 1,070.
Looking at the monthly chart, we see that the situation developed in line with the above scenario and oil stocks almost touched our upside target. Despite this improvement, oil bulls didn’t manage to push the XOI higher, which resulted in a reversal earlier this month. As you see, the index gave up some gains, which suggests that the recent upward move could be just a verification of earlier breakdown under the black resistance line. If this is the case, we may see declines in the coming month and a re-test of the 200-month moving average. At this point, some of you may ask: what about buying signals generated by the CCI and Stochastic Oscillator? As you see on the monthly chart, we saw similar signals at the beginning of Feb 2015. Back then, they didn’t trigger significant upward move and, from today’s point of view, increases between Feb and May were just a correction of earlier downward move. Therefore, in our opinion, they are not reliable enough.
But are there any other factors that could encourage oil bears to act? Let’s examine the weekly chart and find out what can we infer from it.
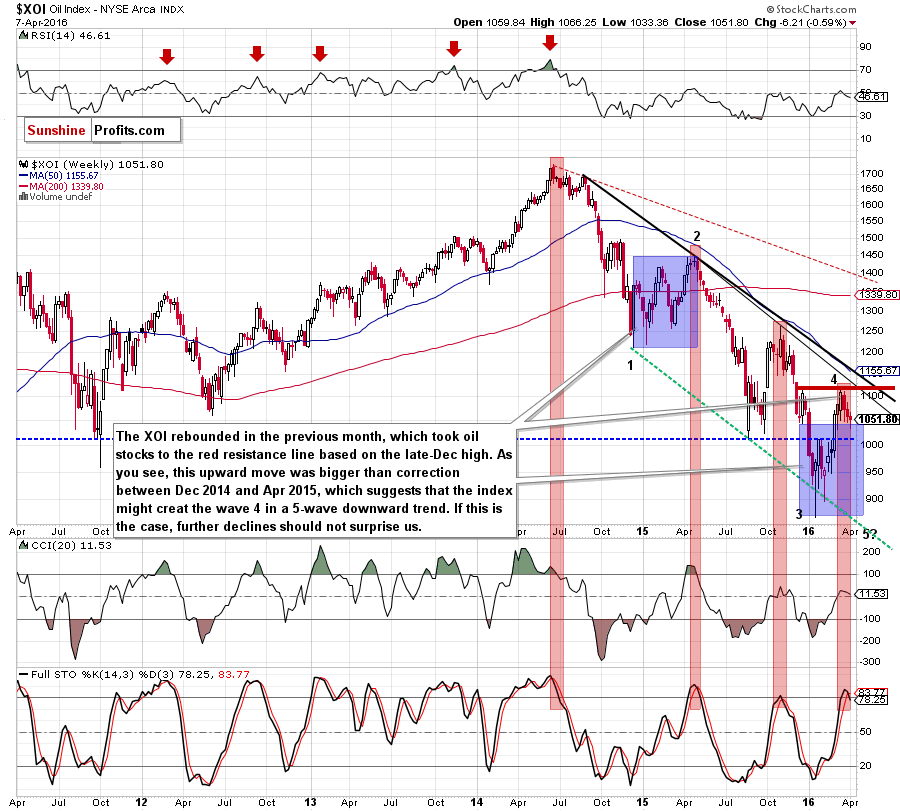
From this perspective, we see that the recent upward move took oil stocks to the red resistance line based on the late-Dec high. As you see it was bigger than correction between Dec 2014 and Apr 2015, which suggests that the index might create a wave 4 in a 5-waves downward trend (according to Elliot’s waves theory). If this is the case, further declines in the coming weeks should not surprise us – especially when we factor in sell signals generated by the Stochastic Oscillator. Is it more reliable than monthly indicator? In our opinion, it is, because all sell signals generated since 2014 preceded sizable downward moves, which increases the probability that we’ll see similar price action later this month.
Will the very short-term picture confirm this scenario? Let’s check the daily chart.
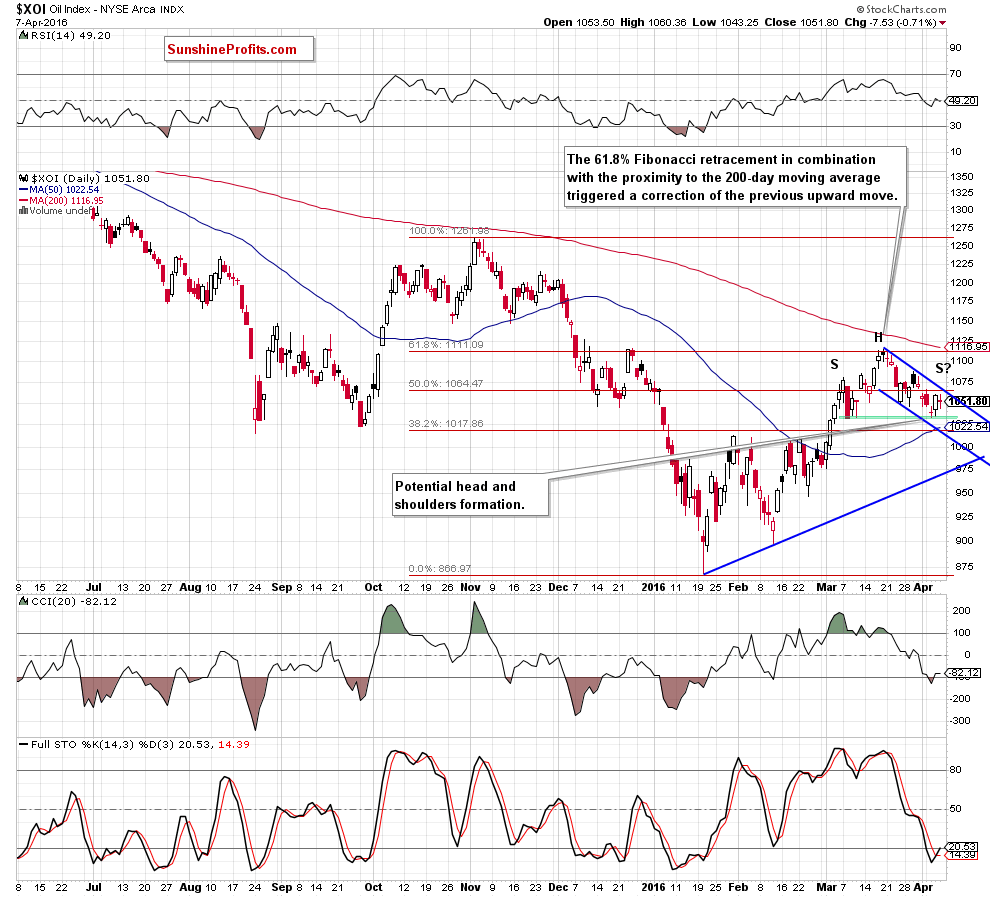
On the very short-term chart, we see that oil stocks rebounded and increased to the 61.8% Fibonacci retracement and the late-Dec high. This resistance zone encouraged oil bears to act, which resulted in a drop to the bottom of the early-March pullback. As you see, this support triggered a rebound in recent days, but despite this improvement, oil stocks remain in the blue declining trend channel. What’s next? When we take a closer look at the chart, we can notice a potential head and shoulders formation. This means that a breakdown under the green zone could result in a drop to around 950, where the size of the move will correspond to the height of the formation (in this area is also the Feb 24 low). Nevertheless, we should keep in mind that the CCI and Stochastic Oscillator generated buy signals, which could encourage oil bulls to act – similarly to what we saw in late-Jan. If this is the case, and the XOI rebounds from here, we’ll likely see a test of the March high and the 200-day moving average in the coming days.
Summing up, oil stocks pulled back to the first support zone, which could trigger a rebound (especially when we factor in buy signals generated by the CCI and Stochastic Oscillator) to the March high and the 200-day moving average in the coming days. Nevertheless, even if we see such improvement, we should keep in mind the long- and medium-term picture, which suggests that further deterioration in the second half of the month is very likely.
Ratio Analysis
Today, we start this section by focusing on the oil-to-oil stocks ratio. What can we infer from the chart below?
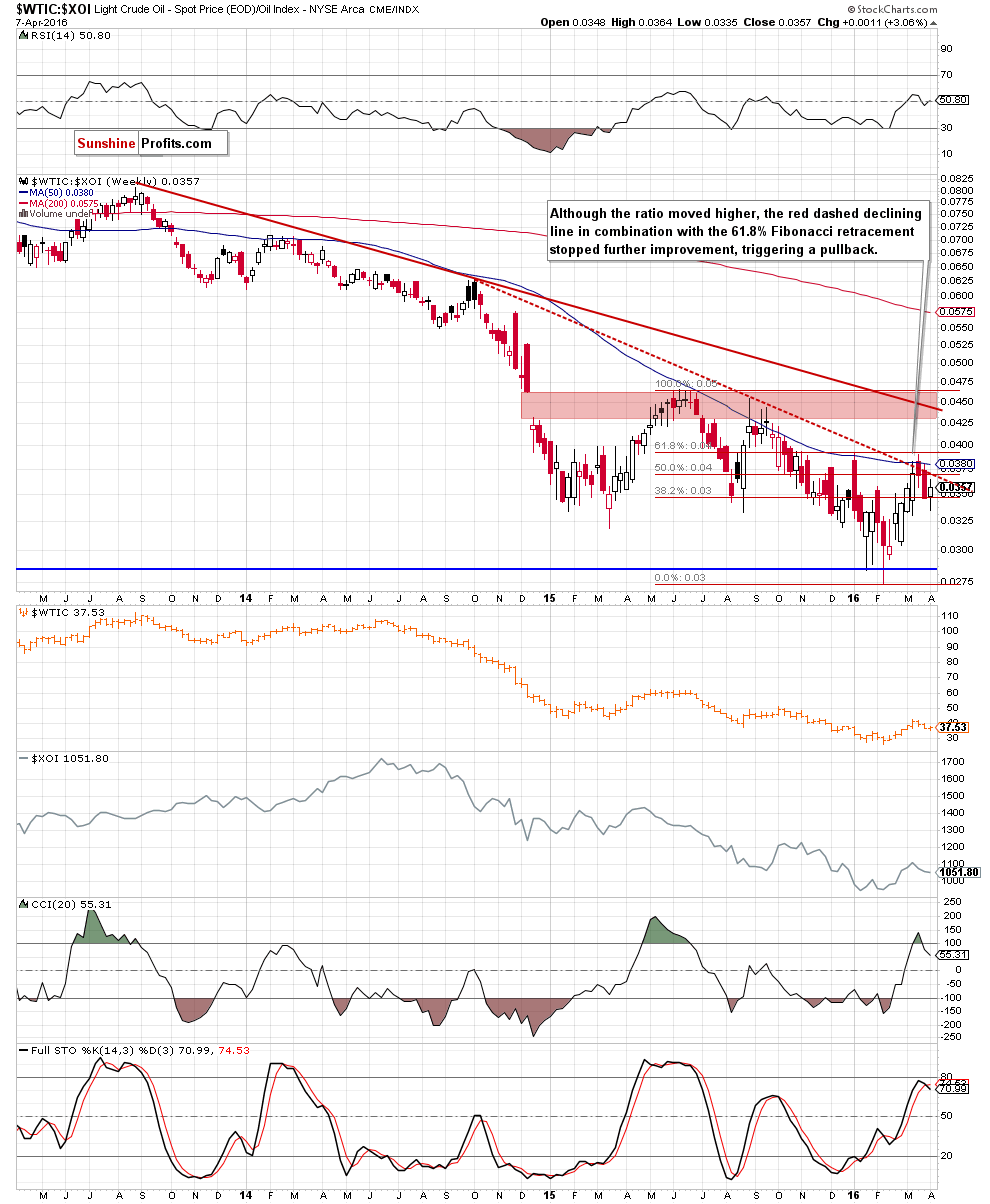
Looking at the above chart, we see that although the ratio moved higher in recent weeks, the red dashed resistance line, in combination with the 61.8% Fibonacci retracement and the 50-week moving average stopped further improvement, triggering a pullback. As you see, the above-mentioned moving average was strong enough to stop bulls many times in the past, which means that as long as the ratio remains below it, lower readings are more likely than not. Additionally, the CCI and Stochastic Oscillator generated sell signals, which suggests that even if the ratio moves higher in the coming days and re-tests recent highs, further deterioration in the second half of the month should not surprise us. If this is the case, and we’ll see such price action crude oil will also reverse and decline in the coming weeks.
Having said the above, let’s analyze the gold-to-oil ratio.
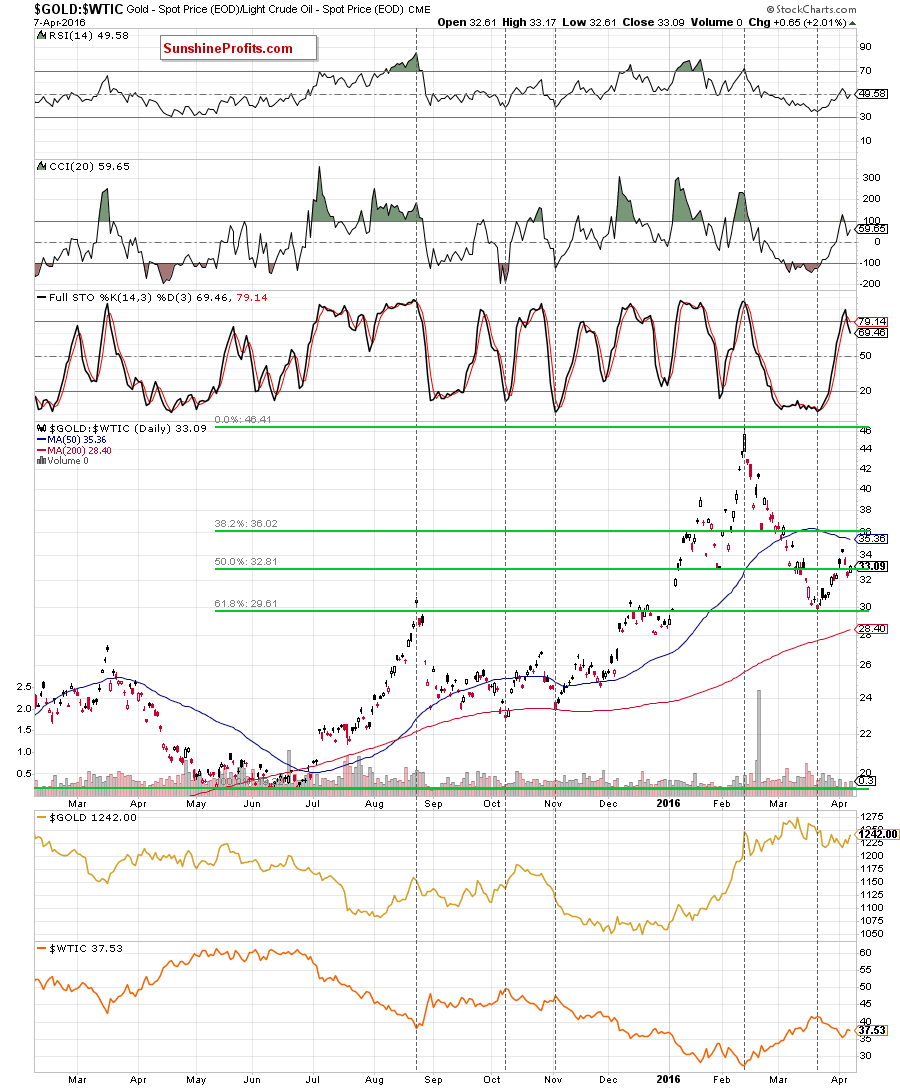
On the daily chart, we see that the ratio declined to 61.8% Fibonacci retracement (based on May-Feb rally) and rebounded. With this upward move, the ratio approached the 50-day moving average, which was enough to trigger a pullback. Additionally, the CCI and Stochastic Oscillator generated sell signals, which suggests further deterioration in the coming days. If this is the case, and the ratio declines from here, we’ll likely see a test of the March low and the Fibonacci retracement. What does it mean for light crude? As you see on the chart, there is a strong negative correlation between the ratio and the commodity, which means that lower values of the ratio will correspond to higher prices of crude oil in the coming days.
But what can we expect in the coming weeks or months? Let’s zoom out our picture and examine the monthly chart.
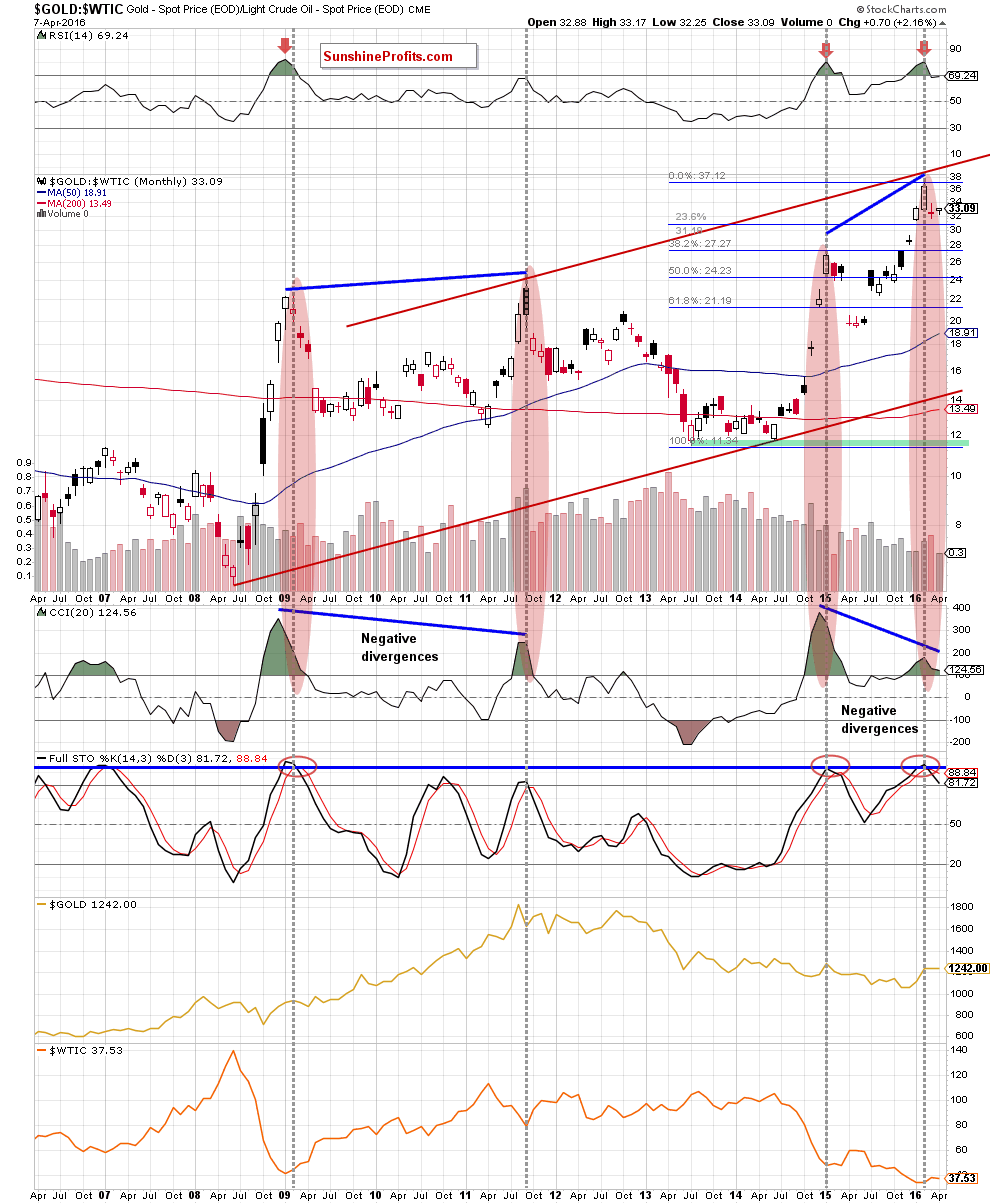
From this perspective, we see that the first things that catch the eye on the long-term chart are strong negative divergences between the CCI and the ratio. Similar situation we saw in Sep 2011, when fresh highs in the ratio didn’t correspond to higher readings of the indicator. As a result, the ratio declined in the following months, which translated into higher prices of crude oil. When we take a closer look at the chart, we see that this negative correlation remains in place as declines between Oct 2012 and Jul 2013, Nov 2013 and Jun 2014, Feb 2015 and May 2015 resulted in upward moves in crude oil. Therefore, in our opinion, if the ratio moves lower once again in the coming months, crude oil will climb to fresh 2016 highs. Why the ratio will likely decline? As you see on the chart, the ratio approached the upper border of the long-term red rising trend channel, which in combination with sell signals generated by the RSI and Stochastic Oscillator suggests further deterioration and a drop to (at least) the first downside target – the 23.6% Fibonacci retracement based on the Jul 2013-Feb 2016 upward move. In this case, if history repeats itself once again, we’ll also see higher prices of light crude.
will the relationsheep between crude oil and silver give us more cluea about future moves? Let’s check the oil-to-silver ratio and find out.
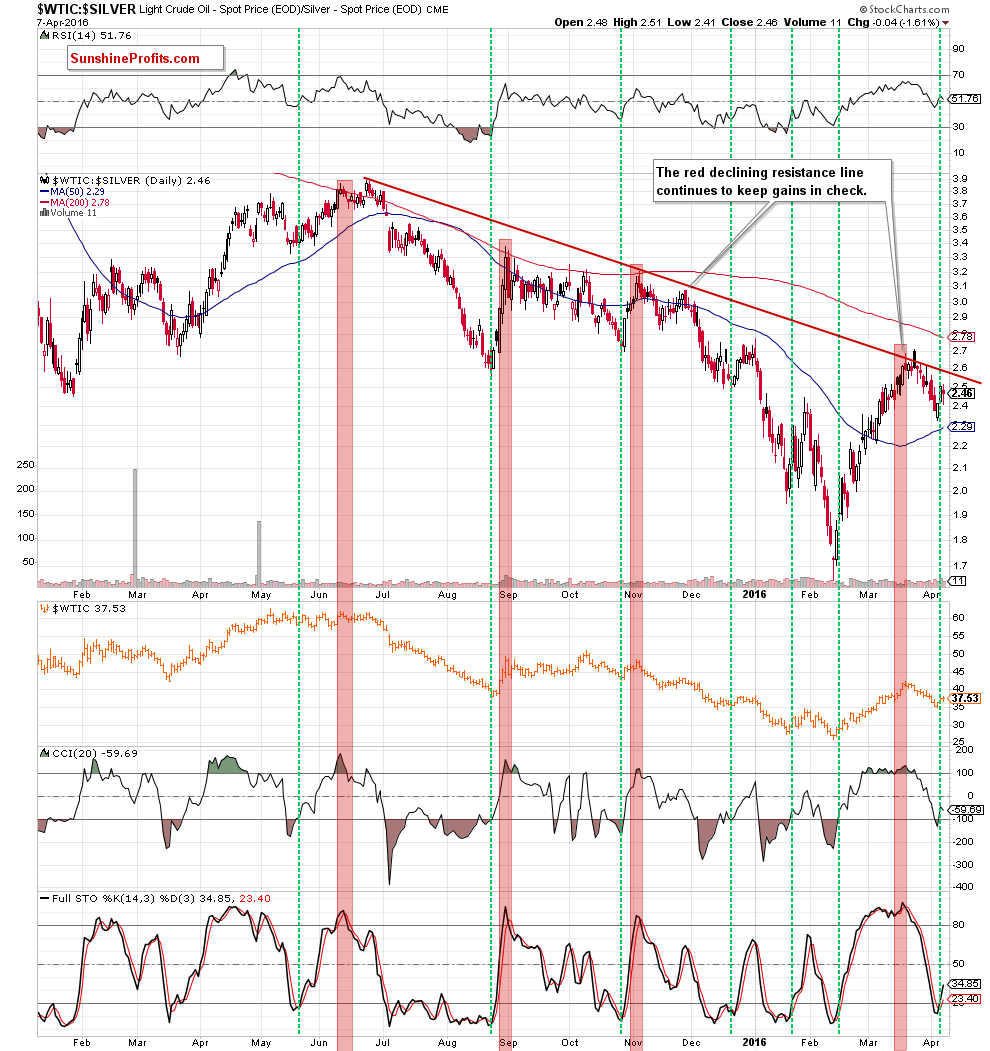
On the above chart, we see that the long-term red declining resistance line continues to keep gains in check. As you see, it was strong enough to trigger pullbacks in Nov and March, which suggests that as long as there won’t be breakout above it further improvement is questionable. Nevertheless, looking at the current position of the indicators, we see that the CCI and Stochastic Oscillator generated buy signals, which could encourage bulls to act in the coming days. At this point, it is worth noting that similar situations in the past (we marked them with green vertical lines) triggered at least bigger rebounds, which suggests that we may see such price action and another re-test of the major resistance line in near future. If bulls do not give up, the ratio could test the March high or even climb to the 200-day moving average. What could happen at the same time with light crude? As you see, there is strong positive correlation between the ratio and the commodity, which means that higher readings of the ratio will translate into higher prices of black gold.
What about precious metals? Taking into account the fact that the recent declines triggered a rebound in gold, it seems that further deterioration in the ratio will support the price of the commodity. Nevertheless, if you want to have a more complete picture of gold (and the precious metal sector) we encourage you to sign up for Gold & Silver Trading Alerts or the All-Inclusive Package that includes it.
Having said the above, let’s focus on the stocks-to-oil ratio. What can we infer from it?
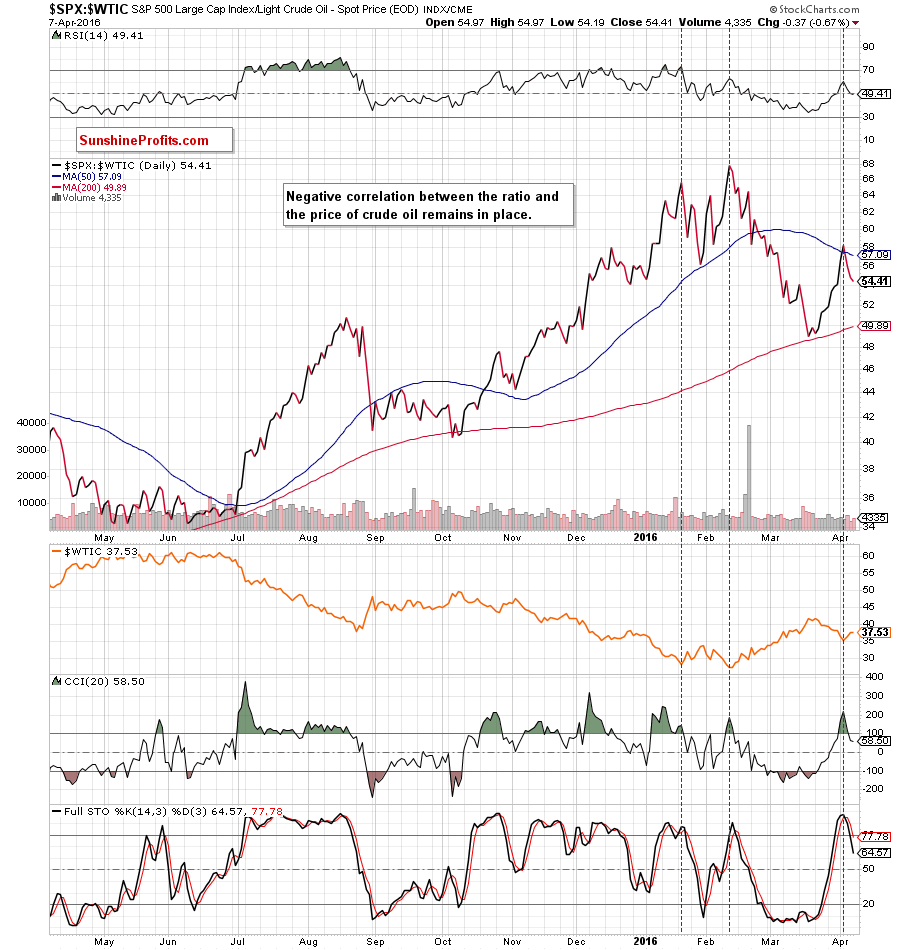
Looking at the daily chart, we see that negative correlation between the ratio and the price of light crude is still in place. Therefore, sell signals generated by the indicators in combination with invalidation of a small breakout above the 50-day moving average suggest further deterioration in the ratio and higher values of crude oil in the coming days.
Nevertheless, to have a broader perspective we decided to examine medium-term chart.
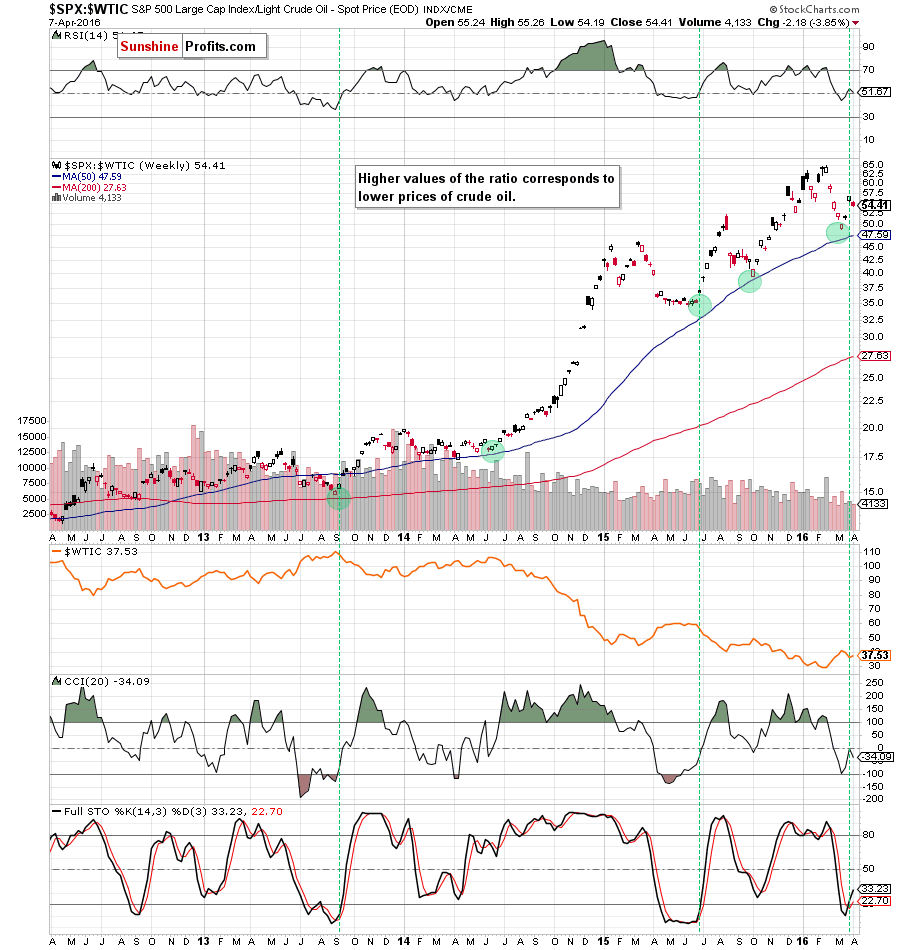
From this perspective, we see that even if the ratio moves lower from the current levels, the space for declines may be limited in the coming weeks by the 50-week moving average. As you see the proximity to this important support was enough to stop further deterioration in Jun 2014, Jun 2015, Oct 2015 and also in mid-March, which suggests that the probability of reversal will significantly increase if the ratio approaches this major support once again. If we see such price action, crude oil will likely change its direction as well.
Non-USD Crude Oil Price
Finishing this month’s Oil Investment Update, we would like to draw your attention to the non-USD (WTIC:UDN ratio) chart of crude oil. As a reminder, UDN is the symbol for the PowerShares DB US Dollar Index Bearish Fund, which moves in the exact opposite direction to the USD Index. Since the USD Index is a weighted average of the dollar's exchange rates with world's most important currencies, the WTIC:UDN ratio displays the value of crude oil priced in "other currencies".
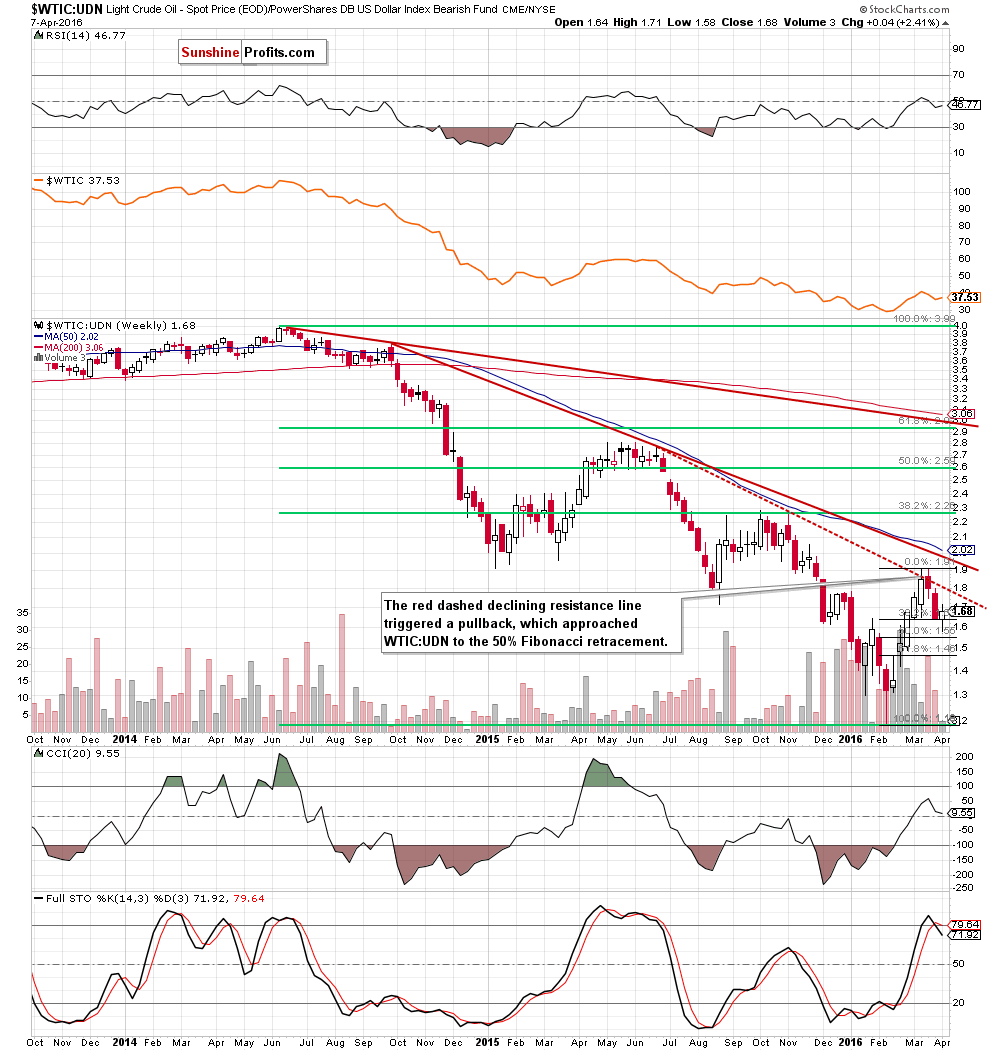
From the medium-term perspective, we see that the red dashed resistance line stopped oil bulls and triggered a pullback, which approached the ratio to the 50% Fibonacci retracement. Despite this drop, WTIC:UDN rebounded, invalidating earlier breakdown under the 38.2% retracement, which suggests another test of the red dashed resistance line in the coming weeks. If oil bulls manage to push the ratio above it, we’ll see an increase to the March high or even to the long-term red declining resistance line (based on Sep 2014 and Jun 2015 highs). Nevertheless, we should keep in mind that the current position of the indicators suggests that the space for gains may be limited and another reversal in the second half of Apr can’t be ruled out.
Scenarios
Just like a month ago, today’s Oil Investment Update includes scenarios of what could happen in the coming weeks. Naturally, we will continue to monitor the market in the coming days and if anything invalidates our long-term outlook we will send you an additional message.
- Bullish scenario
If crude oil increases from the current levels, bouncing off the upper border of the blue declining trend channel, the first upside target would be the psychologically important barrier of $40. If it is broken, light crude will climb to the March high of $42.49. If oil bulls do not give up, we may see further increase to around $45-$45.60, where the resistance zone (created by the 76.4% and 78.6% Fibonacci retracement levels based on the entire Oct-Feb downward move) is. If it is broken, the next upside target would be the Nov high of $48.36 or even the barrier of $50 and Oct high. - Bearish scenario
If the commodity declines from here, the first downside target would be the green support zone (marked on the daily chart) around $34.20-$34.87. If it is broken, oil bears will likely push the commodity to the 61.8% Fibonacci retracement (around $32.30) or even to the barrier of $30, which is currently reinforced by the support zone (created by the 76.4% and 78.6% Fibonacci retracement levels based on the entire Feb-March upward move) around $29.56-$29.93. If this solid support doesn’t stop declines, the next target would be around $27.93 (the 88.6% retracement) or even the Feb low of $26.05.
Summary
In recent weeks crude oil extended gains and climbed above the barrier of $40, reaching the 61.8% Fibonacci retracement (based on the Oct-Feb declines) and approaching the 200-day moving average (similarly to what we saw in Oct). As you saw on charts, combination of these factors triggered a pullback in Apr, which erased around 40% of the previous upward move. What’s next? Taking into account an invalidation of the breakdown under the 38.2% Fibonacci retracement, breakout above the upper border of the blue declining trend channel (seen on the daily chart), invalidation of the breakdown under the lower border of the blue consolidation and the medium-term red declining line (marked on the weekly chart), buy signals generated by the daily indicators (not only in case of crude oil, but also in oil-to-silver) and the current situation in gold-to-oil and stocks-to-oil ratios we think that higher values of light crude are very likely in the coming days. Nevertheless, we should keep in mind that the current position of the weekly indicators (in case of crude oil, the oil-to-oil stocks, stocks-to-oil and WTIC:UDN ratios) suggests that even if light crude increases in the coming days (to the recent high or even to $44.50-$45), the commodity will likely reverse and correct the entire upward move in the coming weeks.
Very short-term outlook: mixed with bullish bias
Short-term outlook: mixed with bullish bias
MT outlook: mixed
LT outlook: mixed
Trading position (our opinion): No positions are justified from the risk/reward perspective. We will keep you informed should anything change, or should we see a confirmation/invalidation of the above.
This completes this month’s Oil Investment Update. Our next Oil Investment Update is scheduled for Friday, May 6, 2016. Oil Trading Alerts subscribers will additionally receive similar but shorter alerts on a daily basis (or more than once a day when the situation requires it). You – Oil Investment Updates subscribers – will receive short Investment Alert messages should the outlook for the medium or long term change before the next Update is posted.
Thank you.
Nadia Simmons
Forex & Oil Trading Strategist
Oil Investment Updates
Oil Trading Alerts

