

In our previous Oil Investment Updates, we wrote about OPEC and non-OPEC producers efforts to maintain the output cuts and how American drillers quite effectively thwart these plans. Since our last update was posted, the U.S. became the world’s no. 2 crude oil producer, beating Saudi Arabia as domestic production climbed above the barrier of 10 million barrels per day. Additionally, if American drillers will continue their activity, the U.S. will replace Russia as the world’s top oil producer later this year.
And speaking of this issue… Friday’s Baker Hughes report showed that U.S. energy companies cut oil rigs for the first time in almost two months (from 800 to 796), but drilling activity remains much higher than a year ago when just 617 rigs were active. Such increase suggests that U.S. crude oil production (which has already risen by over a fifth since mid-2016) will rise even further, putting pressure on the price in the coming weeks/months.
What’s interesting we did not have to wait long for the comment from other producers. On Sunday, Iranian oil minister said that OPEC during its meeting in June could agree to begin easing current production cuts in 2019. Does it mean that another crude oil price war is just around the corner? We have no sure, but it looks like oil bulls won’t have an easy life in the coming months – especially when we factor in the fact that the U.S. dollar dropped to the very important support zone recently. This suggests that we’ll likely see an improvement in the greenback, which will likely make dollar-denominated commodities more expensive for holders of other currencies as inverse relationship between the U.S. currency and light crude remains in the cards.
On top of that, Dutch bank ING said that money managers liquidated over 15,000 long positions in WTI and created over 4,000 new shorts in the previous week, which pushed the price of crude oil lower earlier today.
What does it mean for black gold? In our opinion, oil bulls could have problems with keeping the price not only above $60, but also above the psychological barrier of $50 in the coming weeks. Will the technical picture of the oil market confirm this pro-bearish scenario? Let’s jump into the charts and find out what they can whisper about the future of black gold (charts courtesy of http://stockcharts.com).
Crude Oil
Let’s start today’s Oil Investment Update with the short-term picture of crude oil.
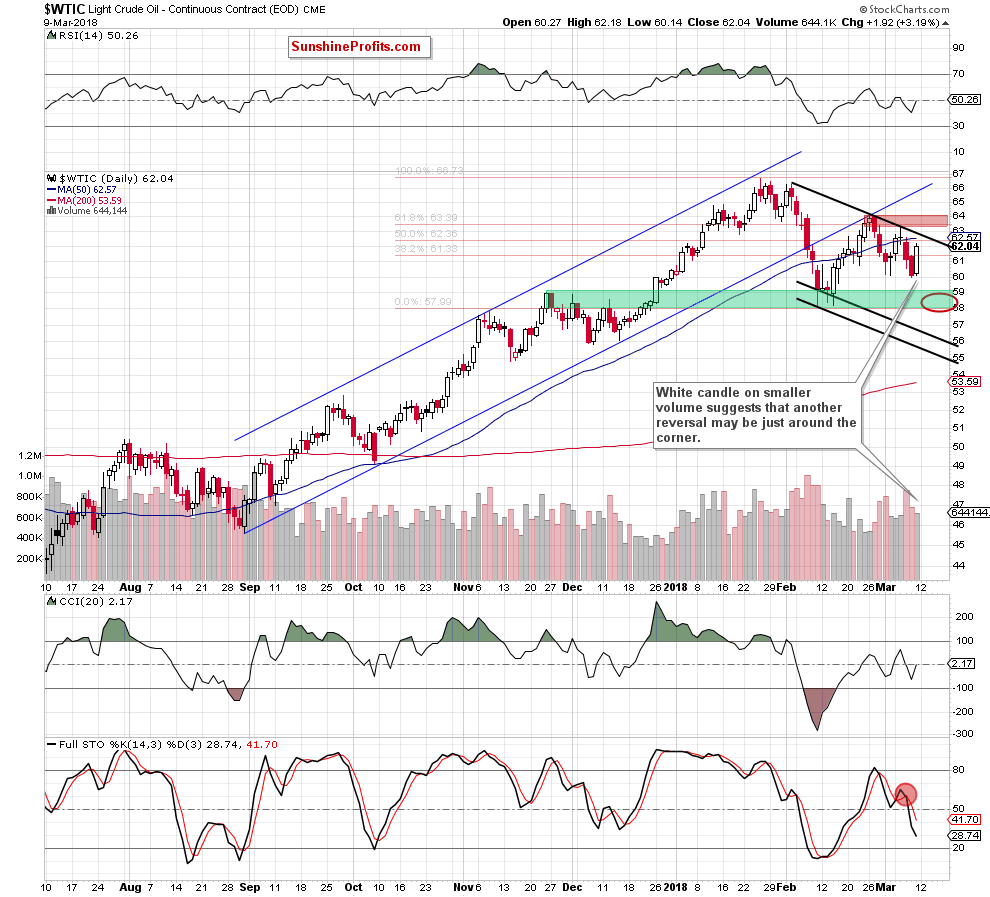
Looking at the daily chart, we see that although crude oil bounced off the barrier of $60 at the beginning of the month, the red resistance zone (created by the black declining resistance line, the 61.8% Fibonacci retracement and the previous peaks) stopped the commodity slightly above $63.
This show of weakness encouraged oil bears to act and resulted in a pullback, which took light crude to the barrier of $60 once again. Although crude oil closed Thursday’s session under the early March lows, oil bears didn’t use this opportunity to push the price higher. Thanks to their weakness, the buyers took control and triggered a quite sharp rebound.
But is this move as positive as it looks at the first sight? In our opinion, it’s not and there are several reasons why we think so.
First, although the commodity increased, it is still trading under the black declining line based on the February highs. As a reminder, this resistance stopped oil bulls at the beginning of the previous week, which means that as long as there is no breakout above it further improvement is not likely to be seen.
Second, light crude remains also under the previously-broken 50-day moving average, which means that the last week’s invalidation of the breakout and its negative impact on the price are still in effect, supporting oil bears.
Third, Friday’s move materialized on visibly lower volume than earlier declines, which suggests that oil bulls may not be as strong as it looks at first glance. At this point it is worth noting that similar situations we saw at the turn of January and February and then at the beginning of March. Back then, the volume levels didn’t grow in line with the price, which was the first clue that the bulls are losing strength.
Fourth, the sell signal generated by the Stochastic Oscillator remains in the cards, indicating that lower prices of black gold are still ahead of us.
Fifth, as we mentioned earlier, the fundamental picture of light crude continues to support oil bears.
Do bulls have any arguments on their side?
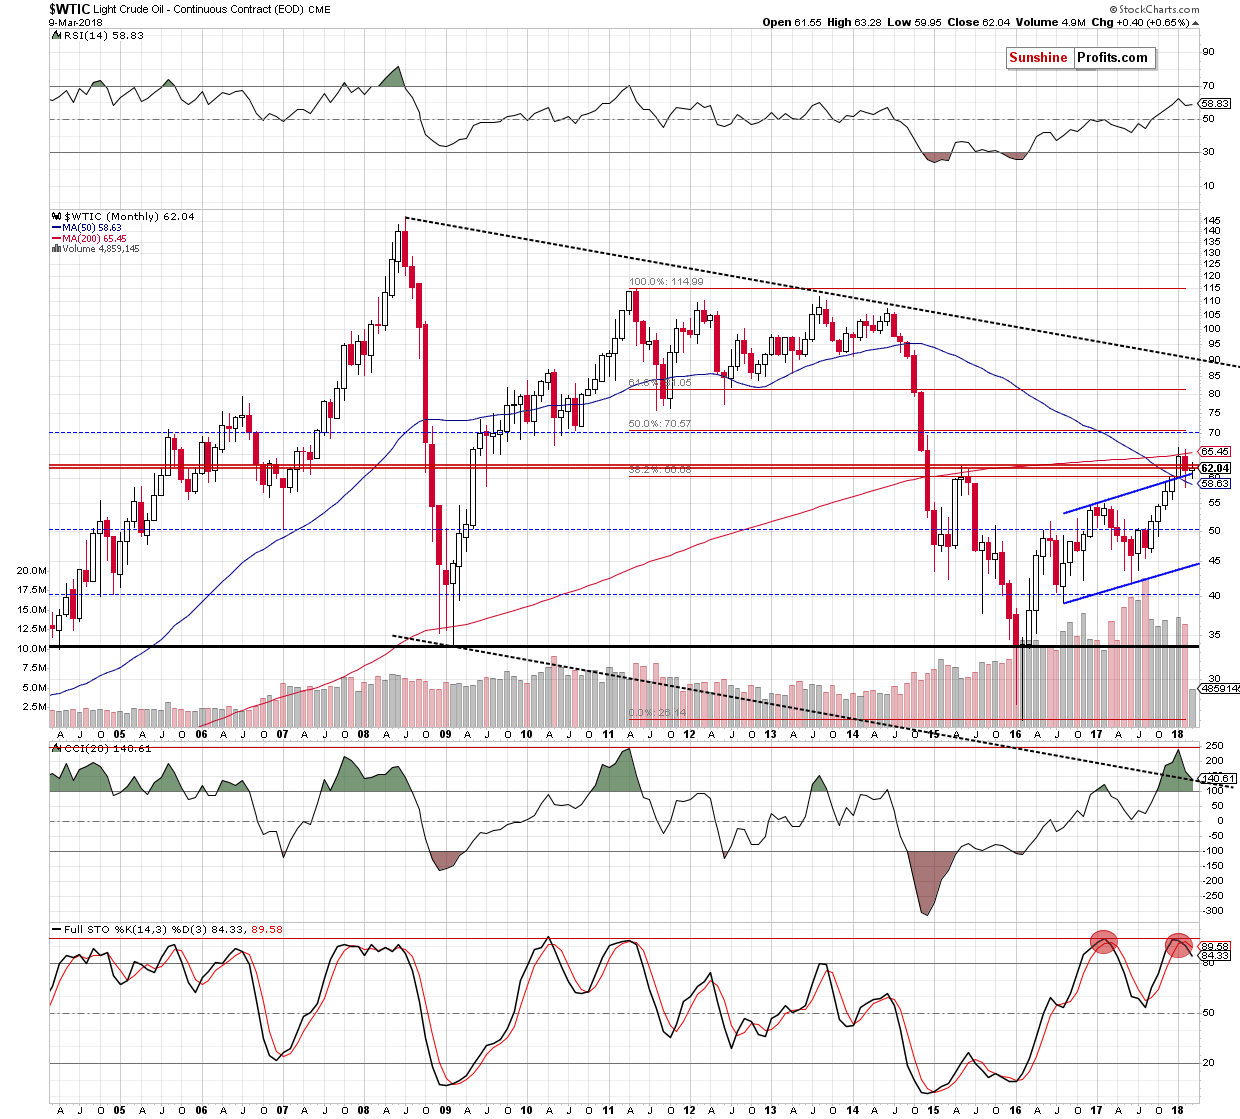
In our opinion, just one – a support from the upper border of the blue rising trend channel. As you see on the monthly chart, the price bounced off it two times this year, which suggests that as long as there is no invalidation of the breakout above this line short-lived moves in both directions should not surprise us.
Nevertheless, we should keep in mind that light crude remains under the May 2015 peak and the 200-month moving average, which means that invalidation of the earlier breakouts and their negative impact on the price are still in effect.
Additionally, the sell signal generated by the Stochastic Oscillator continues to support the bears. At this point, please note that last time when we saw such situation was a year ago. What happened back then? The sell signal preceded a bigger decline, which took crude oil to almost $42 in the following months.
Will black gold test this level in the coming weeks? Before we answer to this question, let’s take a look at the current situation in our ratios to have a more complete picture of the oil market.
Ratio Analysis
Crude Oil – Precious Metals Link
Let’s start this section, checking the relationship between crude oil and gold
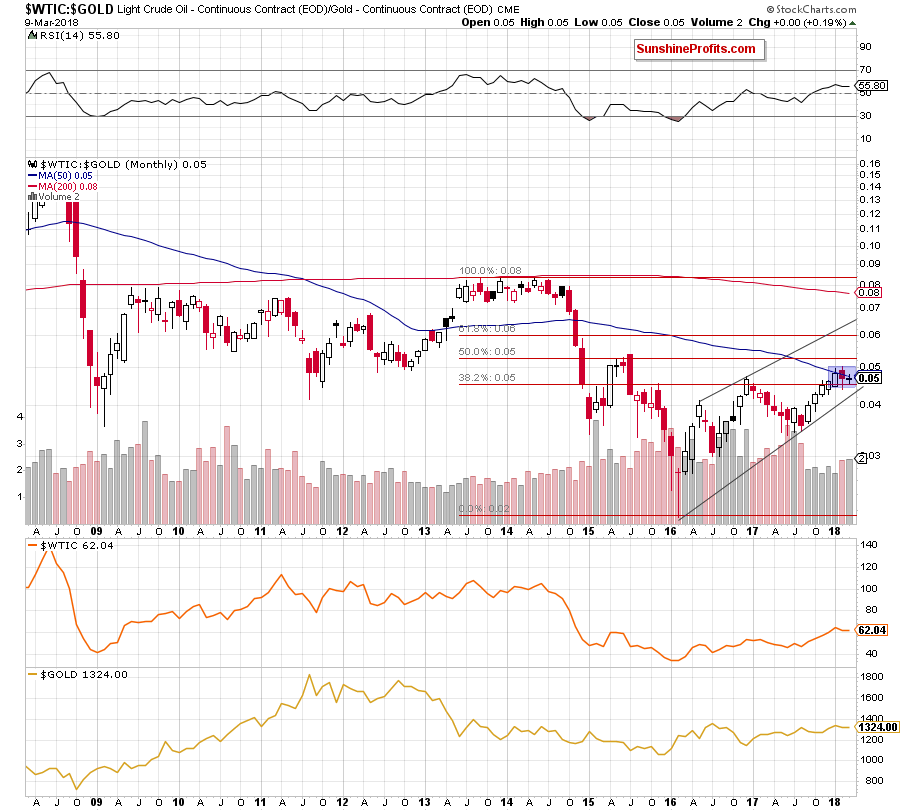
From today’s point of view, we see that the overall situation hasn’t changed much since the beginning of the year. Why? Because the ratio is still trading in a narrow range between the previously-broken 38.2% Fibonacci retracement and the last months’ peaks and the 50-month moving average.
This means that as long as there is no breakout above the upper border of the blue consolidation or a breakdown under the lower line a bigger upswing/downswing is not likely to be seen.
Will the medium-term picture give us any clues about the direction of the next move? Let’s take a closer look at the chart below to find out.
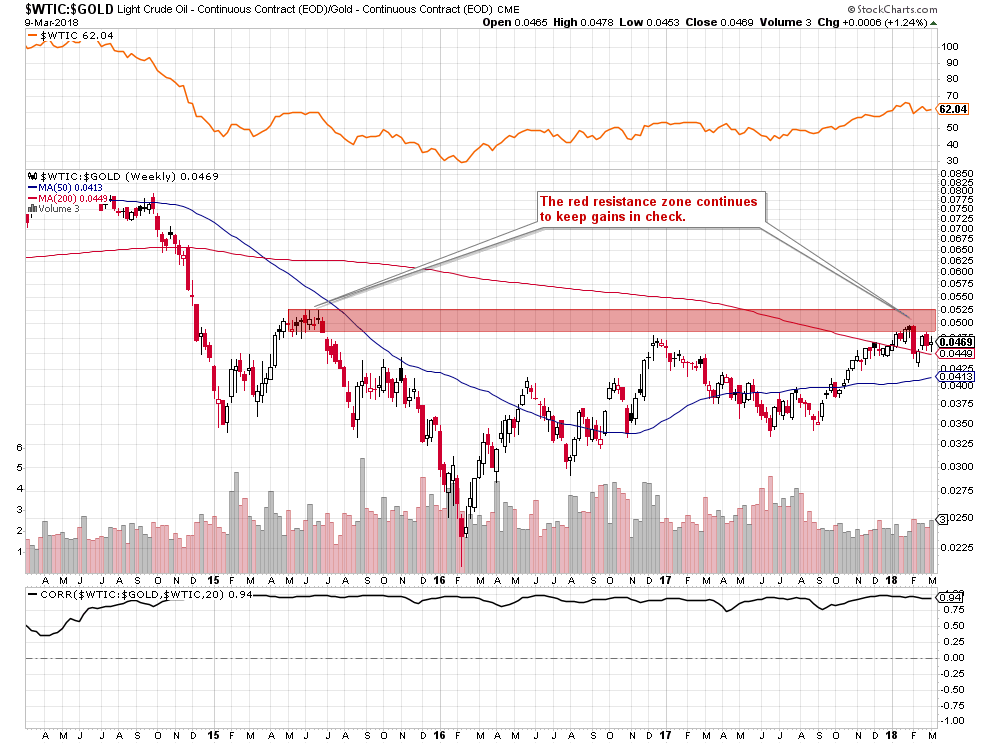
As you see on the weekly chart, the ratio invalidated the earlier breakdown below the 200-week moving average, but despite this improvement, we didn’t see further increases in the following weeks. Instead, the ratio pulled back after a climb to the lower border of the red resistance area, creating a bearish engulfing pattern.
The previous week ended with a doji candle, which suggests some uncertainty among investors. Nevertheless, taking all the above into account, we think that the probability of another downswing is a bit bigger at the moment of writing these words – especially when we factor in the current situation in the oil-to-silver ratio.
Let’s check what the oil – silver link tells us about the next crude oil move.
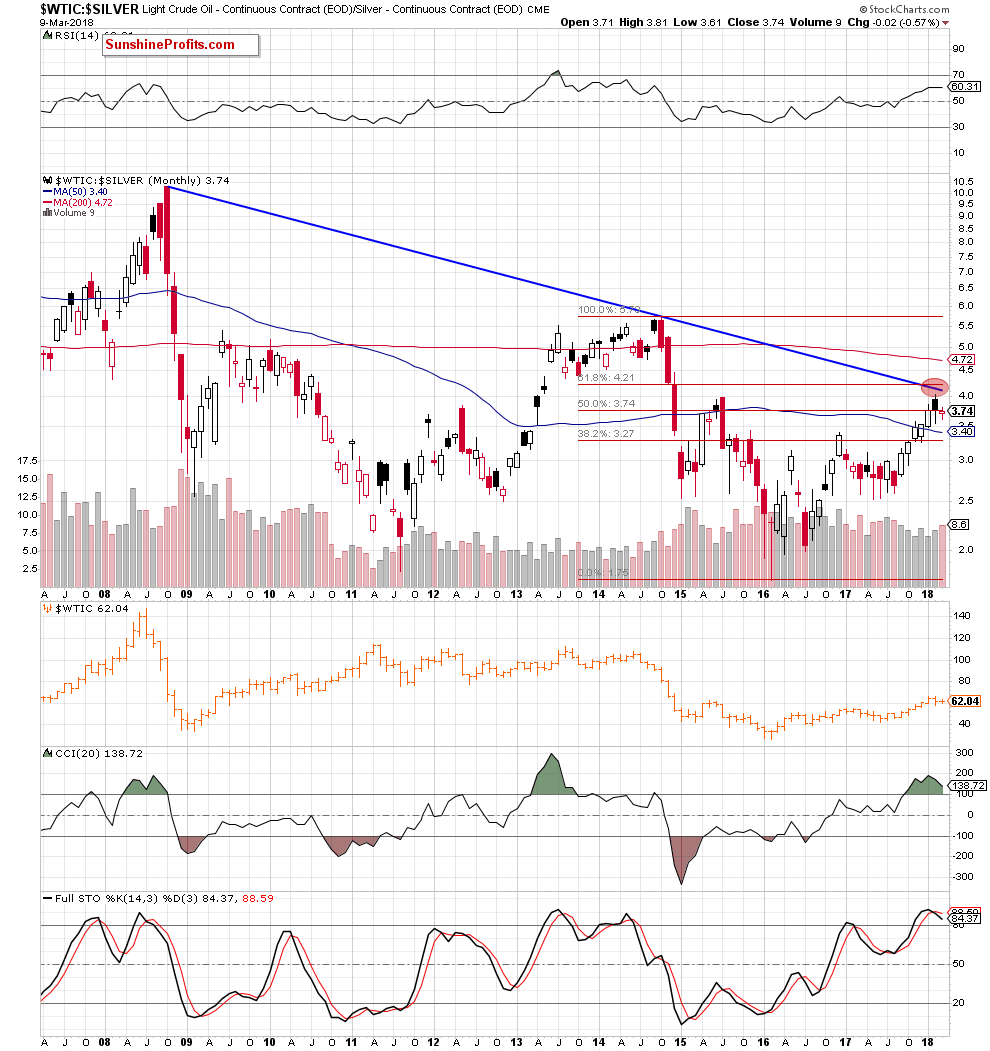
The first thing that catches the eye on the monthly chart is an invalidation of the earlier breakout above the 50% Fibonacci retracement. As you see, the proximity to the long-term blue declining resistance line was enough to trigger a downswing, which resulted in the above-mentioned negative development.
Additionally, the Stochastic Oscillator generated the sell signal for the first time since February 2017, which together with the medium-term chart below doesn’t bode well for higher values of the ratio.
What do we mean by that?
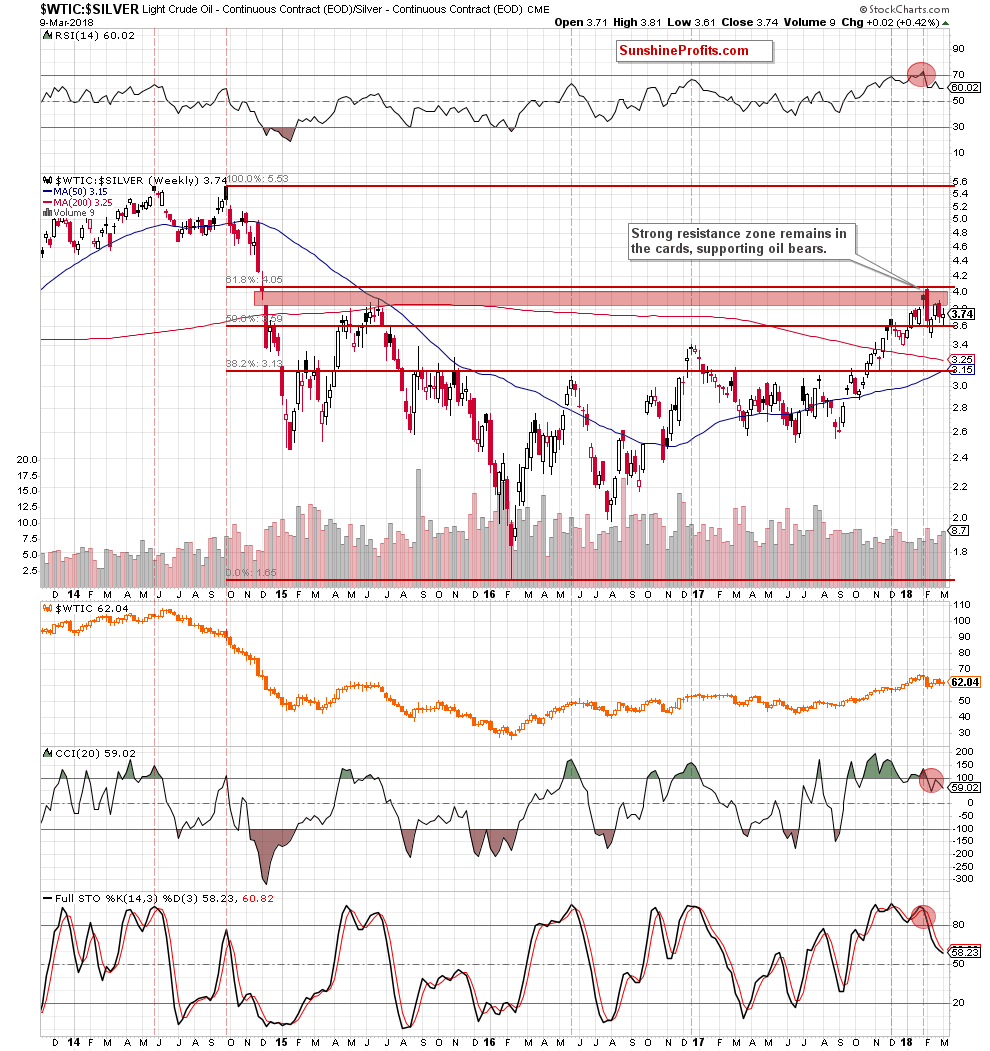
Looking at the above chart, we see that although the ratio extended gains at the beginning of the previous month, the 61.8% Fibonacci retracement in combination with the red gap (created in December 2014, which has served as the major resistance for two years) stopped further improvement. This unsuccessful attempt to go higher resulted in a reversal and a sharp pullback, which took the ratio to the lower retracement.
At this point, it is worth noting that in May and June 2015, the bulls tried to close the red gap and break above it, but all attempts to move higher failed, which resulted in a significant decline if the following months.
As you see, at the end of February, the red zone did its job as a barricade once again, which created the bearish engulfing pattern on the chart. In this way, to road to the north has gained more potholes, which means that as long as there is no breakout above it another attempt to move lower is very likely. This scenario is also reinforced by the sell signals generated by all medium-term indicators.
What does it mean for crude oil? Looking at the above charts, we see that positive correlation between black gold and precious metals remains in the cards. Therefore, we believe that declines in these ratios will affect negatively the price of light crude in the following weeks or even months.
Non-USD Crude Oil Price
Will the current picture of the non-USD (WTIC:UDN ratio) chart of crude oil confirm this pro-bearish scenario? Before we know the answer to this question, please note that UDN is the symbol for the PowerShares DB US Dollar Index Bearish Fund, which moves in the exact opposite direction to the USD Index. Since the USD Index is a weighted average of the dollar's exchange rates with world's most important currencies, the WTIC:UDN ratio displays the value of crude oil priced in "other currencies".
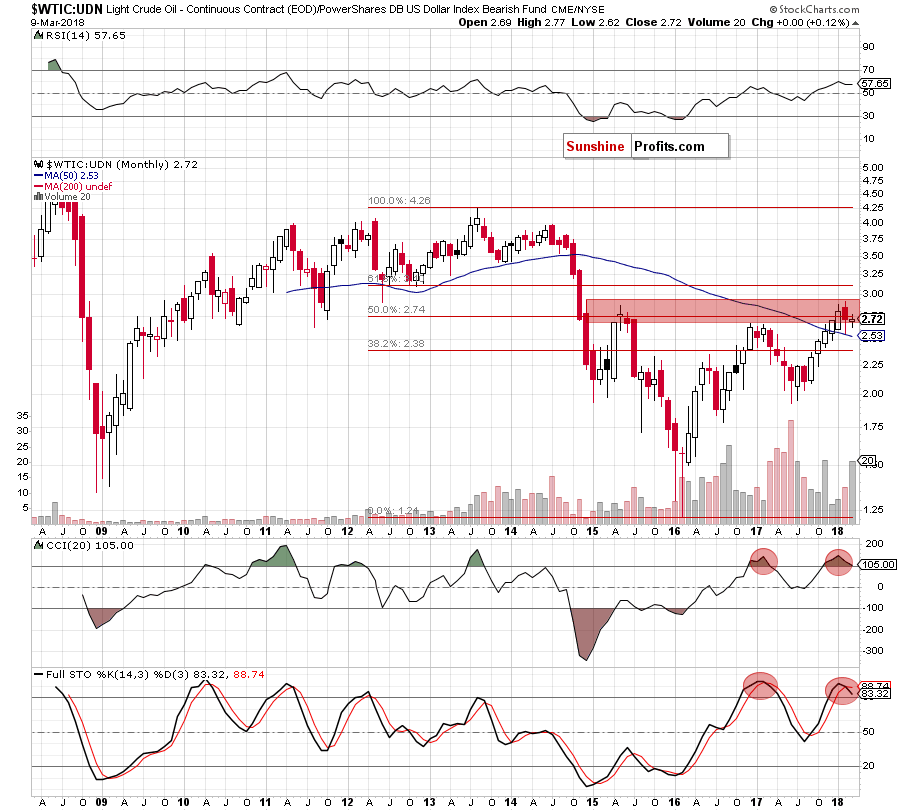
Looking at the long-term chart, we see that, similarly to what we wrote in the case of the oil-to-silver ratio, the value of crude oil priced in "other currencies" moved lower in the previous month. Thanks to this drop, the ratio invalidated the tiny breakout above the May 2015 peak and the earlier breakout above the 50% Fibonacci retracement, which resulted in a test of the previously-broken 50-month moving average.
Although the ratio rebounded slightly, it is still trading under the above-mentioned retracement, which together with the current position of the CCI and the sell signal generated by the Stochastic Oscillator suggest that oil bears have additional reasons to act in the coming month.
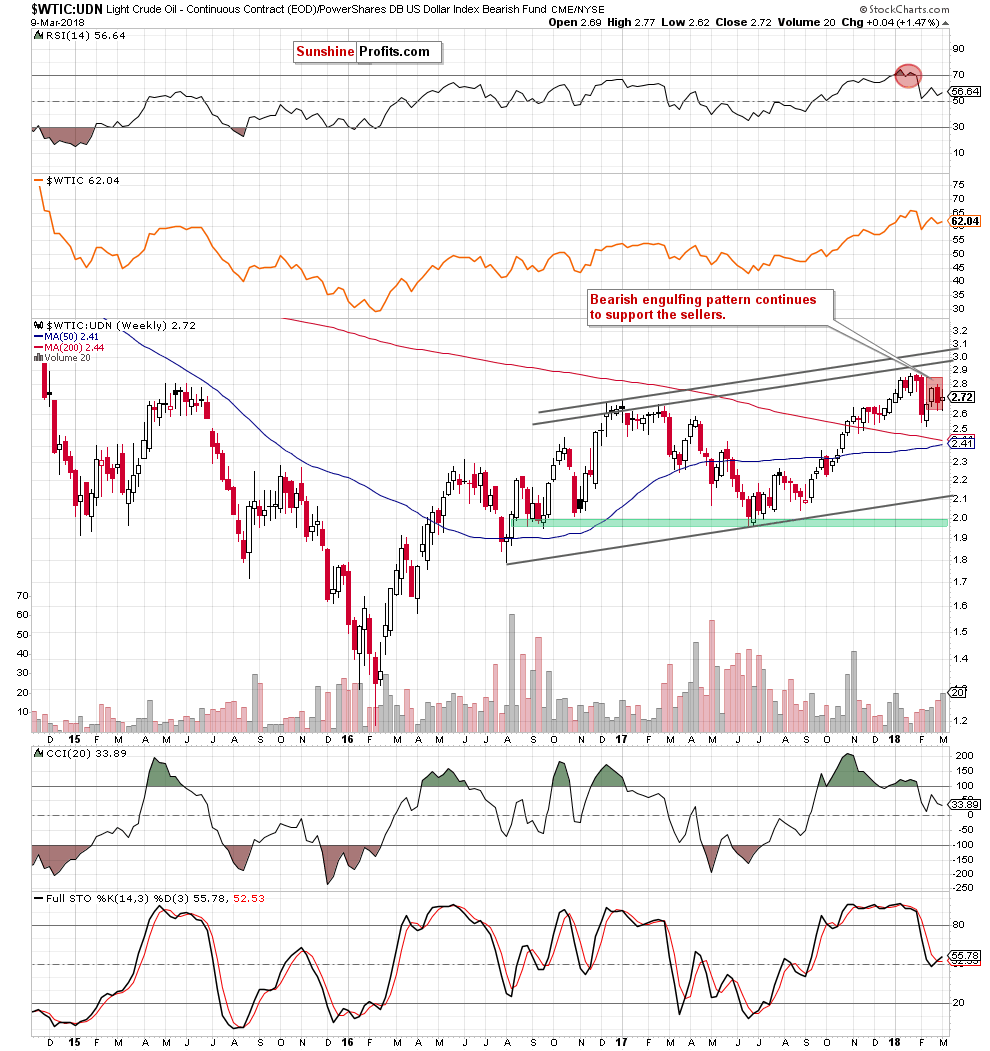
And speaking about the indicators… last time when they were in their overbought areas was a year ago. What happened after they both supported the sellers? The value of the ratio dived in the following month, erasing most of the August – December 2016 upward move, which also have a negative impact on black gold priced in the U.S. dollars.
What does this similarity whisper to us? If history repeats itself once again, we’ll likely see a bigger move to the downside in the months that will come.
On top of that, the pro-bearish scenario is also reinforced by the bearish engulfing pattern marked on the medium-term chart below.
Relationship Between Crude Oil and Oil Stocks
Before we analyze the current situation in oil stocks, let’s take a look at the oil-to-oil stocks ratio.
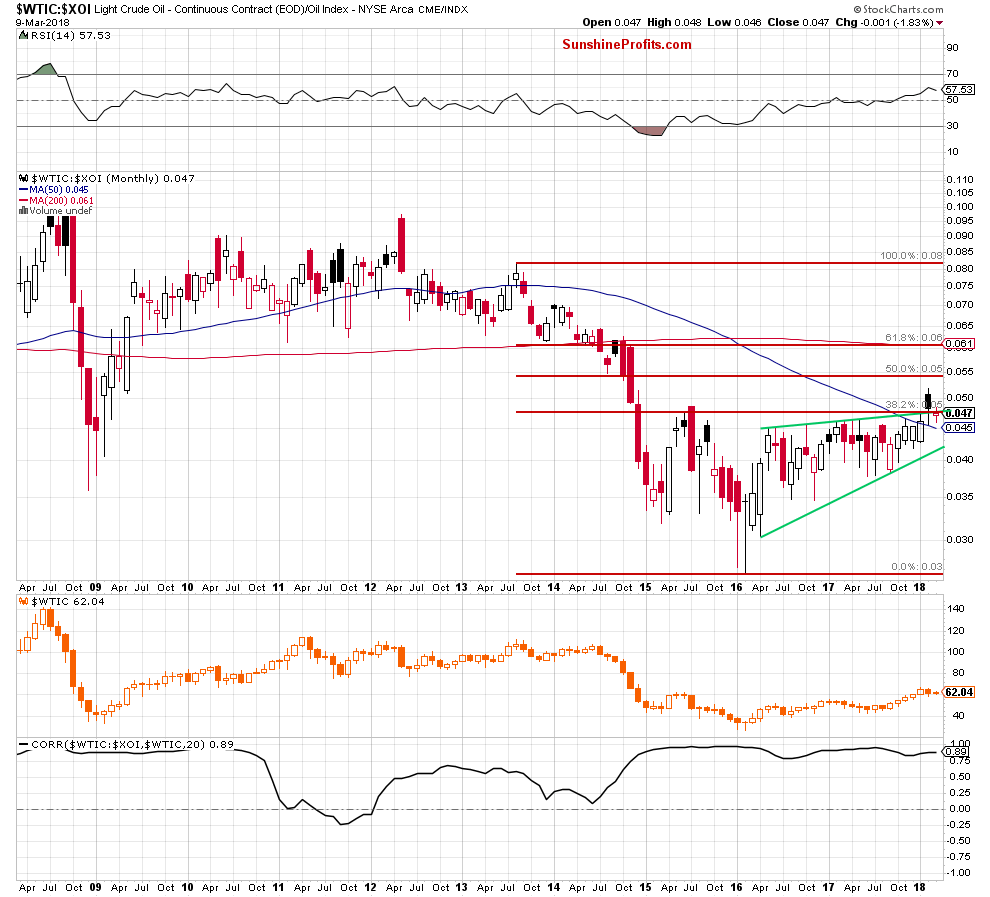
From the monthly perspective, we see that the ratio broke above the upper border of the green rising wedge, the July 2015 high, the 38.2% Fibonacci retracement and the 50-month moving average in the previous month.
Despite these bullish developments, the situation deteriorated quite quickly, and the ratio came back under these levels in March, invalidating the earlier breakouts. Such price action doesn’t look encouraging for bulls and suggests that if they show weakness in this area another move will be to the downside.
How low could the ratio go if the situation develops in line with this assumption?
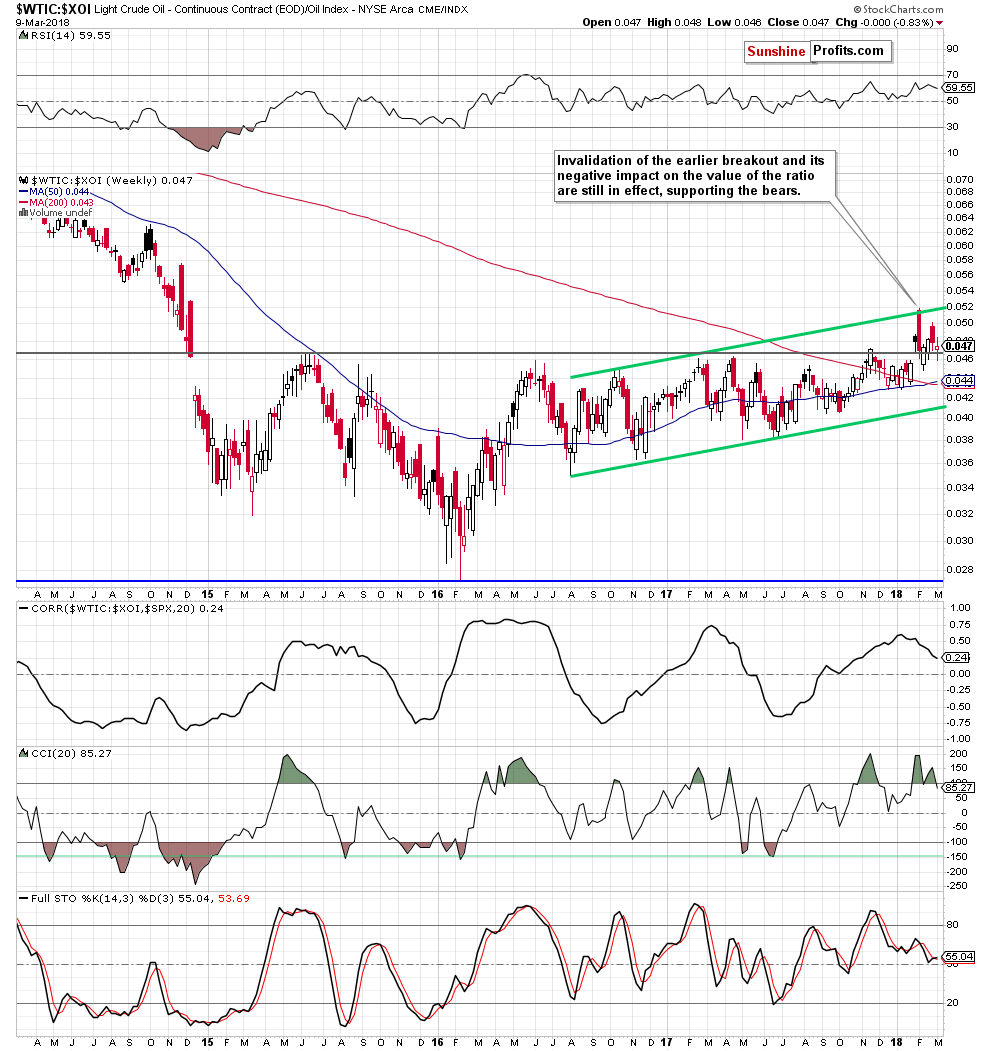
In our opinion, the first downside target will be the support area created by the 50- and 200- weeks moving averages. If it is broken, the ratio will likely test the lower border of the green rising trend channel marked on the weekly chart.
What impact such decline could have on black gold? From today’s point of view, we see that the correlation between the ratio and crude oil itself is not as strong as it was in the past (at least from the medium-term perspective).
Nevertheless, it seems to us that lower values of the ratio will not be neutral to the bears and they will use them in the fight against the bulls in the coming weeks – similarly to what we saw many times in the previous years.
Once we know the current relation between light crude and oil stocks, the time has come to check the current picture of the XOI.
Oil Stocks
In our Oil Investment Update posted in December 2017, we wrote the following:
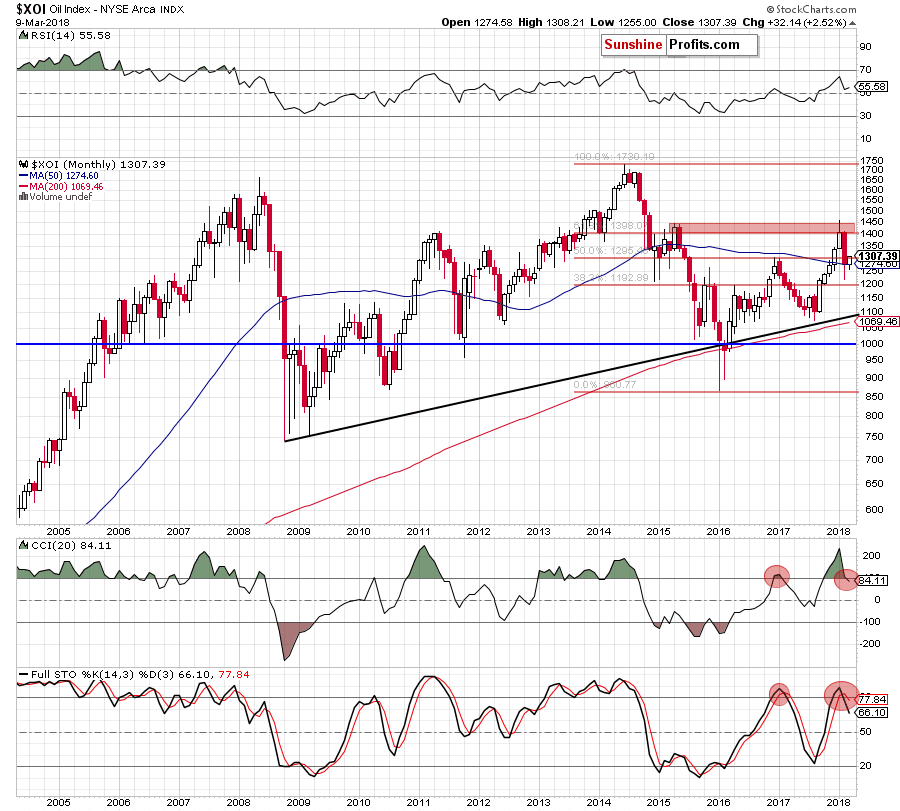
(…) the XOI index extended gains in December, breaking above the 50% Fibonacci retracement, the December 2016 and January 2017 highs and the 50-month moving average. This is a bullish development, which opened the way to the red resistance zone created by the 61.8% Fibonacci retracement, the barrier of 1,400 and the April and May 2015 highs.
Looking at the long-term chart, we see that the situation developed in line with the above scenario and oil stocks not only reached, but also moved slightly above our upside target. Nevertheless, the first thing that caught our attention on the monthly chart was an invalidation of the small breakout above the red resistance zone.
This weakness triggered a sharp decline in February, which translated into the comeback below the barrier of 1,400 about which we warned you in December. Additionally, the CCI and the Stochastic Oscillator generated the sell signals, suggesting that the worst may not be behind oil bulls yet. Why? Because last time when they generated their signals the XOI declined for six consecutive months.
Do bulls have anything to defend themselves? Let’ s zoom in our picture to find out.
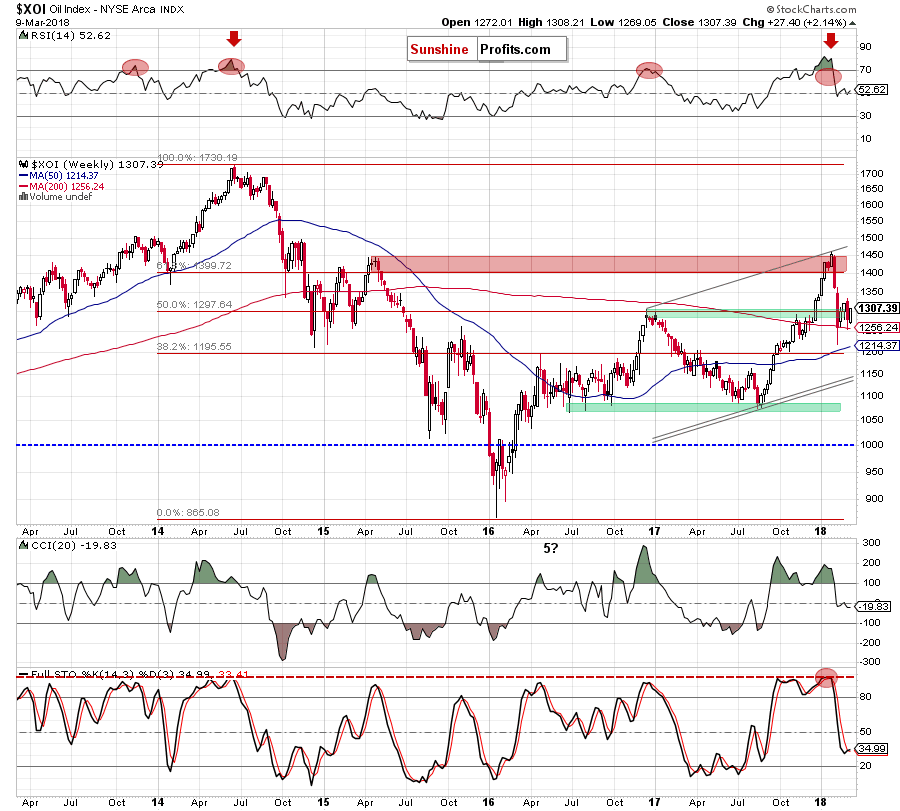
Looking at the weekly chart, we see that the Stochastic Oscillator generated the buy signal, the 200-week moving average continues to keep declines in check and… that’s all positives what we can see here.
Will the daily chart be more favorable for buyers?
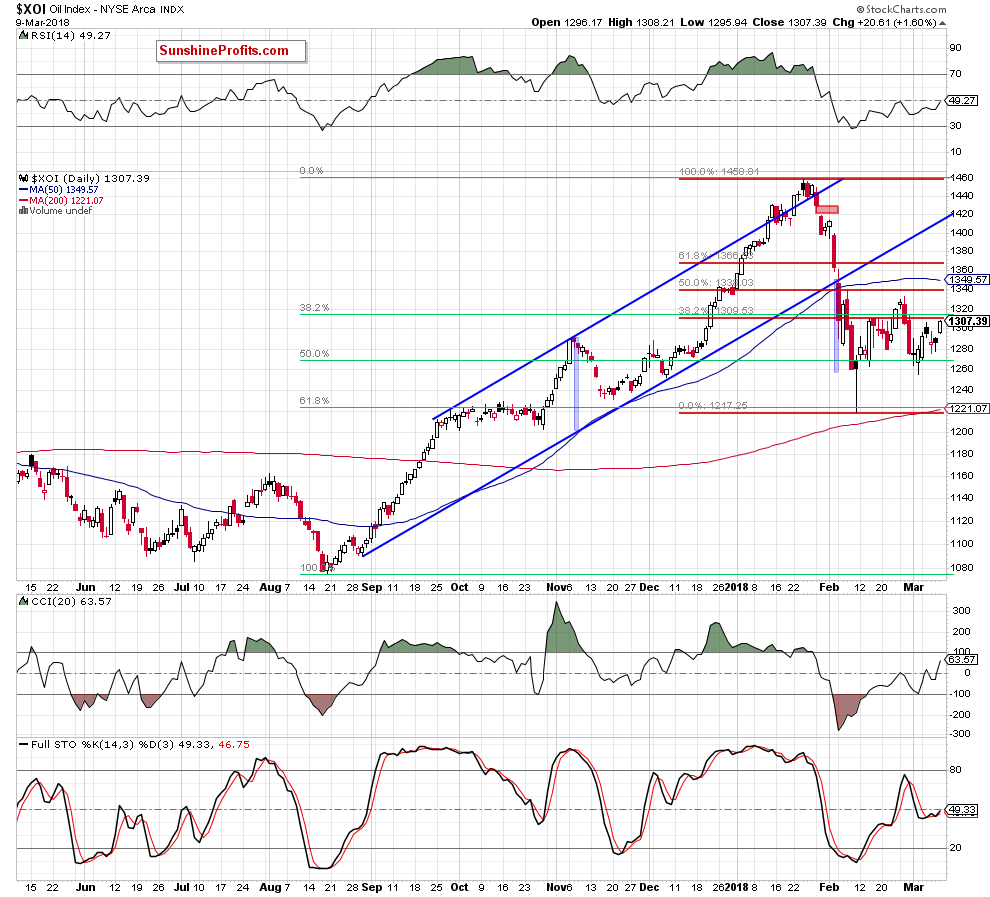
Not exactly. On the very short-term chart, we see that the 61.8% Fibonacci retracement stopped declines in the previous month, but it seems to us that the selling pressure decreased after the size of the downward move corresponded to the height of the blue rising trend channel, satisfying the bears who decided to take profits.
Yesterday, the Stochastic Oscillator generated the buy signal, suggesting another attempt to move higher. Nevertheless, such price action will be more likely and reliable if the XOI breaks above the resistance area created by the late February peak, the 50% Fibonacci retracement (marked with red) and the 50-day moving average. Even if oil stocks climb above these levels they will have to face up with the next Fibonacci retracement. Only after this success will they be able to think about higher levels.
Encouraging? Not really – especially when we factor in the broader perspective.
Summing up, in our opinion, even if the XOI moves a bit higher from current levels, the way to the north is full of obstacles that can discourage bulls to fight in the near future. Additionally, thanks to the decline, which we saw at the end of February, the bears created the bearish engulfing pattern (you can see it on the weekly chart), which will make the way to higher levels even more difficult. Therefore, as long as there is no confirmed breakout above the February 26 peak, higher values of oil stocks are not likely to be seen and high probability of another move to the downside remains in the cards.
Scenarios
Just like a month ago, today’s Oil Investment Update includes scenarios of what could happen in the coming weeks. Naturally, we will continue to monitor the market in the coming days and if anything invalidates our long-term outlook we will send you an additional message.
- Bullish scenario
If crude oil extended gains and breaks above the black declining resistance line based on the previous high (a potential upper border of the black declining trend channel marked on the daily chart), we’ll see a test of the late-February peaks. But if this resistance is broken, black gold will climb to the resistance area created by the 2018 peaks, which is currently intersected by the previously-broken lower border of the blue rising trend channel (around $65.80-$66.66). What could happen if oil bulls break above these levels? In our opinion, the next upside target will be around $70, where the 50% Fibonacci retracement (based on the entire 2011-2016 downward move) is. - Bearish scenario
If the commodity extends losses the first downside target will be February lows around $58. If they are broken, oil bears will likely push the commodity to December or November 2017 lows. If they do not stop declines, the next downside targets will be around $53.50-$53.65, where the April 2017 peaks and the 61.8% Fibonacci retracement are. The next stop will be the barrier of $50.
Summary
Although crude oil bounced off the barrier of $60 in March, the picture of the oil market that emerges from the analyzed ratios doesn’t bode well for oil bulls. As you read several minutes ago, the oil-to-silver ratio invalidated the earlier breakout above the 50% retracement and the bulls failed to close the gap from 2014 once again. The WTIC:UDN ratio came back below the May 2015 peak and 50% Fibonacci retracement, invalidating the earlier climb above these levels. The oil-to-oil stocks ratio invalidated the breakout above the upper line of the rising wedge and the 38.2% retracement. Although the oil-to-gold ratio didn’t invalidate such important levels as the above (the bears only invalidated the breakout above the 50-month moving average), it reached the resistance zone, which continues to keep gains in check since July 2015. Additionally, monthly and/or weekly indicators generated the sell signals, which in combination with the bearish engulfing patterns on all weekly charts and the fundamental factors suggest that dark clouds are gathering over crude oil and the price drop is only a matter of time.
This completes this month’s Oil Investment Update. Our next Oil Investment Update is scheduled for Friday, April 6, 2018. Oil Trading Alerts subscribers will additionally receive similar but shorter alerts on a daily basis (or more than once a day when the situation requires it). You – Oil Investment Updates subscribers – will receive short Investment Alert messages should the outlook for the medium or long-term change before the next Update is posted.
Thank you.
Nadia Simmons
Forex & Oil Trading Strategist
Oil Investment Updates
Oil Trading Alerts

