

The new year, the new month and the new peak – this is how we can summarize in one sentence the first week of January. Last Thursday, crude oil reached the level of $ 62. What so important happened that the price created a new peak in the previous week?
The major factor, which triggered a bigger upswing was concern that civil unrest in Iran could lead to supply disruption. As a result, black gold bounced off the upper border of the previously-broken upper border of the rising trend channel and approached the level of $62. Was there really anything to be afraid of? Let’s be honest, we have seen geopolitical tensions many times in the past and most of them didn’t influence production as much as one previously thought.
As a reminder - go back to the news from the beginning of November when police arrested 49 people including 11 princes, four ministers and tens of former ministers in an anti-corruption crackdown. That situation, instead of affecting production, strengthened Saudi Arabia's Crown Prince Mohammed bin Salman power. What happened back then with the price of crude oil? We noticed a one-day sharp upswing, which pushed the commodity above the upper border of the upper rising trend channel (on November 6, 2017). However, in the following days, after a fresh high, light crude reversed and declined, which resulted in a test of the early 2017 peaks. Sounds familiar? Will history repeat itself once again and we will see declines in the coming weeks? In our opinion, it’s very likely, but this pro bearish scenario may be broken by another drop in crude oil stocks.
And speaking of this… the last EIA weekly report showed that crude oil inventories fell for the seventh-straight week. Additionally, they fell more than estimated. “Terrific news! Let's push the price of crude oil to a fresh peak” – the bulls thought quickly and “the action” took place. Unfortunately, investors who acted emotionally and opened long positions that day quite quickly understood that they had fallen into a trap. Why? They realized what had happened with the crude oil product inventories.
Gasoline inventories rose by 4.8 million barrels (well above expectations for a rise of 2 million barrels) and supplies of distillates rose by 8.9 million barrels, easily missing expectations for a rise of 500,000 barrels. On top of that, U.S. crude oil production jumped by 28,000 barrels a day, returning on its way to beat the level of 10 million barrels per day. What’s interesting, it happened despite the fact that the Enchilada platform fire halted some Gulf of Mexico production, which, in our opinion, doesn’t bode well for the price of black gold in the coming weeks.
Considering all the above-mentioned fundamental turmoil, let's focus on what the charts tell us (charts courtesy of http://stockcharts.com).
Crude Oil
Let’s start today’s Oil Investment Update with the short-term picture of crude oil.
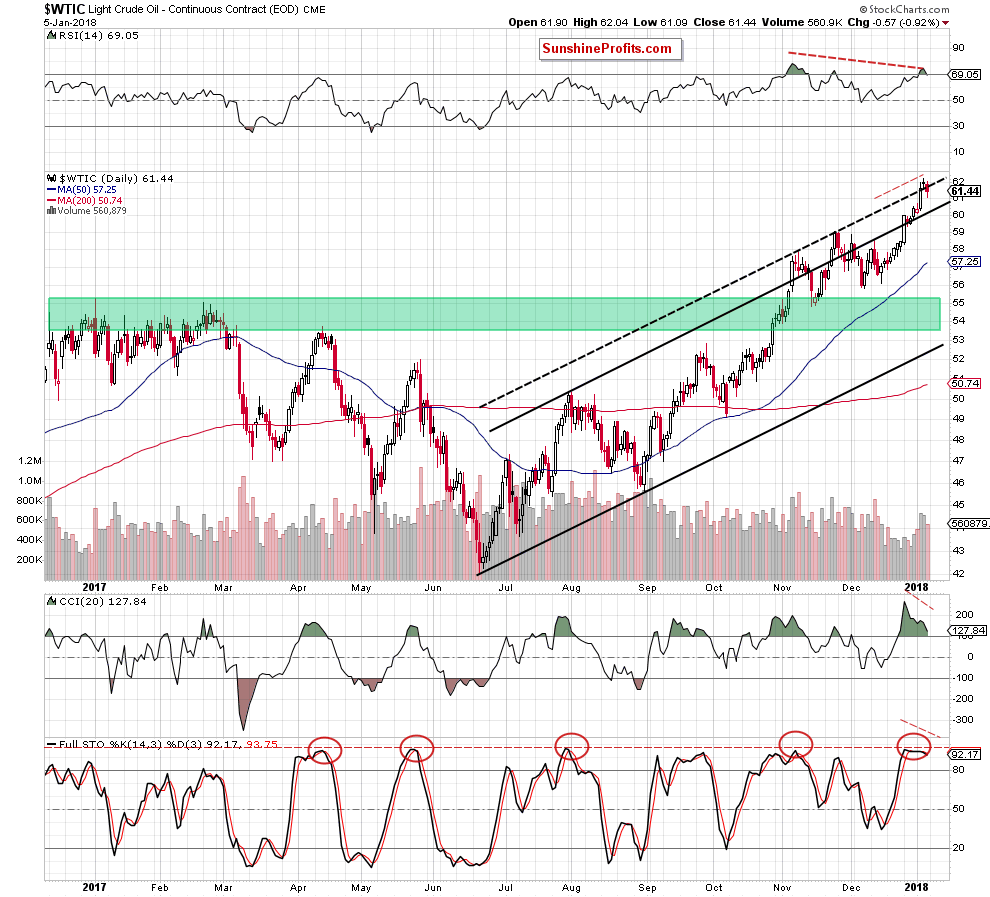
Looking at the daily chart, we see that crude oil increased to $62.21 on Thursday, climbing to the highest level since May 2015. Despite this improvement, oil bulls didn’t manage to hold gained levels, which resulted in a pullback and a doji candlestick. This meant that the buyers' and sellers' forces leveled out during that session. In our opinion, it was the first timid sign, which suggested that reversal could be just around the corner – especially when we factored in the proximity to the 2015 highs, which continued to block the way to the north (we wrote about it in our Friday’s Oil Trading Alert).
From today’s point of view, we see that the situation developed in line with our assumptions and crude oil declined on Friday after an “increase” to the daily peak of $62.04 (only 14 cents above the opening price). This show of oil bulls’ weakness encouraged their opponents to act, which resulted in further deterioration and a drop below the black dashed line. In this way black gold invalidated the earlier breakout, which suggests that we may see further declines in the coming week.
This scenario is also reinforced by clearly visible bearish divergences between the commodity and all daily indicators marked on the above chart. Additionally, the RSI and the Stochastic Oscillator generated the sell signals (while the CCI is very close to doing the same in the very near future), increasing the probability of lower prices of light crude.
On top of that, as we mentioned earlier, the May 2015 continues to block the way to higher levels. We realize that this is not the strongest resistance at this moment, but many technical details suggest that space for growth is limited. What do we mean? Let’s take a look at the long-term chart below and our ratios’ charts even lower.
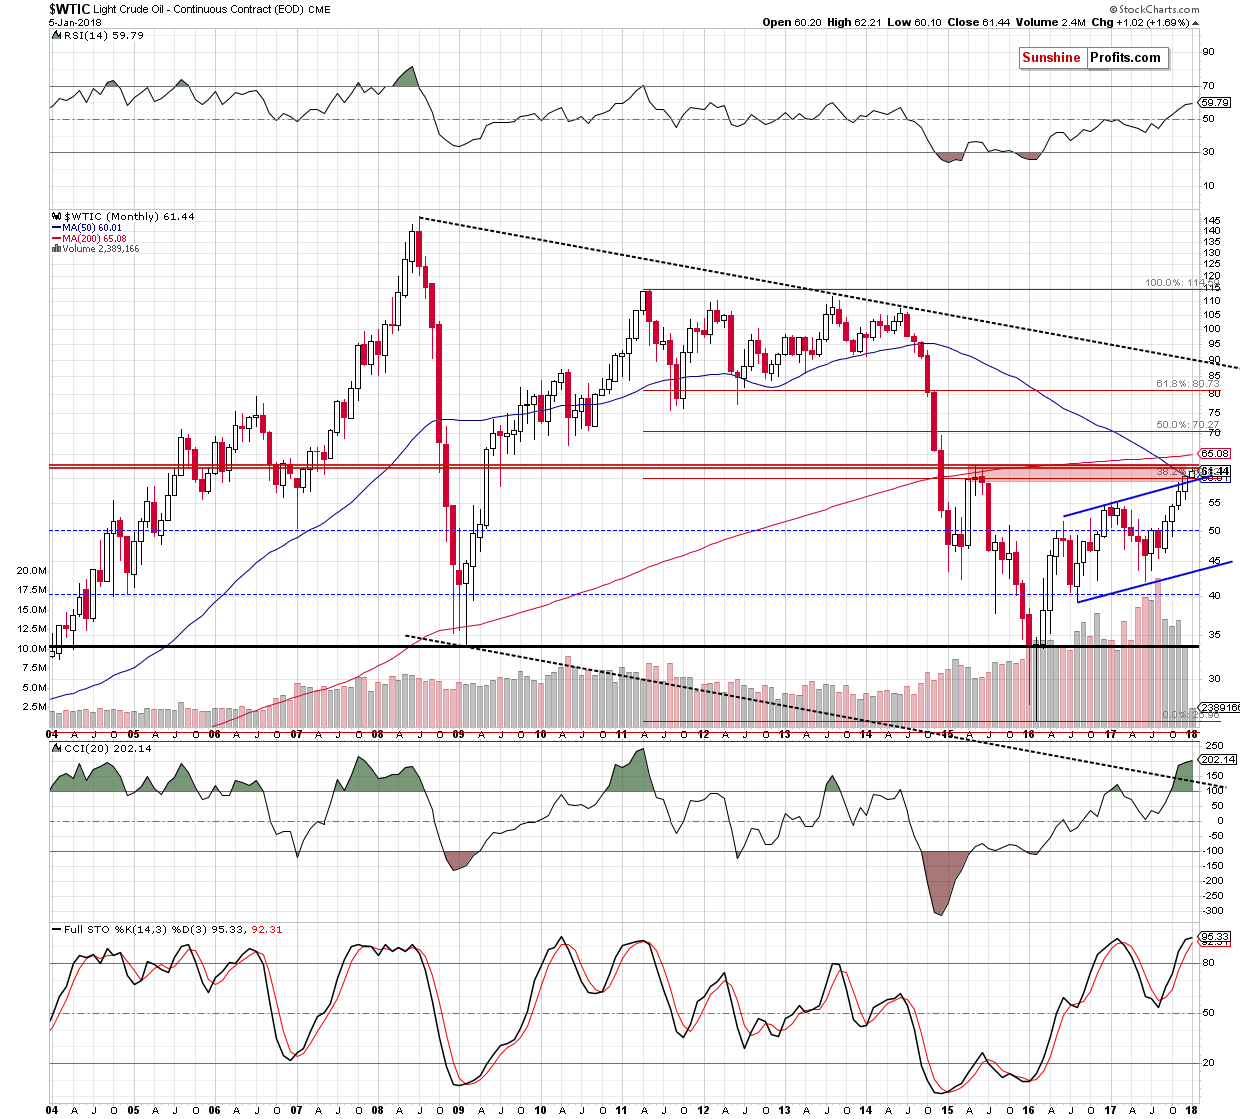
Looking at the monthly chart, we see that volume, which accompanied December increase was visibly smaller than in the previous months, which suggests that oil bulls’ strength may not be as big as it may seem at the first sight.
Additionally, the CCI and the Stochastic Oscillator climbed to their highest levels since April 2011 and there is a bearish divergence between the latter indicator and the price of crude oil, which increase the probability of reversal in near future. As a reminder, the April 2011 peak preceded the first wave of sizable declines in the following months.
On top of that, please keep in mind what we wrote about the medium-term RSI in December:
(…) the RSI climbed above the level of 70 only 3 times through the last 10 years. Such high reading of the indicator preceded the 2008 crude oil all time high and the May 2011 peak. In both these cases, we saw sizable declines in the following weeks, which suggests that history may repeat itself once again (…)
Having said the above, lets examine the current situation in the ratios.
Ratio Analysis
Let’s start this section, checking the relationship between crude oil and precious metals.
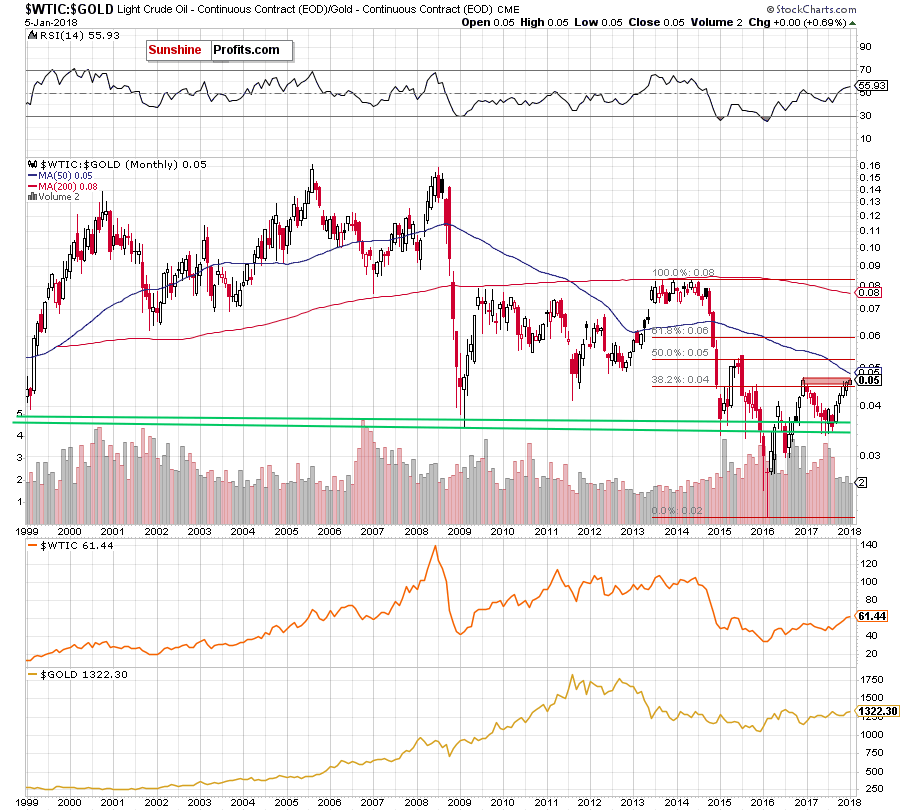
From today’s point of view, we see that although oil-to-gold ratio increased earlier this month, it is still trading inside the red resistance zone below the December 2016 high and the 50-month moving average. This suggests that as long as there is no breakout above these resistances a reversal and declines are very likely – especially when we consider the medium-term picture.
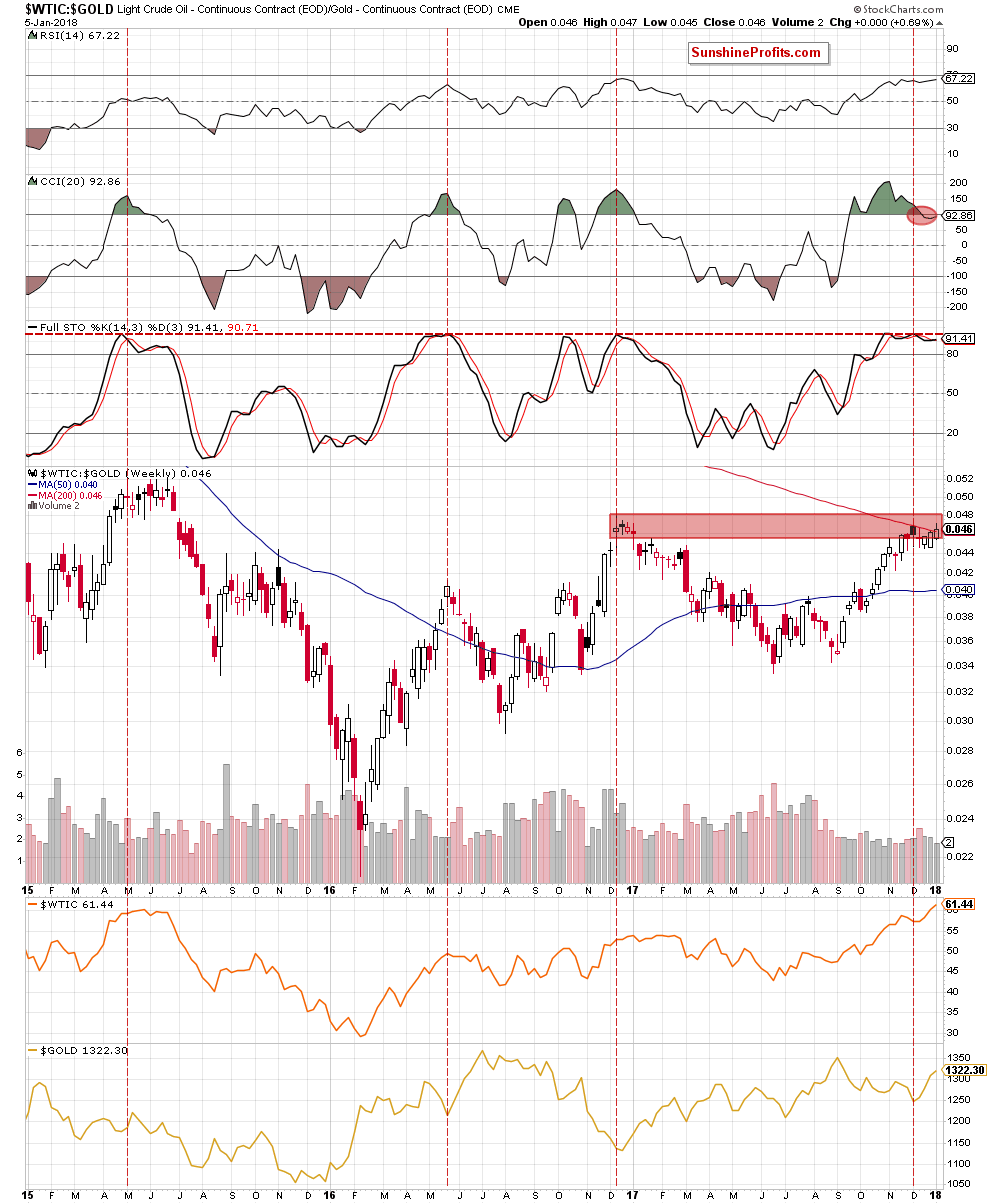
As you see on the weekly chart, the ratio invalidated the tiny breakout above the 200-week moving average, which together with the sell signal generated by the CCI and bearish divergence between the Stochastic Oscillator and the ratio increase the likelihood of reversal in the coming week(s).
The pro bearish scenario is also reinforced by the oil-to-silver ratio.
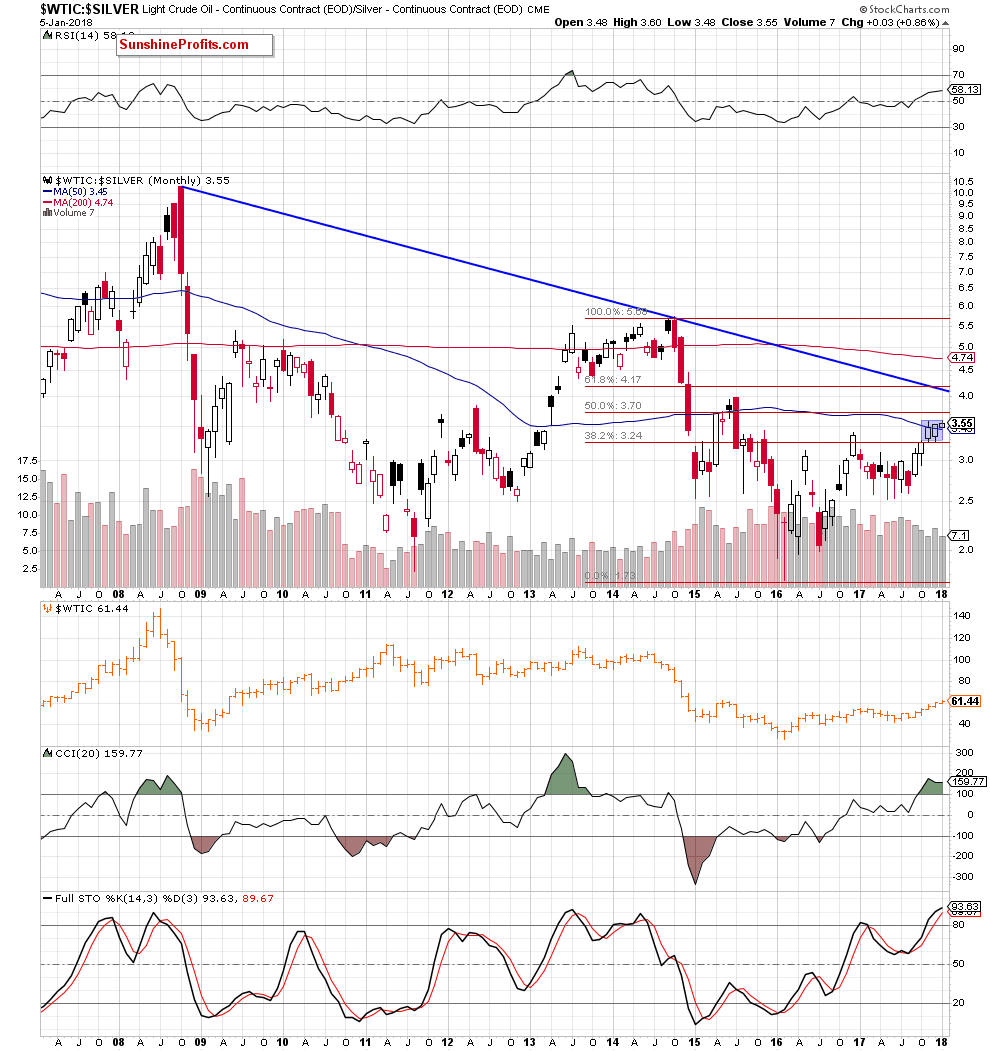
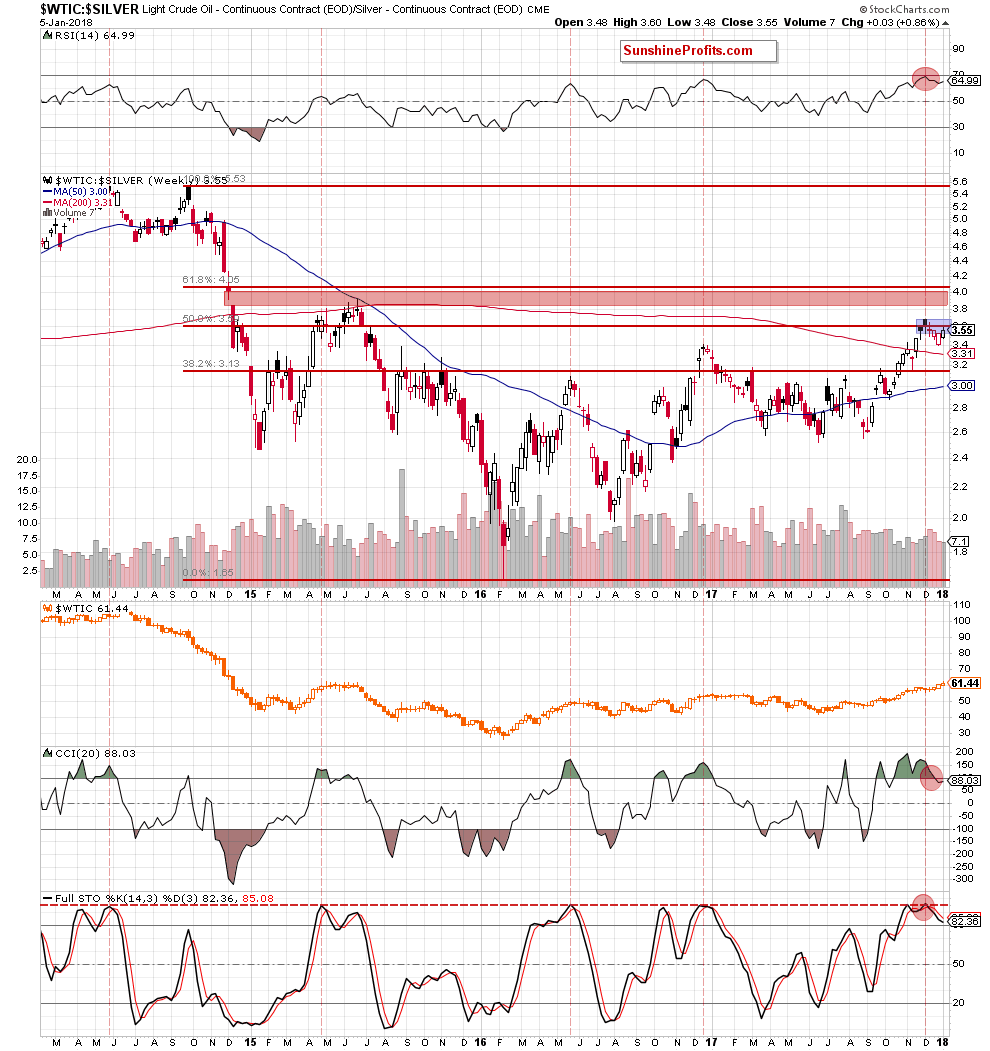
Looking at the above charts, we see that the ratio is still trading in blue consolidation and the sell signals generated by the RSI, the CCI and the Stochastic Oscillator remain in the cards, which means that what we wrote in December remains up-to-date:
(…) the ratio invalidated a tiny breakout above the 50% Fibonacci retracement, which doesn’t bode well for further improvement. Why?
As you see on the chart, not far from current levels is also the red gap (created in December 2014), which served as the major resistance for two years. In May and June 2015, the bulls tried to close it and break above the gap, but all attempts failed, which resulted in a significant decline if the following months. Taking all the above into account, we believe that the space for gains is limited and lower values of the ratio are very likely at the beginning of 2018.
What does it mean for crude oil? Looking at the above charts, we can notice a positive correlation between black gold and precious metals. Therefore, declines in these ratios will likely affect negatively the price of light crude in the following weeks.
Before we analyze the current situation in oil stocks, let’s take a look at the oil-to-oil stocks ratio.
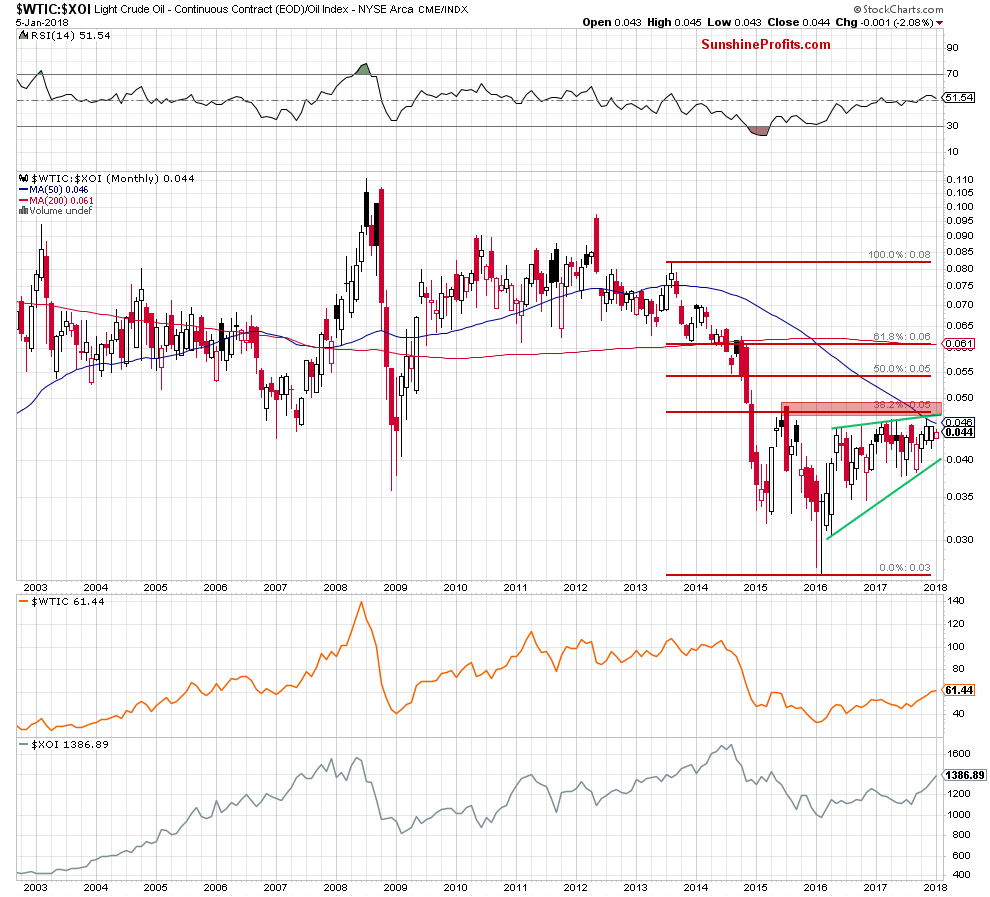
From today’s point of view, we see that the ratio is still trading in the green rising wedge under a very important red resistance zone created by the July 2015 high, the 38.2% Fibonacci retracement and the 50-month moving average.
Will the medium-term chart give us some clues about future moves? Let’s check.
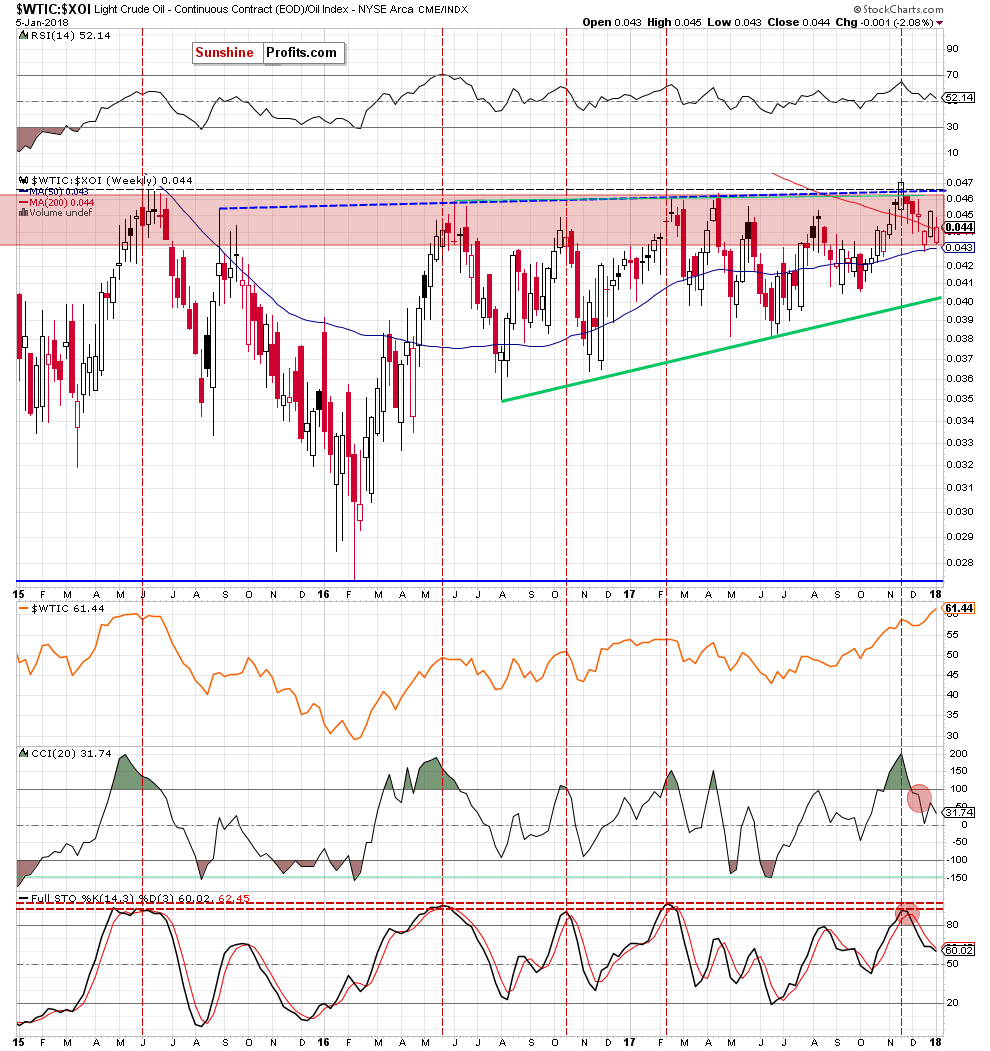
Looking at the above chart, we see that the ratio is currently exactly at the same level as it was when we were publishing the previous Oil Investment Update, therefore the comments that we made in December remain up-to-date:
(…) the 50-week moving average triggered a rebound, but will we see further improvement? Looking at the current position of the indicators (the sell signals and their negative impact remain in place), we think that even if the ratio moves a bit higher from here, the next bigger move will be to the downside.
If this is the case, and the ratio breaks below the blue moving average, we’ll see a test of the lower border of the green rising wedge in the following weeks.
How could such price action affect the price of crude oil? Although the correlation between the ratio and the commodity has slightly decreased, many examples from the past clearly show that the decreases in the ratio corresponded to the decreasing oil prices. Therefore, in our opinion, another move to the south will be more or less visible in both cases - the ratio and crude oil.
Oil Stocks
Let’s examine the NYSE Arca Oil Index (XOI) to find out what the current outlook for oil stocks is.
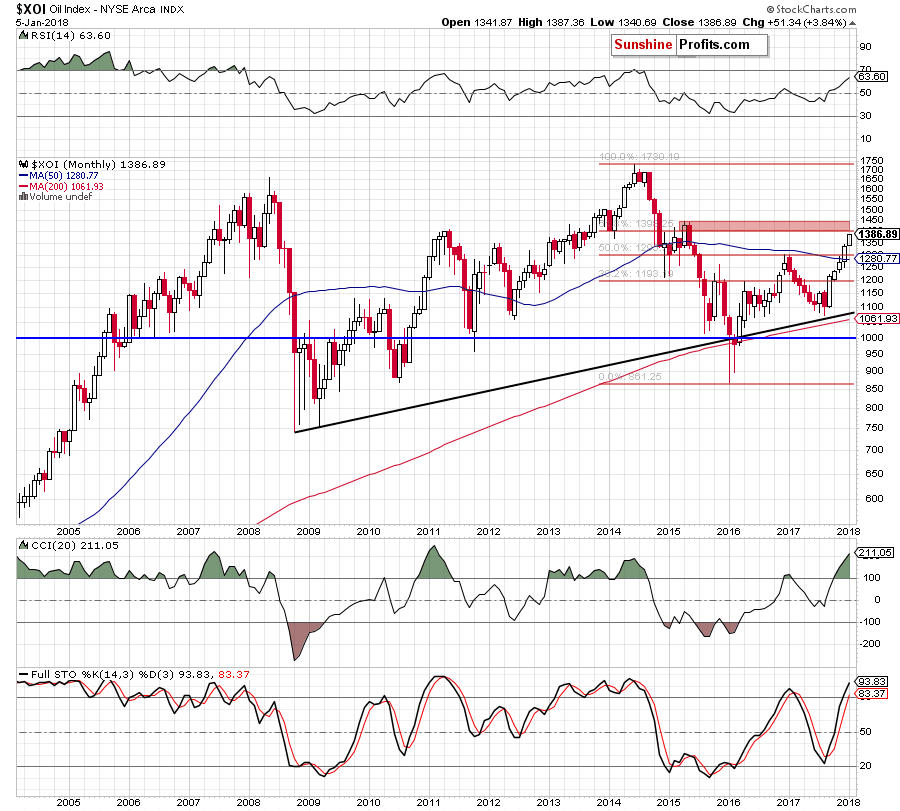
In December, we wrote the following:
(…) the XOI index extended gains in December, breaking above the 50% Fibonacci retracement, the December 2016 and January 2017 highs and the 50-month moving average. This is a bullish development, which opened the way to the red resistance zone created by the 61.8% Fibonacci retracement, the barrier of 1,400 and the April and May 2015 highs.
From today’s point of view, we see that the situation developed in line with the above scenario and oil stocks extended gains in recent weeks. Additionally, the Stochastic Oscillator generated the by signal, which suggests that we’ll see a realization of the above scenario in the coming week(s).
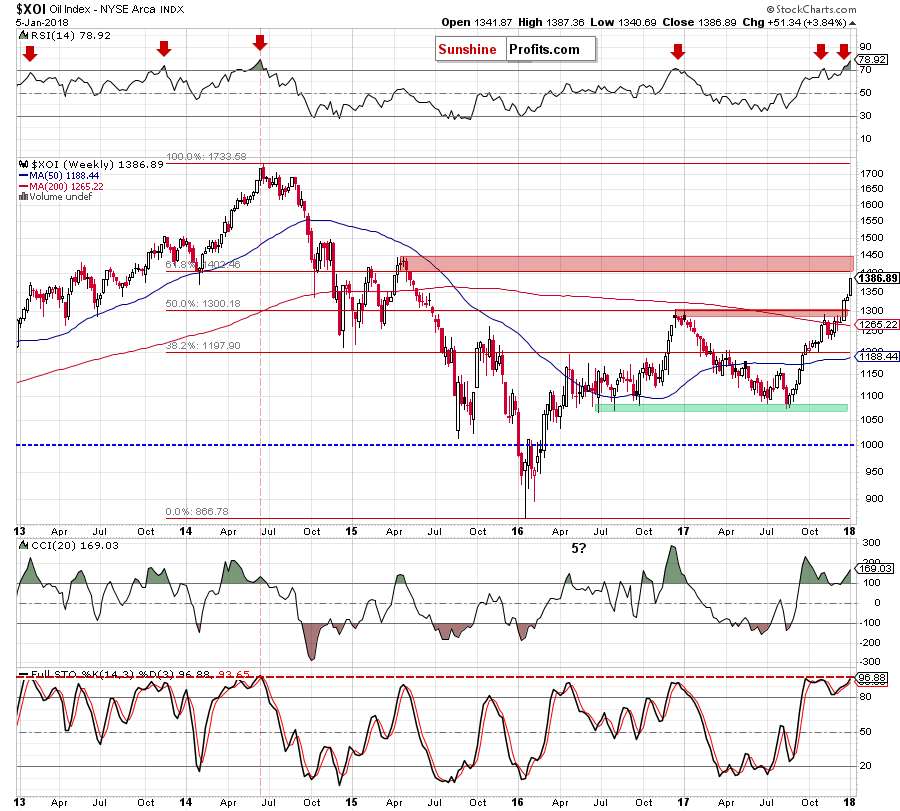
Nevertheless, we should also keep in mind, what could happen around the barrier of 1,400:
(…) although the CCI invalidated the earlier sell signal and the Stochastic Oscillator generated buy signal, they both remain in their overbought areas, which increases the probability of re-generating negative signals. Additionally, the RSI increased above the level of 70 – for the fifth time in four years. In all previous cases (except last month) such high readings of the indicator preceded bigger moves to the downside. Therefore, we think it's worth keeping an eye on oil stocks and observing the index's behavior around the barrier of 1,400, because there is a high probability that we will see a reversal in this area.
Scenarios
Just like a month ago, today’s Oil Investment Update includes scenarios of what could happen in the coming weeks. Naturally, we will continue to monitor the market in the coming days and if anything invalidates our long-term outlook we will send you an additional message.
- Bullish scenario
If crude oil extended gains and breaks above the May 2015 peak of $62.58, we may see not only a test of the 200-month moving average (currently at $65.08), but also an increase to around $70, where the 50% Fibonacci retracement (based on the entire 2011-2016 downward move) is. - Bearish scenario
If the commodity extends losses the first downside target will be around $60.15, where the previously-broken upper border of the black rising trend channel currently is. However, if this support is broken, a test of the November highs will be more likely than not (around $58.99-$59.05). If oil bulls fail in this area, crude oil could drop to $55.82-$56.09, where the December 2017 lows are or even test the early 2017 highs (around $55.03-$55.24).
Summary
In recent weeks, crude oil extended gains and climbed to the key resistance zone created by the 2015 highs. In our opinion, this region is the last chance for oil bears to stop their opponents from pushing black gold to $65 or even $70. There are many technical factors:
- invalidation of the breakout above the black dashed line seen on the daily chart
- sell signals generated by all daily indicators
- bearish divergences (not only in the case of crude oil, but also the ratios)
- unbreak peak from May 2015
- very high readings of the long- and medium-term indicators, which (in several cases) preceded final tops and sizable declines in the following weeks
that can help them fight with higher crude oil prices, but until we see more reliable developments waiting on the sidelines and watching bullish-bears scuffles under the May 2015top without open positions seems to be the best investment solution for the moment.
This completes this month’s Oil Investment Update. Our next Oil Investment Update is scheduled for Friday, February 2, 2018. Oil Trading Alerts subscribers will additionally receive similar but shorter alerts on a daily basis (or more than once a day when the situation requires it). You – Oil Investment Updates subscribers – will receive short Investment Alert messages should the outlook for the medium or long-term change before the next Update is posted.
Thank you.
Nadia Simmons
Forex & Oil Trading Strategist
Oil Investment Updates
Oil Trading Alerts

