
From today’s point of view, we see that the situation in crude oil hasn’t changed much since our last Oil Investment Update was published. Although light crude declined in the first half of March and hit a monthly low of $97.37, the commodity reversed and erased 61.8% of earlier losses in the second half of the month. Despite this improvement, April started very badly for oil bulls. Crude oil has lost 2.25% since the beginning of this month and dropped below important supports.
At this point, oil investors are probably wondering whether the medium-term support line (which triggered a corrective upswing in March) will stop further declines or not. Before we jump into the world of charts, let’s consider recent circumstances which had (and will likely have) a great impact on the price of crude oil.
First of all, oil investors should focus on U.S. crude oil inventories in the following weeks. Why? As a reminder, a sharp increase in crude oil inventories has helped send the price of light crude lower for three consecutive months at the end of last year. In recent weeks, builds in U.S. crude oil inventories were offset by declines in petroleum-product supplies. However, taking into account the fact that refiners close units for seasonal maintenance, it seems that these circumstance may have partly helped in boosting crude stockpiles. In the previous report, the U.S. Energy Information Administration showed the first increase in distillate stockpiles. Also yesterday, the EIA reported that distillate stockpiles increased by 0.6 million barrels (confounding expectations for a withdrawal of 0.1 million barrels) in the week ended March 28. If we see another build, it will likely remove earlier support for crude oil in the following weeks and push the price lower. And speaking of yesterday’s report… Although the EIA showed that domestic crude oil inventories fell by 2.4 million barrels in the week ended March 28 (missing expectations for an increase of 1.1 million barrels) for the first time in 11 weeks, the price of light crude extended declines. It seems that oil investors connected this unexpected drop in crude oil supplies with a closure of the Houston Ship Channel between March 22 and March 25. That event limited imports of crude oil and probably required refiners to draw more supplies from storage. Therefore, this drop in U.S. supply failed to erase traders' fears about sluggish demand and pushed the price below $99. Taking the above into account, it seems that inventories will likely rise again next week. If we see another build in domestic supplies, it may fuel concerns that the market may be adequately supplied and had a negative impact on the price.
We should also keep in mind that weak data on China's PMI (which fell to 55.9 in March from 59.8 in February) and a weak increase in a U.S. manufacturing index (below expectations) painted a tepid picture of economic growth and energy demand. Therefore, oil investors should keep an eye on Chinese exports, imports and trade balance data, which will be released on Apr. 9. In March, weaker-than-expected Chinese economic data pushed light crude declined below $101 per barrel. So, if these numbers disappoint one more time, we will likely see a similar reaction and a drop in crude oil (of course if they are better-than-expected, we will see their positive impact on the price). Please note that market should also focus on Chinese GDP and industrial production (last month, weaker-than-expected data fueled concerns over an economic slowdown in China and have pressured industrial commodity prices, so it’s also worth to keep an eye on them). At the end of the month, oil investors should also keep an eye on China’s HSBC Flash Purchasing Managers Index. In addition to the Chinese data, investors should continue to monitor the U.S. economic data – especially from the labor market as Federal Reserve Chair Janet Yellen commentary fueled concerns on Fed's stimulus reduction and the impact on future oil demand prospects.
Crude Oil
Having discussed the above, let’s now move on to the technical part of this month‘s Oil Investment Update and take a look at the charts from different time horizons to have a more complete picture of the current situation in the oil market.
Let’s start with a look at the monthly chart of light crude (charts courtesy by http://stockcharts.com).
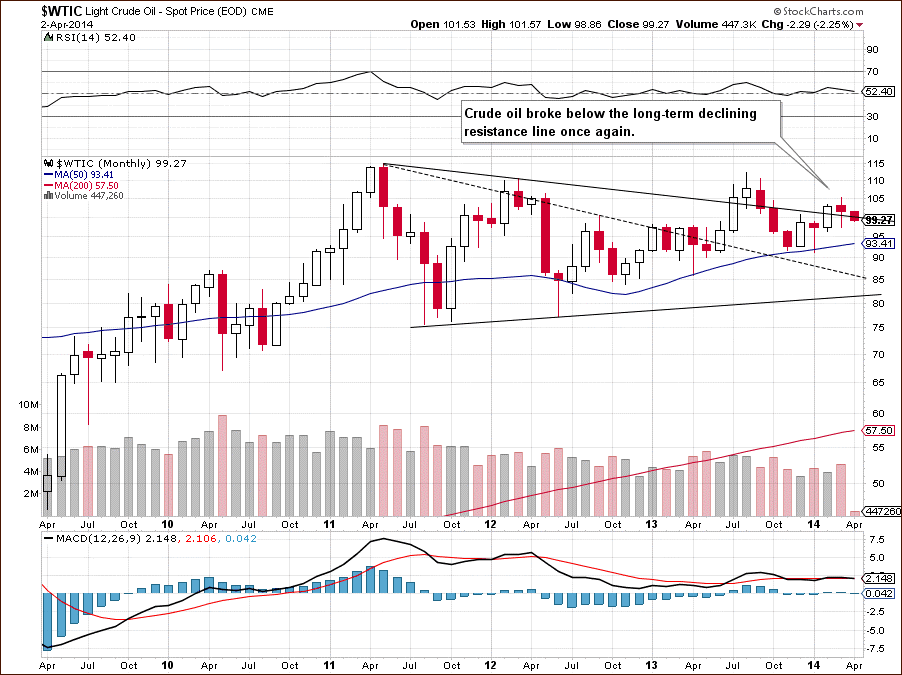
On the above chart, we see that crude oil reversed and dropped below the long-term declining resistance line earlier this month, which is a bearish signal (at least at the moment). Taking this fact into account, it seems that if light crude extends losses, we may see a drop even to the March low of $97.37. Please note that last month’s decline materialized on relative high volume, which confirms the strength of the sellers and suggests that further deterioration is likely to be seen.
Now, let’s zoom in on our picture of the oil market and see the weekly chart.
Quoting our last Oil Investment Update:
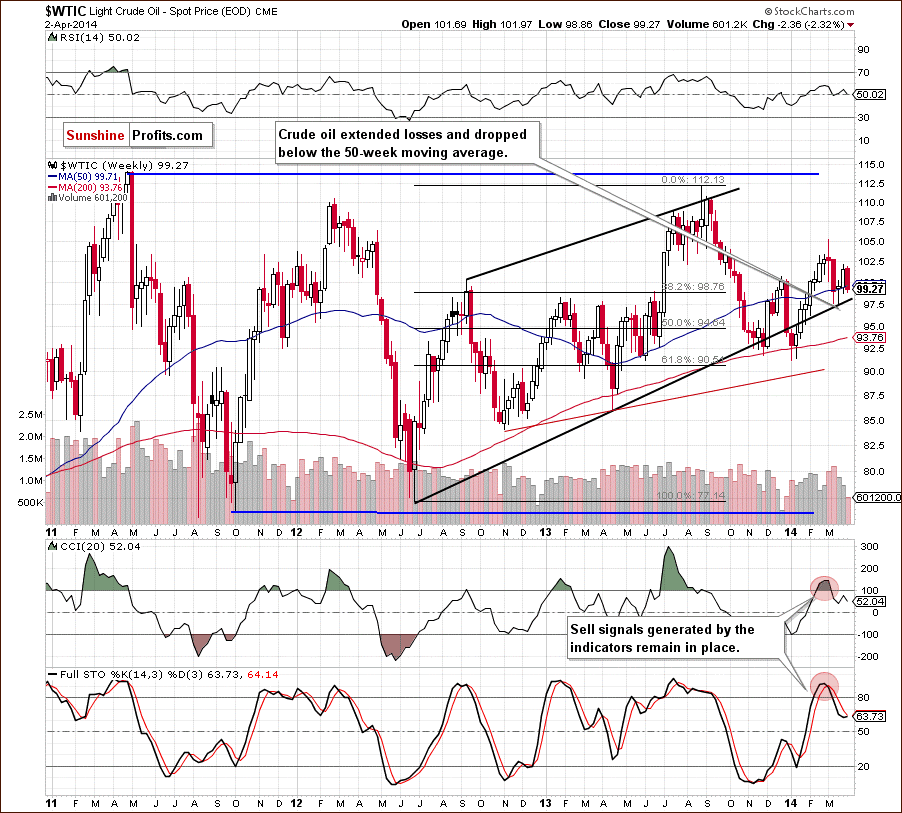
(…) we will likely see a decline to the previously-broken 50-week moving average, which serves as the nearest medium-term support. If it encourages oil bulls to act, we will likely see a pause or even a corrective upswing. However, if it is broken, we may see further deterioration and the next downside target for the sellers would be the medium-term support line (the lower border of the rising trend channel), which successfully stopped decline in February.
As you see on the above chart, we noticed such price action in mid-March. Back then this strong support encouraged oil bulls to act, which triggered a corrective upswing that pushed light crude to the 61.8% Fibonacci retracement level based on the entire March decline. Despite this improvement, crude oil reversed and declined sharply this week, loosing over 2%. With this downward move, the commodity declined below the 50-week moving average and almost touched the previous week low. Taking into account the fact that sell signals generated by the indicators remain in place, it seems that if light crude drops below this support level, we will see further deterioration. If this is the case, the first downside target for the sellers will be the lower border of the rising trend channel (currently around $97.76).
Now, let’s check the short-term outlook.
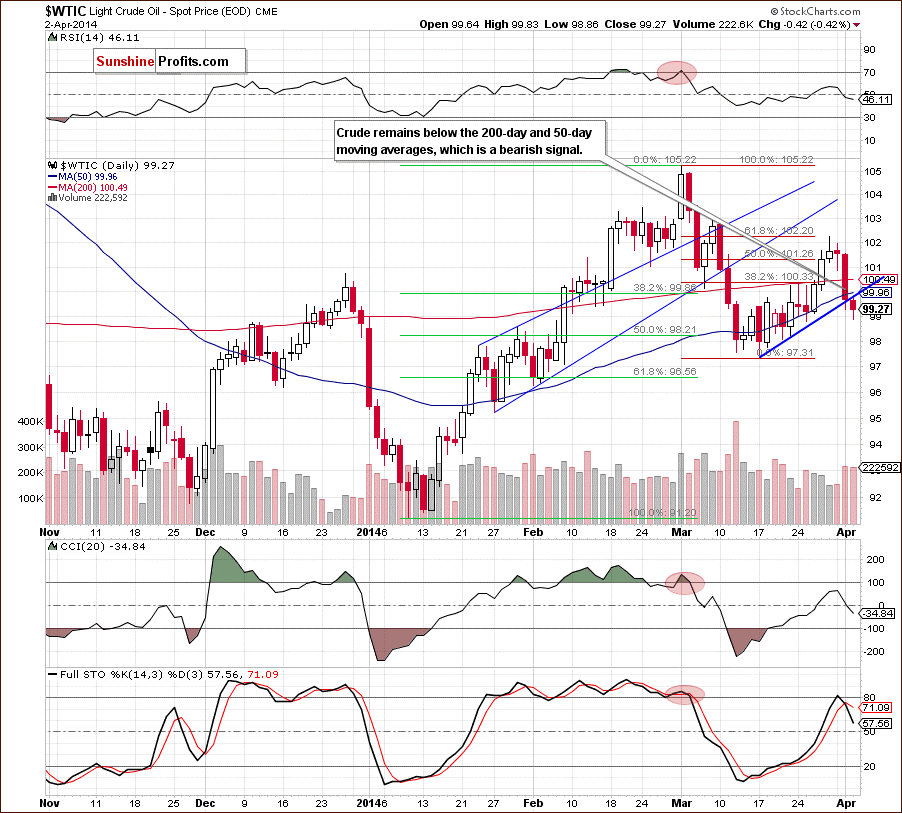
From the short-term perspective, we see that the situation has deteriorated as crude oil declined below the 200-day and also 50-day moving averages. Additionally, after the yesterday’s market open, oil bears took control and prevented the return above the blue support line based on the recent lows (which serves as resistance at the moment). These circumstances triggered further deterioration and crude oil declined below $99, hitting an intraday low of $98.86. In this way, light crude approached a support area (created by the 61.8% Fibonacci retracement based on the entire recent increase and the March 25 low) and rebounded. Despite this fact, the commodity still remains below a resistance zone created by the previously-broken blue resistance line and the 50-day moving average (around $99.96). If oil bulls do not manage to push the price above this area, we will likely see another attempt to move lower. If this is the case, and the nearest support zone is broken, the next downside target for the sellers will be a support area (around $98-$98.27) created by the 76.4% and 78.6% Fibonacci retracements and the lower border of the rising trend channel on the weekly chart. Please note that Wednesday’s downswing materialized on relative high volume, which confirms the strength of the sellers at the moment and suggests that we may see further deterioration in the coming day (or days).
Summing up, looking at the above charts, we see that the situation from the long-, medium- and short-term perspective has deteriorated as light crude reversed and dropped below the long-term declining resistance line and very important moving averages. Taking these facts into account (and combining with the increasing volume during declines and also sell signals on the weekly and daily charts) it seems that we will see further deterioration in the near future. If this is the case, the initial downside target for the sellers will be the support zone (around $98-$98.27) created by the 76.4% and 78.6% Fibonacci retracements (based on the March increase) and the lower border of the rising trend channel (seen on the weekly chart). If this strong support area is broken, we will see a test of the strength of March low of $97.37.
Having discussed the current outlook for crude oil, let’s examine the NYSE Arca Oil Index (XOI) to find out what the current outlook for oil stocks is.
Oil Stocks
Let’s begin with the long-term chart.
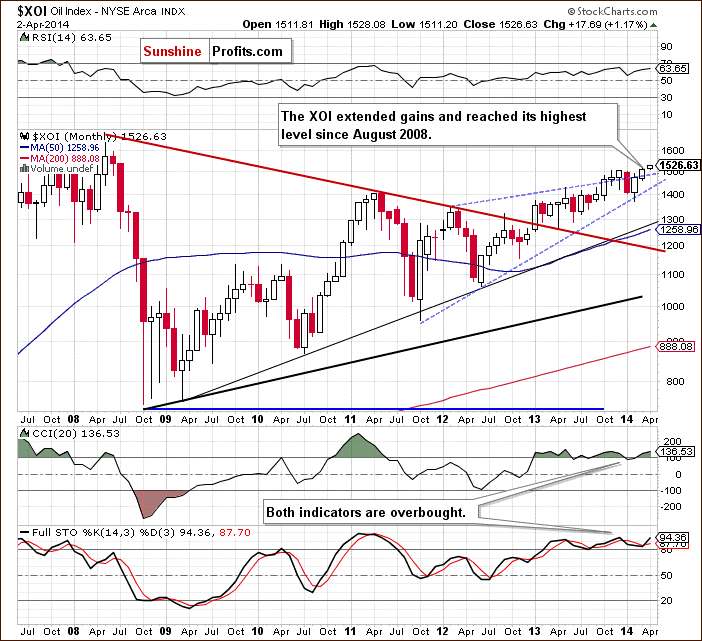
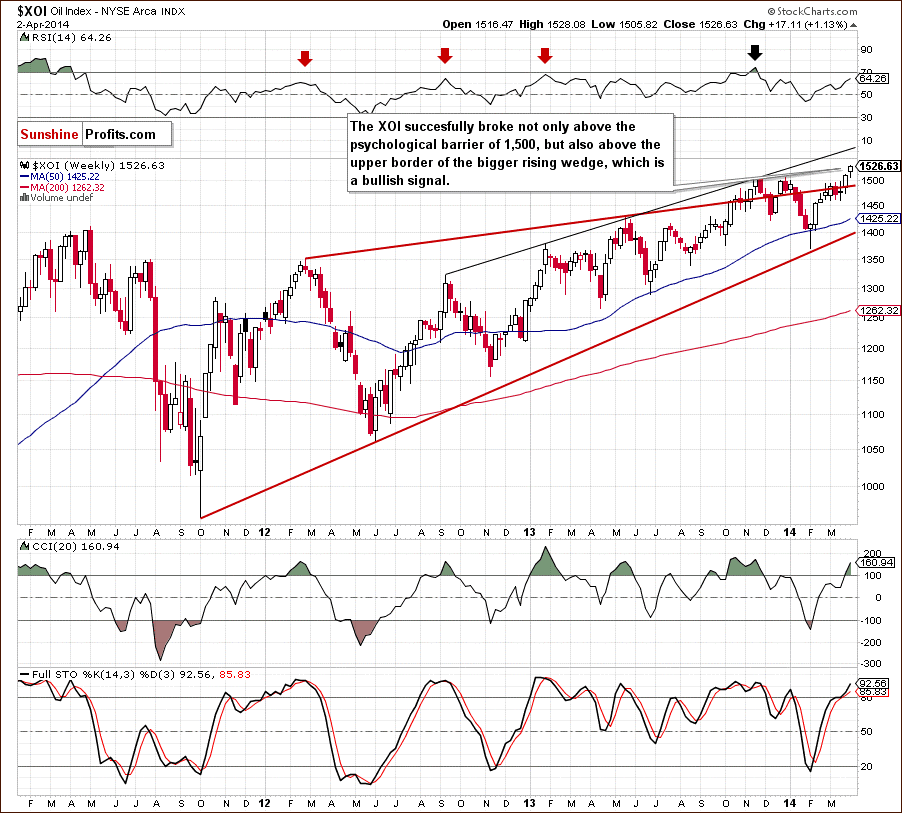
From this perspective, we see that the situation has improved significantly as the XOI extended gains and hit over a five year high. The long-term outlook is bullish, but the nearest resistance level is quite close- around 1,535, where the July 2008 high is. If it encourages sellers to act, we will likely see a pullback (to at least the lower border of the rising wedge – currently around 1,432). However, if it is broken, we may see further improvement and the next upside target for the buyers will be the June 2008 high slightly below the psychological barrier of 1,600.
To see the current situation more clearly, let’s zoom in on our picture and move on to the weekly chart.
In our last Oil Investment Update, we wrote the following:
(…) the XOI (…) approached the psychological barrier of 1,500 (…) if this resistance (…) is broken, we will likely see further improvement and an increase to the 2013 top or even to the medium-term resistance line based on the Sept. 2012, Jan. 2013 and May 2013 highs, which successfully stopped buyers in November. Looking at the position of the indicators, we see that they still support buyers, which suggests that higher values of the oil stock index are likely to be seen in the coming weeks.
As you see on the above chart, the XOI broke above the 2013 top in the previous week and extended gains in the recent days, hitting a fresh 2014 high. Taking this fact into account, it seems that we may see further improvement in the near future and the first upside target for the buyers will be the medium-term resistance line based on the Sept. 2012, Jan. 2013 and May 2013 highs (currently around 1,560). Looking at the current position of the indicators, it seems that this resistance line may encourage sellers to act. If this is the case, we will likely see a pullback to the bottom of the previous correction (around 1,460). However, if the indicators do not generate sell signals and the buyers manage to push the oil stock index above this resistance line, we may see further growth even to the next psychological barrier of 1,600.
Having discussed the medium-term outlook, let’s turn to the daily chart.
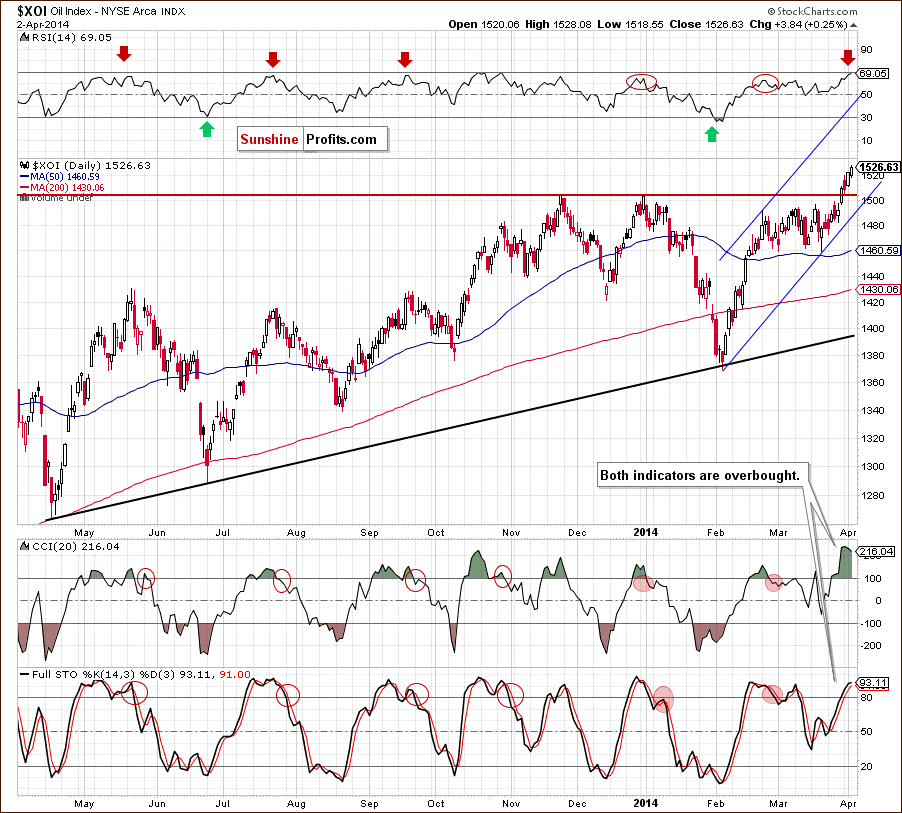
The first thing that catches the eye on the above chart is a successful breakout above the psychological barrier of 1,500 and the 2013 high. However, despite these bullish circumstances, we should take a closer look at the current position of the indicators. From this perspective, we see that the RSI climbed to its highest level since October. Back then, such high value of the indicator triggered a correction in the XOI. We saw similar situations in November and also in December (despite lower readings). Additionally, the CCI and Stochastic Oscillator are overbought, which suggests that a correction is just around the corner. Nevertheless, as long as there are no sell signals, further improvement is likely to be seen. Before we summarize, the situation in the oil stock index, we would like to draw your attention to the Fibonacci extension levels (based on the entire Dec.-Feb. decline), which may decelerate (or even stop) further improvement: the 127.2% - 1,540; 141.4% - 1,560; 150% - 1,571; 161.8% - 1,587 and 173.2% at 1,603.
Summing up, from the long-, medium- and short-term perspectives, the situation has improved significantly as the oil stock index broke above the above the psychological barrier of 1,500 and the 2013 high. Despite these bullish circumstances, we should keep in mind that the nearest resistance zone created by the July 2008 high and the 127.2% Fibonacci extension (1,535-1,540) is quite close and the short-term indicators are overbought. Taking these facts into account, we may see a pause (or even a stop) in this area. Nevertheless, if it is broken, the next upside target for the buyers will be around 1,560, where the medium-term resistance line (based on the Sept. 2012, Jan. 2013 and May 2013 highs) and the 141.4% Fibonacci extension are.
Crude Oil - Oil Stocks Link
Having discussed the current situation in crude oil and the oil stock index, let’s comment on the relationship between them.
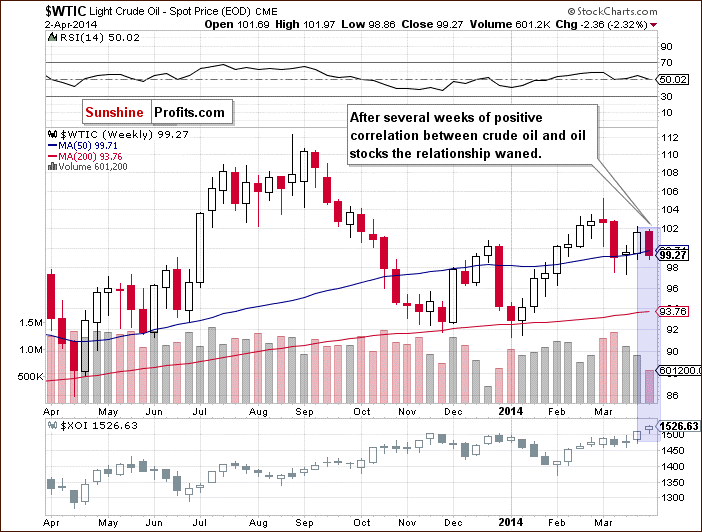
When we take a look at the above chart and compare the price action in both cases, we see that after several weeks of a positive correlation between crude oil and oil stocks the relationship waned. In the previous week, crude oil reversed and gave up some gains. Earlier this week, we saw further deterioration as light crude broke below the 50-week moving average. Meanwhile, looking at the situation in the XOI, we see that oil stocks were visibly stronger as the oil stock index not only broke above the psychological barrier of 1,500, but also above the 2013 high. Thanks to these circumstances, they began to move in opposite directions – just like at the end of last year. If this negative relation between light crude and oil stocks remains in place, further improvement in the XOI will likely push crude oil lower. Nevertheless, it seems that after several weeks of a positive correlation, it’s too early to predict the future price of crude oil based only on this relationship. Therefore, we take a closer look at the ratios below. Will they give us any interesting clues? Let’s find out.
Ratio Analysis
Let’s start this section by focusing on the oil-stocks-to-oil ratio from the weekly perspective. What impact could it have on future oil moves?
In our last Oil Investment Update, we wrote the following:
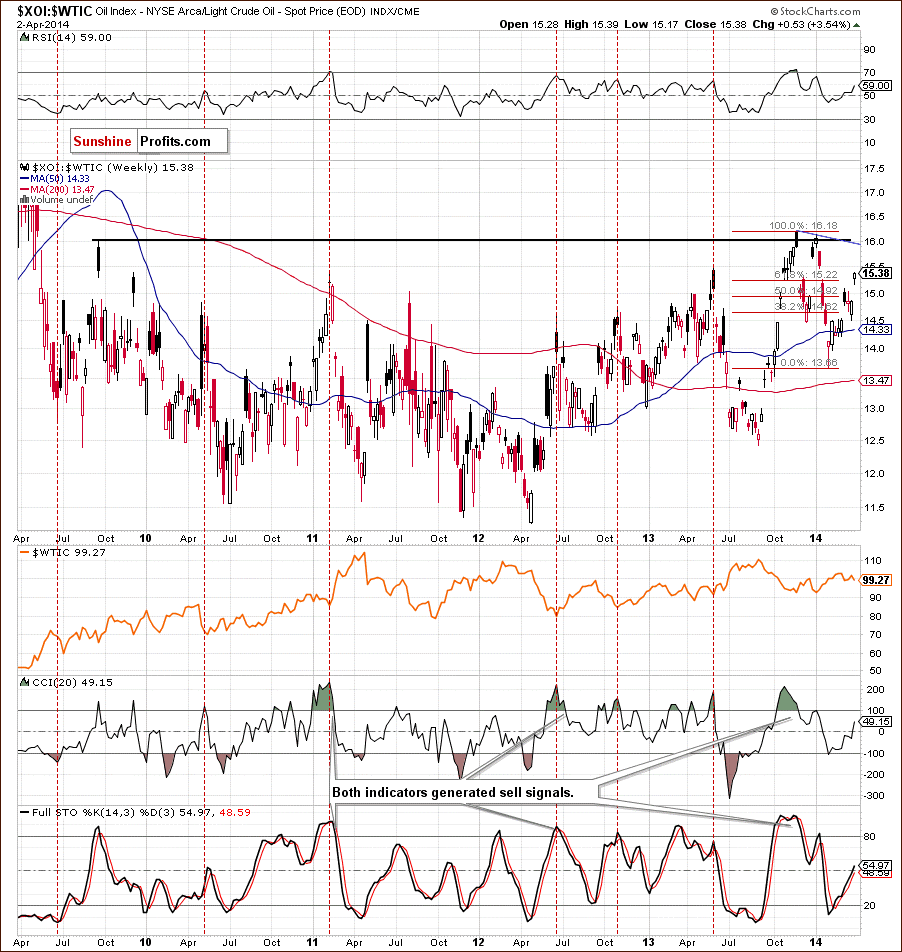
(…) higher values of the ratio triggered downward moves in crude oil in the previous months. (…) this dependence was based on the negative correlation between the XOI and WTIC. However, taking into account the fact that a positive correlation between crude oil and oil stocks came back in the previous weeks, we should interpret the current moves in the ratio differently than we did so far. (…) the ratio (…) reached the 38.2% Fibonacci retracement based on the recent decline (…). If this resistance level encourages sellers to act, we will likely see (…) a correction in oil stocks and crude oil (…). On the other hand, if this resistance level is broken, we may see further improvement in both cases.
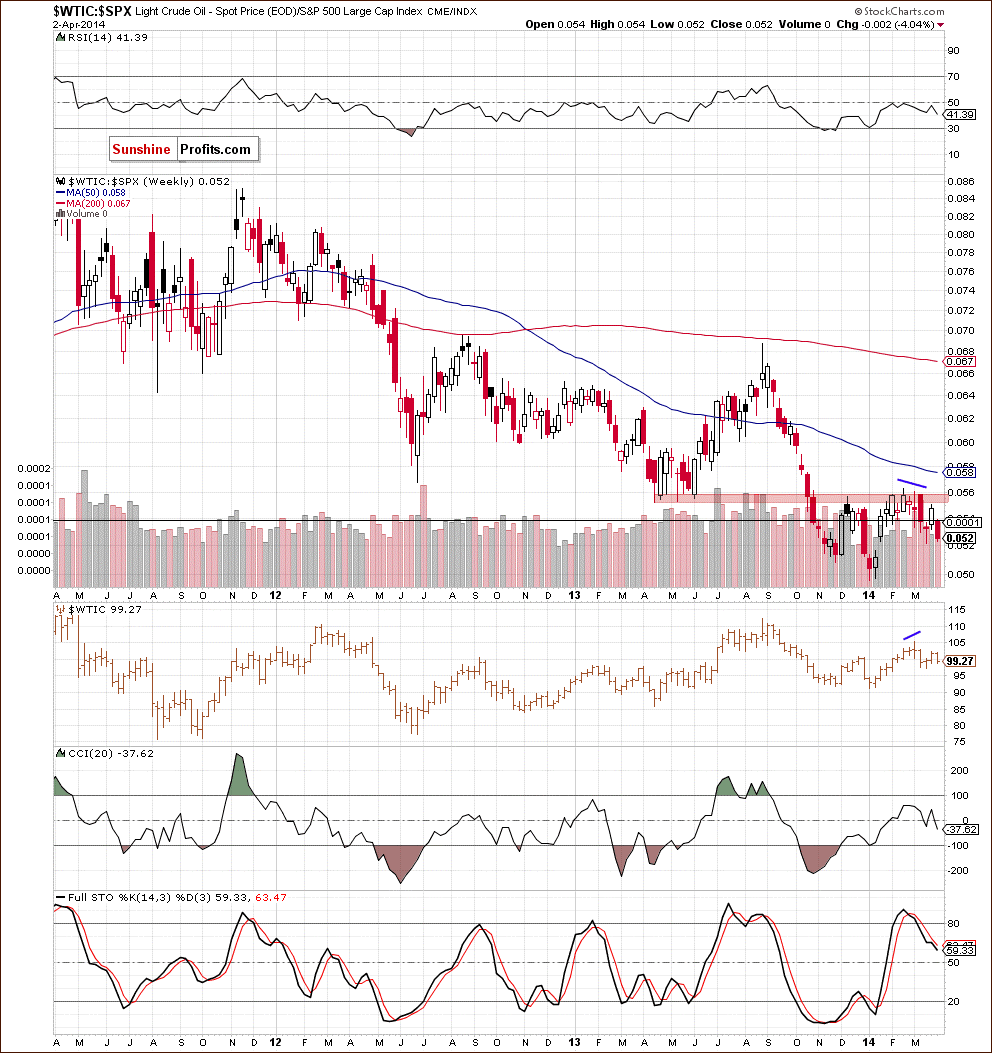
Looking at the above chart, we see that the ratio broke not only above the 38.2% Fibonacci retracement based on the recent decline, but also above the 50% and 61.8% retracements, which was a strong bullish signal that triggered further improvement in the XOI an WTIC. However, taking into account the fact that the negative correlation between them came back in the previous week, it seems that higher values of the ratio may trigger lower values of crude oil. As you see on the above chart, there is still much room for further growth as the blue declining resistance line and the horizontal black line are quite far (currently around 15.90-16), which suggests that further deterioration in crude oil can’t be ruled out (based only on this ratio).
Once we know the above, let’s focus on the oil-to-stocks ratio. Will it give us some interesting clues about crude oil’s future moves?
Quoting our previous Oil Investment Update:
(…) the ratio reached a resistance zone created by April and May 2013 lows, which successfully stopped further improvement at the beginning of December and also in February. Connecting the dots, if history repeats itself once again, we will likely see further deterioration in the ratio, which probably will trigger a correction in crude oil.
In the previous month, we noticed such price action as the ratio declined to 0.052, which corresponded to a decline in crude oil to the March low of $97.37. As you see on the above chart, although the ratio rebounded at the end of March (triggering the higher price of light crude), the resistance zone stopped further growth (similarly to what we saw earlier this year), which resulted in another downward move (in both cases). Therefore, if the ratio declines below the March 17 low, we will likely see further declines in crude oil. Please note that the recent downswings materialized on relative high volume, which confirms the strength of the sellers (the current position of the indicators also favors them).
Before we finish this section, let’s take a look at the gold-to-oil ratio.
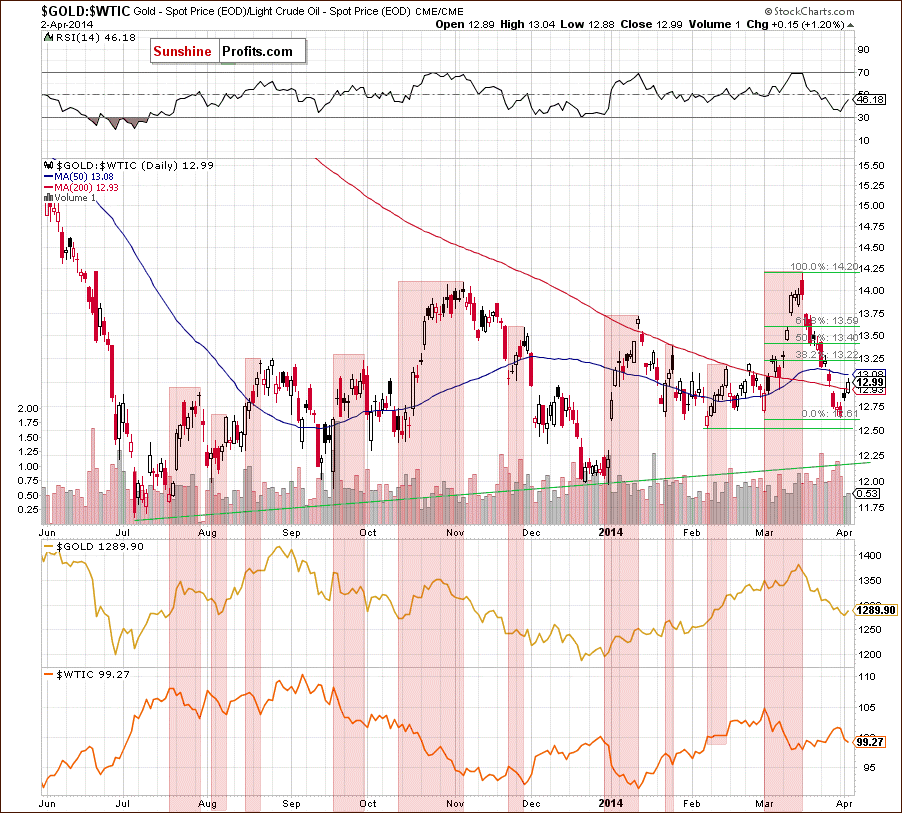
Looking at the above chart, we see that an increasing value of the ratio has triggered the lower price of crude oil in the past. We saw such price action in almost every month since July. Therefore, if the ratio climbs once again, we may see further deterioration in light crude in the near future (please note that there is still much room for further growth as the 38.2% Fibonacci retracement based on the entire decline is quite far).
Finishing this month’s Oil Investment Update, let’s take a look at the non-USD (WTIC:UDN ratio) chart of crude oil.
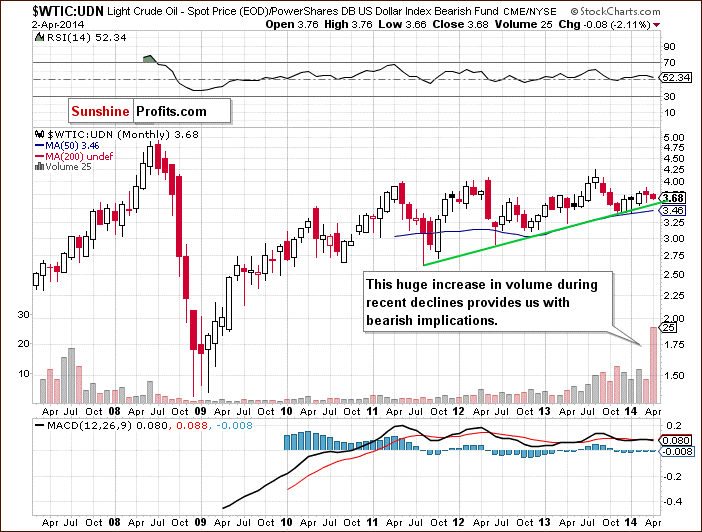
As you see on the above chart, although crude oil extended losses, it still remains between the March high and low. From this perspective, we see that the previous month’s low corresponds (at least at the moment) to the green support line. Therefore, as long as light crude remains above these levels a bigger correction is not likely to be seen. However, looking at the monthly chart, we see a huge increase in volume during the recent declines, which confirms the strength of the sellers and suggests that oil bears will likely test the strength of the support zone.
Scenarios
Just like a month ago, today’s Oil Investment Update includes scenarios of what could happen in the coming weeks. Naturally, we will continue to monitor the market in the coming days and if anything invalidates our long-term outlook we will send you an additional message.
- Bullish scenario
Taking into account only the short-term outlook, we may see a drop to the support zone (around $98-$98.27) created by the 76.4% and 78.6% Fibonacci retracements (based on the March increase) and the lower border of the rising trend channel (seen on the weekly chart). If this strong support area encourages oil bulls to act, we may see a corrective upswing to $102.24-$102.91 or even to the March high of $105.22. - Bearish scenario
If this support zone is broken, we will see further deterioration. As mentioned earlier, the first downside target will be the March low of $97.37. If it is broken, the next target for the sellers will be a support zone created by the 61.8% Fibonacci retracement (based on the entire Jan.-March increase) and the Feb.3 low (around $96.26-$96.56). Below this area, oil bears may be stopped by the 76.4%-78.6% Fibonacci retracements (around $94.23-$94.54).
Summary
From the long-, medium- and short-term perspective the situation has deteriorated as light crude reversed and dropped below the long-term declining resistance line and very important moving averages. As mentioned earlier, the negative correlation between crude oil and oil stocks came back in the previous week (we can see it also this week), which suggests that if the oil-stocks-to-oil ratio extends gains, we will likely see further deterioration in crude oil. This scenario is currently reinforced by the position of the medium- and short-term indicators and the increasing volume during declines. Additionally, if the oil-to-stocks ratio drops below the March 17 low (and the gold-to-oil ratio climbs above the 50-day moving average), the bearish scenario will be more likely.
Very short-term outlook: bearish
Short-term outlook: mixed with bearish bias
MT outlook: mixed
LT outlook: mixed
Trading position (our opinion): If one wants to hold your long position for months, it doesn't seem that the current move lower needs to be really concerning - even if oil drops to $94 or so. However, if one's long position is intended to be kept for weeks, not months, then one might want to close this position after the move below $98.80 and re-enter it either when oil drops to $95 or when price moves back to this level (if there is no visible decline thereafter).
This completes this week’s Oil Investment Update. Our next Oil Investment Update is scheduled for Tuesday, May 6, 2014. Oil Trading Alerts subscribers will additionally receive similar but shorter alerts on a daily basis (or more than once a day when the situation requires it). You – Oil Investment Updates subscribers – will receive short Investment Alert messages should the outlook for the medium or long term change before the next Update is posted.
Thank you.
Nadia Simmons
Forex & Oil Trading Strategist
Oil Investment Updates
Oil Trading Alerts

