
- Crude Oil and Oil Stocks
- Crude Oil
- Oil Stocks
- Crude Oil - Oil Stocks Link
- Ratio Analysis
- Scenarios
- Summary
Crude Oil and Oil Stocks – The Medium-Term Perspective
From today’s point of view, we clearly see that the beginning of the year was hard for oil bulls. In the first week of January, crude oil extended losses and hit a fresh seven-month low of $91.24. Despite this drop, the situation improved in the coming weeks as light crude invalidated an important breakdown and erased almost 38.2% of the entire Aug.-Nov. decline once again (and more than 75% of the Dec.-Jan. decline). Thanks to this upward move, crude oil closed the month above $97 per barrel.
What circumstances had such a positive impact on the price? Let’s examine all bullish factors that emerged during the last month. As we wrote in our previous Oil Investment Update, at the beginning of January crude oil gained as concerns over oil flows from Iraq and Libya pushed the price higher.
Later in the month, better-than expected U.S. economic data have also supported the price of crude oil by fueling hopes for the U.S. economy to gain steam and demand more oil and energy than once anticipated. Therefore, it seems that we could see a similar investors’ reaction in the coming weeks – especially when we take into account the fact that we saw such situation in December.
In January, crude oil was also supported by larger-than-expected drops in crude oil inventories. Taking into account the fact that oil companies typically move crude from storage tanks at the end-of-year period to avoid a tax, market participants closely watched January’s reports from the U.S. Energy Information Administration. Although this inventory report showed that crude stockpiles climbed for the first time in eight weeks (they rose by 990,000 barrels) in the week ended Jan.17, distillate supplies, including diesel fuel, declined more than analysts expected, which supported the price of light crude and pushed it to its highest level in three weeks. At the end of the month we saw similar situation as the EIA data showed that crude inventories rose more than expected in the week ended Jan. 24. Despite the larger-than-expected supply build, oil investors were encouraged by data, which showed that gasoline supplies and distillate inventories, including heating oil and diesel fuel, fell once again. At this point it’s worth mentioning another bullish factor - colder-than-normal temperatures, which have boosted demand for heating oil and resulted in a 12.6% lower distillate stockpiles than a year earlier. From this point of view, we can conclude that oil investors should pay their attention not only on crude oil inventories, but also on gasoline supplies and distillate inventories.
And speaking of the inventories… At the end of the previous month, the southern leg of Keystone XL pipeline began transporting 300,000 barrels of crude oil a day, which bolstered expectations of reducing the storage glut in Oklahoma and pushed the price of light crude higher.
Finishing this part of Oil Investment Update, we would like to draw your attention to the Federal Reserve’s monthly meeting. In the previous week, market participants worried that reducing the stimulus measures would have the opposite effect, strengthening the dollar and weighing on the price of oil, which is denominated in dollars. These worries had a negative impact on crude oil and pushed the price below $96. However, it seems that thay missed the fact that although the Fed said in December that it would begin scaling back its monthly bond purchases this month, we didn’t see sharp declines in crude oil as the dollar strengthened on the news. What’s interesting, back then we saw further improvement in light crude and the price increased above $100. In January, we also saw an increase in crude oil after the Fed's policy-making committee said in a statement that it would trim its bond purchases to $65 billion per month in February. Taking these facts into account, it seems that we may expect similar investors’ reaction in the coming month (if any bearish factors do not affect the price).
Crude Oil
To see what the crude oil market itself can tell us, let's jump straight into the technical part of this month‘s Oil Investment Update. Just like in the previous month, we’ll take a look at charts in different time horizons to have a more complete picture of the current situation in the market.
Let’s start with a look at the monthly chart of light crude (charts courtesy by http://stockcharts.com).
Quoting our last Oil Investment Update:
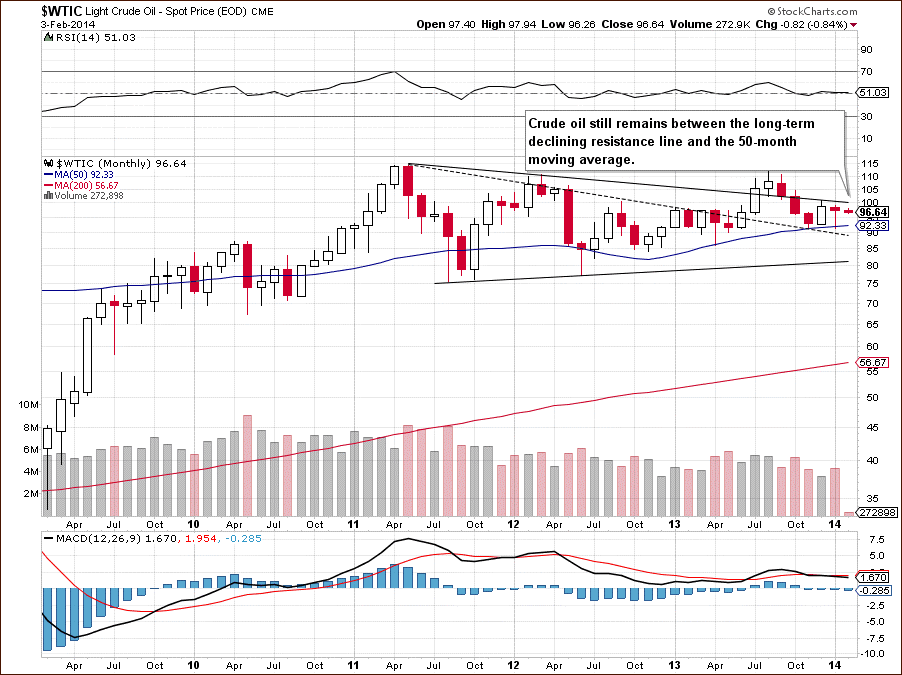
(…) the 50-month moving average, which successfully stopped further deterioration in two previous months (and also earlier in April), is slightly below the current price level. If history repeats itself once again, the space for further declines will be limited.
Looking at the monthly chart, we see that the 50-month moving average in combination with a bullish engulfing pattern encouraged oil bulls to act and triggered an upward correction to slightly below the long-term declining resistance line based on the May 2011 and March 2012 highs. From this perspective, the situation remains mixed with bullish bias. On one hand, as long as crude oil remains above the 50-month moving average and the bullish engulfing pattern is not invalidated, it seems unlikely that we see further deterioration (a decline below the January low). On the other hand, the long-term declining resistance line keeps further growth in check.
Now, let’s zoom in on our picture of the oil market and see the weekly chart.
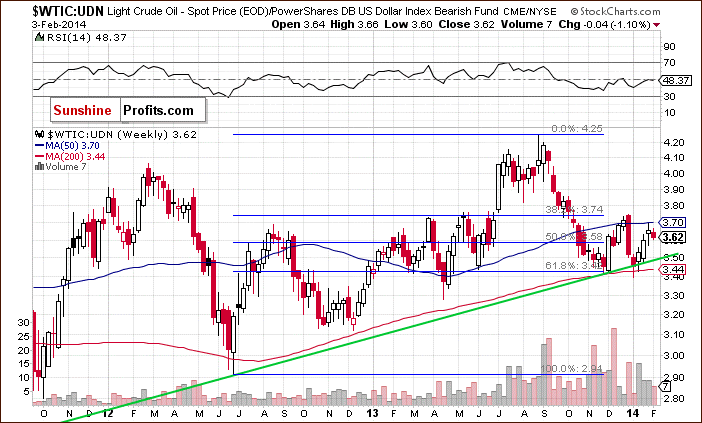
In our previous Oil Investment Update, we wrote:
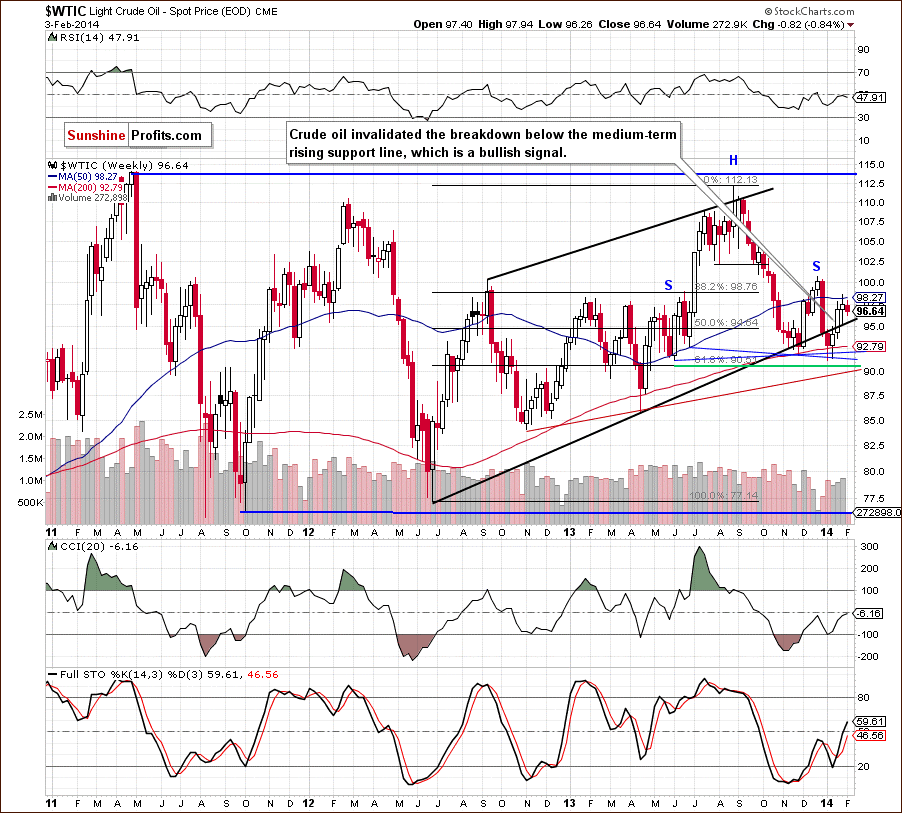
(…) light crude reached the medium-term rising support line, which is also the lower border of the rising trend channel. (…) crude oil extended its decline and dropped below this line, which is a bearish signal, however, the breakdown is not confirmed at the moment. Please note that we saw a similar phenomenon only once in the past - in November 2013 - and at that time, it was quickly invalidated, and even followed by a sharp rally. At that time it was the 200-week moving average that stopped the decline and triggered a reversal. Perhaps we will see similar action in the following days. This moving average is about $1 below the current price, so the downside seems very limited, and given the preceding action in the previous similar case, the upside can be quite significant, even on a short-term basis.
As you noticed on the weekly chart, we saw such price action in previous weeks. After a drop to support blue lines, crude oil reversed course and rebounded in the second week of January. In the following weeks, light crude extended gains and invalidated the breakdown below the lower border of the rising trend channel. An invalidation of the breakdown was a strong bullish signal that encouraged oil bulls to push the buy button and trigger an upward move. Thanks to this, crude oil reached the 50-week moving average last week. As you see on the above chart, this resistance line successfully stopped further improvement at the beginning of December and we will likely see similar price action also this week. Nevertheless, it seems that the space for further declines will be limited by the lower border of the rising trend channel (currently around $95.47). Please note that even if this support is broken, the 200-week moving average will likely stop oil bears once again.
Now, let’s check the short-term outlook.
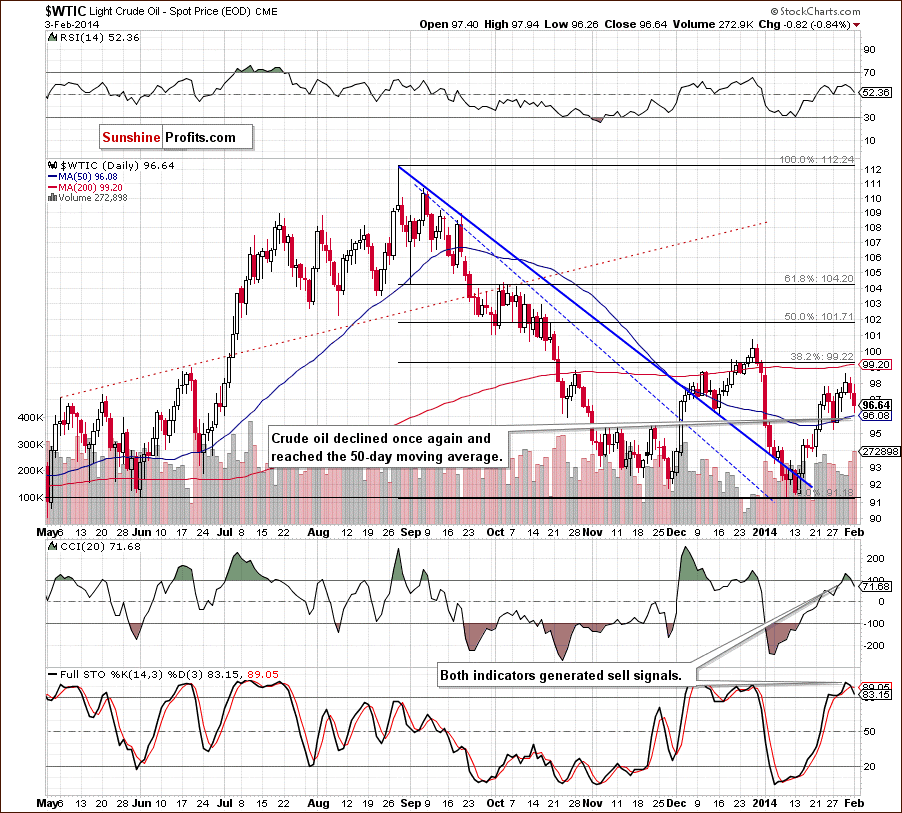
On the above chart, we see that crude oil extended its decline at the beginning of January and hit its seven-month low. With this downward move, light crude reached the June low which encouraged buyers to act. In the following days, crude oil came back above the short-term declining support line (marked in blue), which was the first bullish signal that triggered further improvement. As you can see on the daily chart, even the 50-day moving average didn’t manage to stop oil bulls and light crude approached the level of $98. Although we saw a correction, it was quite shallow and the previously-broken 50-day moving average successfully stopped further deterioration. In the previous week, crude oil moved higher once again and hit a four-week high of $98.59. In this way, the price reached also the 76.4% Fibonacci retracement level based on the Dec.-Jan. decline. This resistance level in combination with the proximity to the 200-day moving average and the 38.2% Fibonacci retracement (based on the entire Aug.-Jan. decline) encouraged oil bears to act and triggered a pullback in recent days.
Looking at the above chart, we see that crude oil approached the 50-day moving once again. If this strong support encourage buyers to push the order button, we will likely see a corrective upswing in the coming days. However, if it is broken, we will see further deterioration and the next downside target will be the Jan.27 low at $95.21. At this point it’s worth noting that yesterday’s downswing materialized on relative large volume, which confirms the strength of the sellers. Additionally, the CCI and Stochastic Oscillator generated sell signal, which supports the latter scenario.
Summing up, looking at the above charts, we see that although the situation from the long-term perspective hasn’t changed much in the previous month, the medium- and short-term outlook has improved as crude oil invalidated the breakdown below the lower border of the rising trend channel. With the recent rally, light crude reached the 50-week moving average and approached the strong resistance zone created by the 200-day moving average and the 38.2% Fibonacci retracement level based on the entire Aug.-Dec. decline. Taking these facts into account (and combining with the position of the short-term indicators), it seems that we will see a bigger pullback in the near future. Nevertheless, as long as crude oil remains above the 200-week moving average and
the bullish engulfing pattern (on the monthly chart) is not invalidated, it seems unlikely that we see a decline below the January low. On the other hand, a strong resistance zone created by the 200-day moving average (currently at $99.20), the 38.2% Fibonacci retracement level based on the entire Aug.-Dec. decline (at $99.22), the 50-week moving average (currently at $98.27) and the long-term declining resistance line (currently around $100) keeps further growth in check.
Having discussed the current outlook for crude oil, let’s examine the NYSE Arca Oil Index (XOI) to find out what the current outlook for oil stocks is.
Oil Stocks
Let’s begin with the long-term chart.
Quoting our last Oil Investment Update:
(…) the XOI declined and reached the upper line of the rising wedge once again.
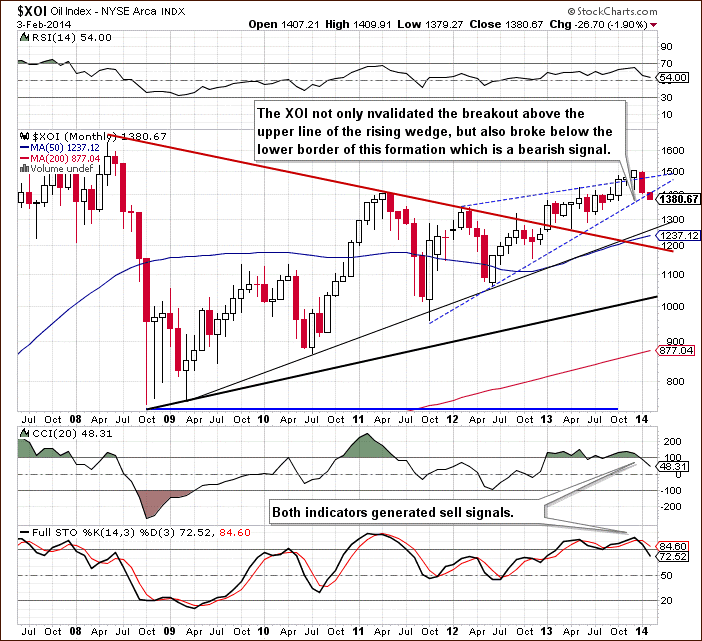
(…) if the oil stock index drops below this line, we will likely see further deterioration and the first downside target will be around the December low at 1,421. Please note that the RSI is not overbought at the moment, however, it remains at its highest level since April 2011. At this point, it’s worth noting that in previous years lower readings of the indicator were enough to trigger a correction.
As you noticed on the above chart, we saw such price action in the previous month. A breakdown below the upper line of the rising wedge triggered a sharp decline which took the XOI not only to the December, but also to the lower border of the rising wedge. Yesterday, the oil stock index extended its decline and dropped below this important support line which is a strong bearish signal. However, the breakdown is not confirmed at the moment. Nevertheless, we should keep in mind that the CCI and Stochastic Oscillator generated sell signal supporting the bearish case. If oil bulls do not invalidate this breakdown, we will likely see further deterioration and the next downside target will be the July low slightly above the psychological barrier of 1,300.
To see the current situation more clearly, let’s zoom in on our picture and move on to the weekly chart.
In our last Oil Investment Update, we wrote the following:
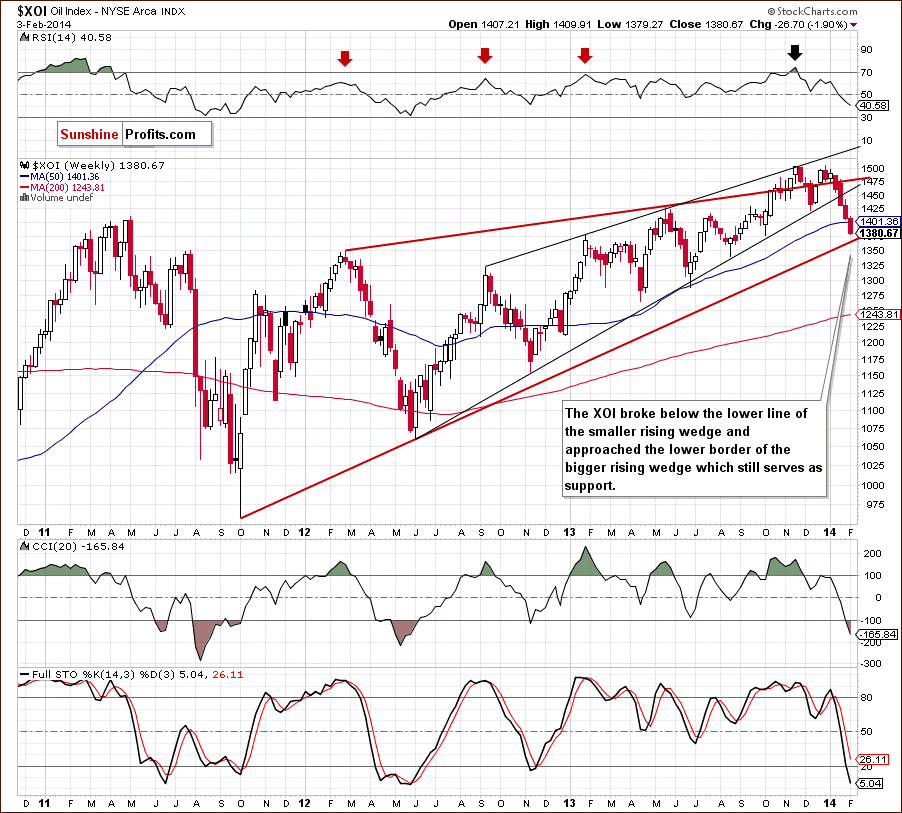
(...) on the weekly chart, we see that the oil stock index remains between the upper line of the smaller rising wedge, which serves as medium-term resistance and the upper line of the rising wedge (marked with a bold red line), which serves as medium-term support. From this point of view, it seems that the breakout/breakdown above/below one of these lines will trigger another bigger move in oil stocks.
Looking at the above chart, we see that the XOI broke below the upper line of the rising wedge (marked with a bold red line) at the beginning of January which triggered a sharp decline. With this downward move, the oil stock index not only dropped below the lower border of the smaller rising wedge, but also below the 50-week moving average and approached the lower border of the rising wedge (marked with a bold red line). If this strong support line encourages oil bulls to act, we will likely see a corrective upswing in the coming week (or weeks). Please note that this scenario is reinforced by the position of the indicators (the CCI is already oversold and Stochastic Oscillator declined to its lowest level since November 2012). However, if this support line is broken, we will see further deterioration and the downside target will be a support zone created by the psychological barrier of 1,300 and the Jun.24 low at 1,288.
Now, let’s turn to the daily chart.
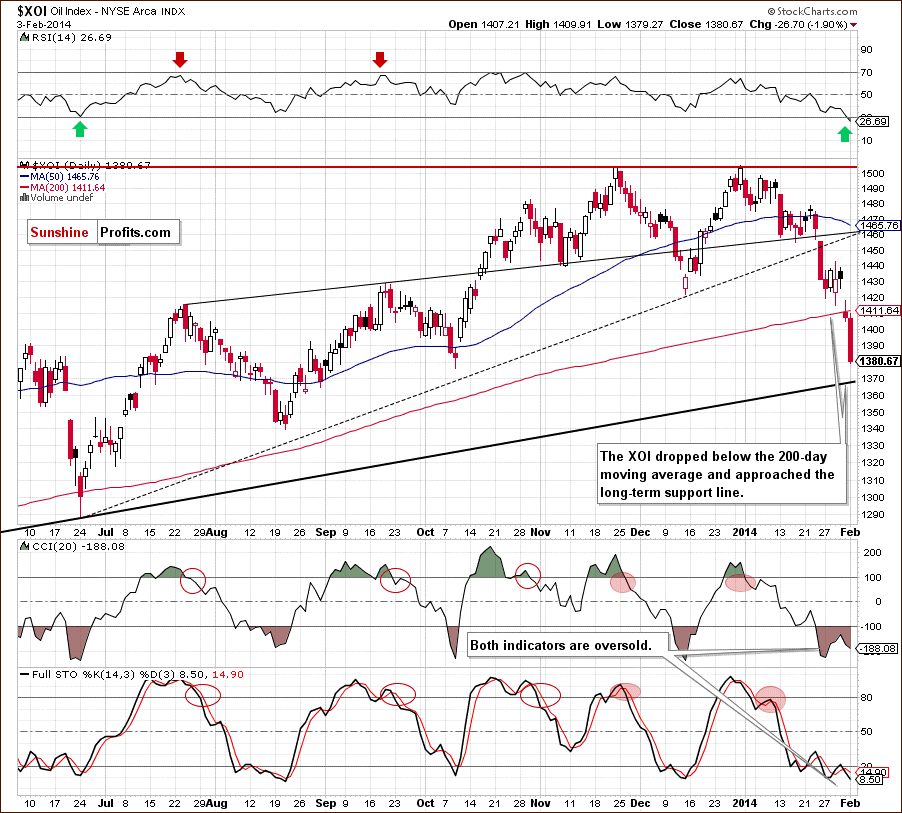
Looking at the above chart, we see that the breakdown below the lower border of the consolidation range that we saw between Jan.13 and Jan. 24 was the first step that trigger further deterioration. With this downswing, the XOI broke below two important medium-term support lines (the upper one - based on the July and September high and the lower one based on the June and December lows), which was a strong bearish signal that encouraged sellers to act. As you see on the daily chart, after a small pause around the December low, the oil stock index declined once again and broke below the 200-day moving average on Friday. This is another strong bearish signal because since July the XOI remained above this line (as a reminder, in July this moving average successfully stopped further deterioration and triggered an upward move).
From this perspective, it seems that the medium-term support line based on the April and June lows is the last stop before further falls. If it encourages buyers to act, we will likely see a corrective upswing in the coming week (or weeks). At this point, it’s worth noting that this scenario is reinforced by the position of the indicators, which are oversold and will likely generate buy signals. If this is the case, we may see an upward move and the first upside target would be the 200-day moving average.
Summing up, from the long-, medium- and short-term perspectives, the situation has deteriorated significantly as the oil stock index broke below the long-and medium-term support lines. On top of that, the XOI also broke below the 50-week and 200-day moving averages, which is a strong bearish signal – especially when we take into account the fact that these moving averages successfully stopped declines in the past. The long-, medium- and short-term outlook for oil stocks is bearish. Nevertheless, we should keep in mind that the XOI approached two important medium-term support lines - one based on the April and June lows (currently around 1,368) and the lower border of a rising wedge (marked with a bold red line on the weekly chart). The proximity to these lines (in combination with the position of the medium- and short-term indicators) may encourages oil bulls to act and trigger an upward correction in the coming week (or weeks). From today’s point of view, it seems that the initial upside target for buyers would be the 200-day moving average.
Crude Oil - Oil Stocks Link
Having discussed the current situation in crude oil and the oil stock index, let’s comment on the relationship between them.
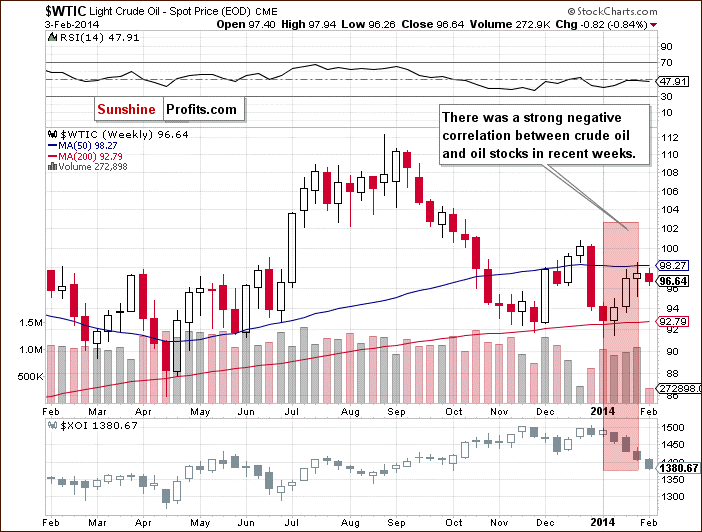
When we take a look at the above chart and compare the price action in both cases, we see that a strong negative correlation between crude oil and oil stocks came back in the previous weeks. Since the beginning of January, light crude extended gains and erased over 75% of the Dec.-Jan. decline. Meanwhile, the XOI declined sharply breaking below important long- and medium-term support lines, which clearly shows its weakness in relation to crude oil in the previous month. If this negative relation between light crude and oil stocks remains in place, it will likely give us some interesting clues about future movements of crude oil.
Ratio Analysis
Taking the above into account, let’s take a closer look at the oil-stocks-to-oil ratio. What impact could it have on future oil moves? Let’s start with the long-term chart.
Quoting our last Oil Investment Update:
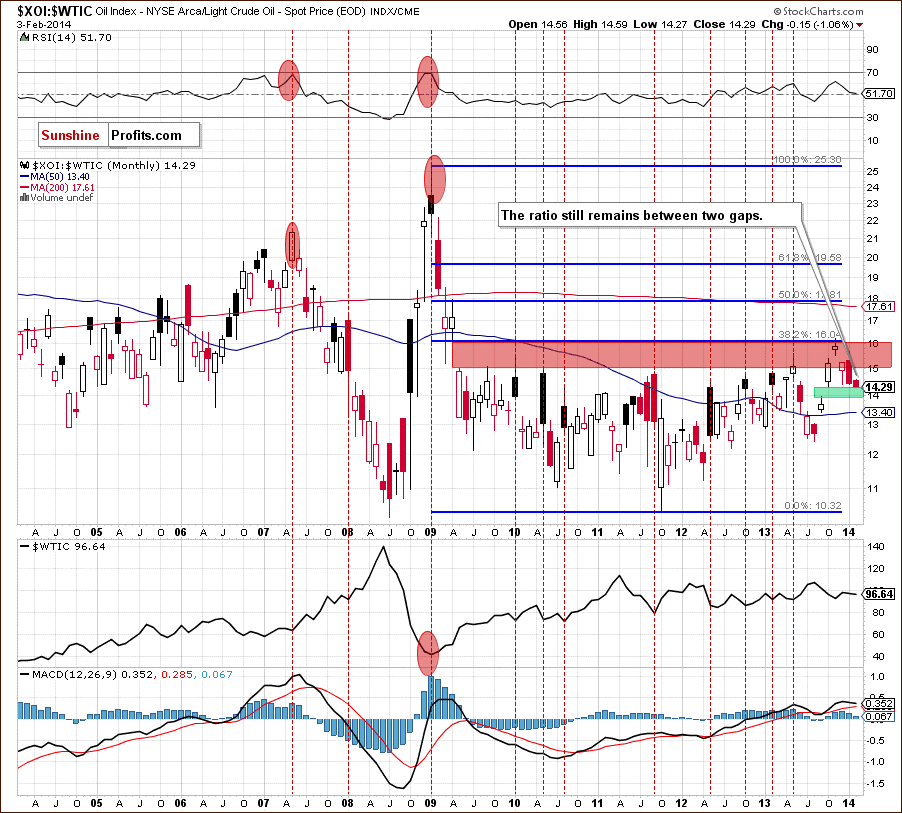
(…) the ratio moved higher and reached the strong resistance zone created by the 38.2% Fibonacci retracement level (based on the entire 2009-2011 decline) and the lower line of the gap between the April 2009 low and the May 2009 high (marked with the red rectangle) once again. We saw similar situation in November. Back then, this strong resistance zone stopped further growth and preceded higher values of light crude. If history repeats itself once again, we will likely further improvement in crude oil in the coming month.
As you noticed on the above chart, we saw such price action in the previous month. The ratio bounced down the strong resistance zone (triggering a rally in crude oil) and declined to the gap between the September high and October low (marked with the green rectangle). If this support stops further deterioration, we will likely see a corrective upswing in the ratio and a pullback in crude oil – similarly to what we noticed last year. Nevertheless, we should keep in mind that the strong resistance zone which successfully stopped ratio’s increases in November and also in January will likely work once again. Therefore, from this point of view, the space for further declines in crude oil seems limited.
Let’s take a look at the weekly chart.
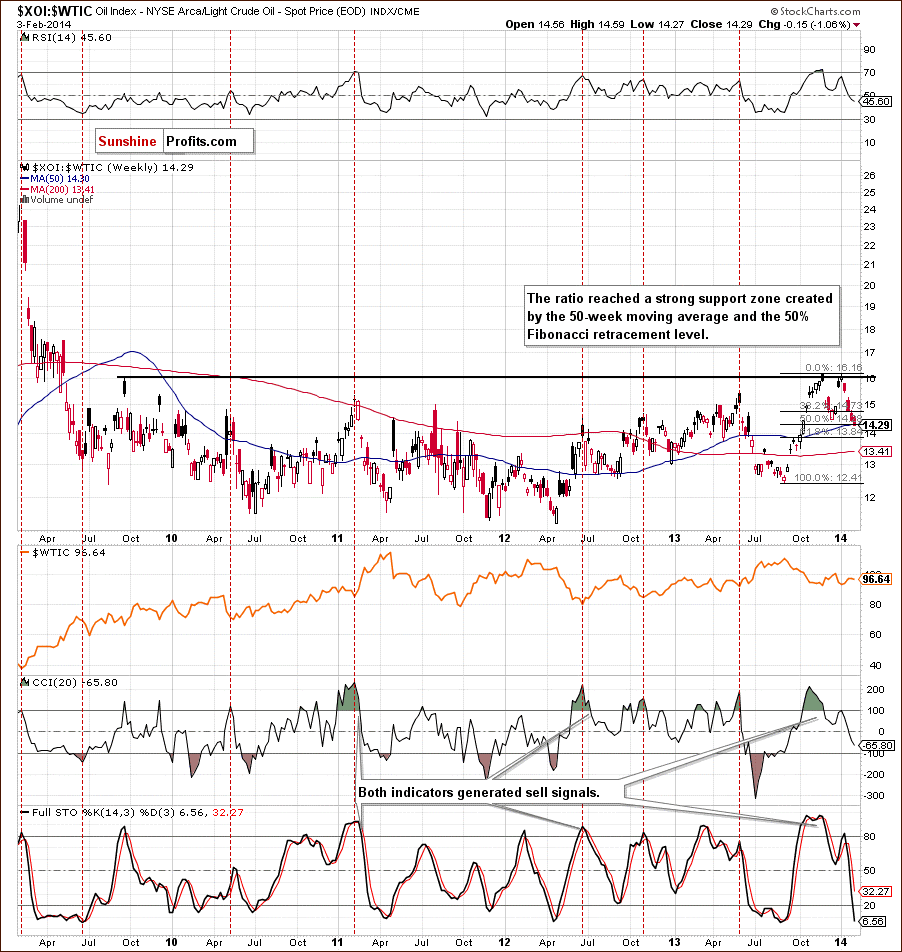
From this perspective, we see that the ratio corrected 50% of the recent rally and reached the 50-week moving average. As you see on the above cart, this moving average had a positive impact on the ratio in the past. As a reminder, it successfully stopped declines in August and December 2012, and later in April and June 2013. Back then, it triggered upward moves in the ratio. Taking this fact into account (and combining with the gap on the monthly chart and the 50% Fibonacci retracement level), it seems that this strong support may trigger an upward corrective move in the ratio. If this is the case, we could see lower values of crude oil in the coming week (or weeks). Nevertheless, as mentioned earlier, the space for further increases in the ratio (and declines in crude oil) seems limited.
Please note that sell signals generated by the indicators remain in place supporting the bearish case. From this point of view, if this strong support is broken, the ratio will extend its decline and the downside target will be the next Fibonacci retracement. In this case, such a big drop in the ratio may trigger further improvement in crude oil.
Having discussed the above, let’s examine the oil-to-oil-stocks ratio.
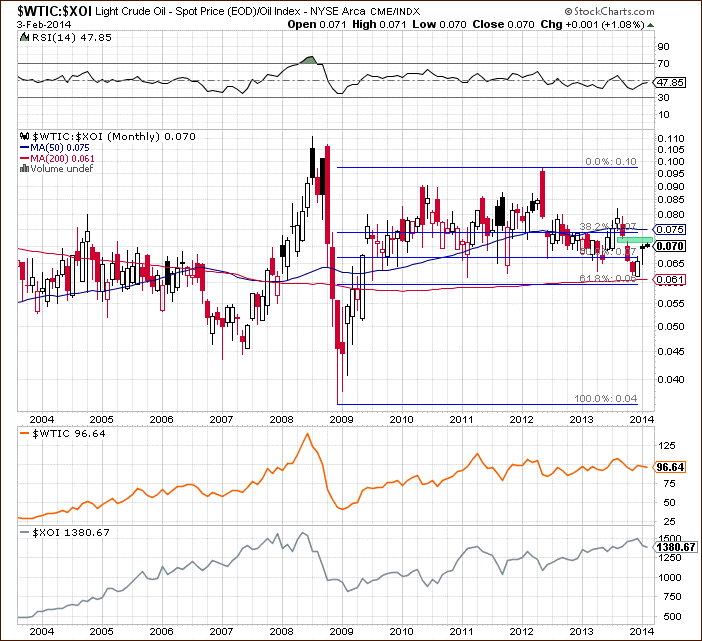
On the above chart, we see that the ratio rebounded and came back above the previously-broken the 50% Fibonacci retracement, which is a positive signal. However, with this upward move the ratio reached the gap between the September low and the October high. If this resistance stops further improvement, we may see a post double top decline in the coming month, which would have a negative impact on the price of light crude. On the other hand, if it is broken, we will likely see an upward move and the next upside target will be the 50-month moving average.
Let’s take a look at the weekly chart.
Quoting our previous Oil Investment Update:
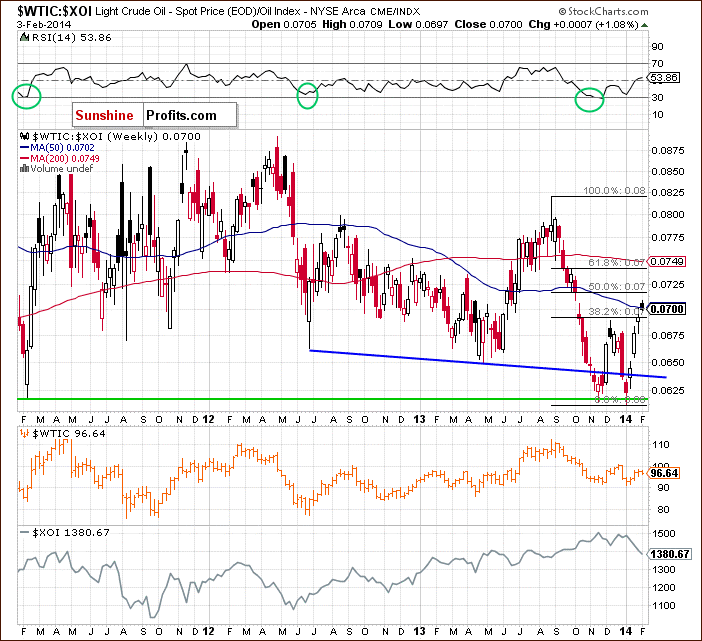
(…) the ratio declined below the medium-term support line (similarly to what we saw in November) and approached the 2013 low. Taking this fact into account, we may see a doule bottom formation in coming week (or weeks). If this is the case, it will likely trigger an upswing in the ratio, which will translate into higher prices of light crude. Additionally, the RSI slipped to slightly above the level of 30, which supports the bullish case.
As you see on the above chart,the ratio rebounded sharply after a small drop below the previous 2013 low invalidating the breakdown below the medium-term support line (similarly to what we saw at the beginning of December). This was a strong bullish sinal that triggered further improvement. In this way, the ratio broke not only above the December high, but also the 38.2% Fibonacci retracement level (based on the entire Aug.-Jan. decline) and reached the 50-week moving average. Yesterday, the ratio slipped below this line and it seems that this resistance will pause (or even stop) further growth. If this is the case, we will likely see a pullback in the ratio which trigger a pullback in crude oil.
Once we know the above, let’s focus on the oil-to-stocks ratio. Will it give us some interesting clues about crude oil’s future moves?
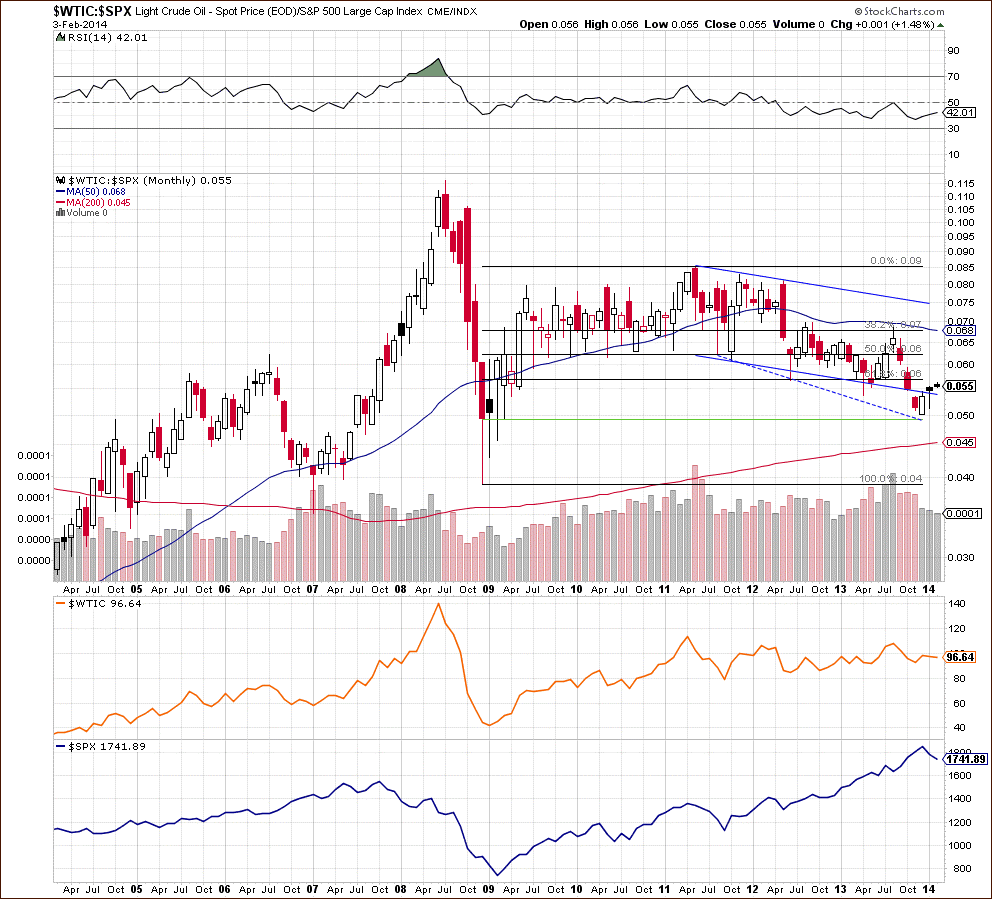
In our previous Oil Investment Update, we wrote:
(…) the horizontal support created by previous lows worked particularly well in the past - it was almost flawless between mid-2009 and early 2011, and you can see double-bottom formations in many other cases, for instance in October 2012 and mid-2013. We now have this ratio at the Nov 2013 low, which is quite likely to provide strong support, given the efficiency of the previous horizontal support levels. This is a strong bullish sign.
Looking at the above chart, we see that the ratio didn’t drop to a fresh four-year low in January and rebounded after approaching the December low. This was a very positive signal which triggered an upward move that took the ratio above the lower border of the declining trend channel. In this way, the ratio invalidated the breakdown below this line once again. Please note that similar price action in the past triggered further improvement in the ratio (and also in crude oil). If history repeats itself once again, we will likely see higher values in both cases in the coming months.
Let’s take a look at the weekly chart.
On the above chart, we see that the ratio broke above the December high and approached the 38.2% Fibonacci retracement level based on the entire Aug.-Dec. decline. From this perspective, the proximity to this resistance may trigger a pullback in the coming week. Please note that even if the ratio climbs higher, this strong resistance level will likely stop further growth and push the ratio (and also crude oil) lower. Nevertheless, we should keep in mind that the space for declines will likely be limited by the lower border of the trend channel.
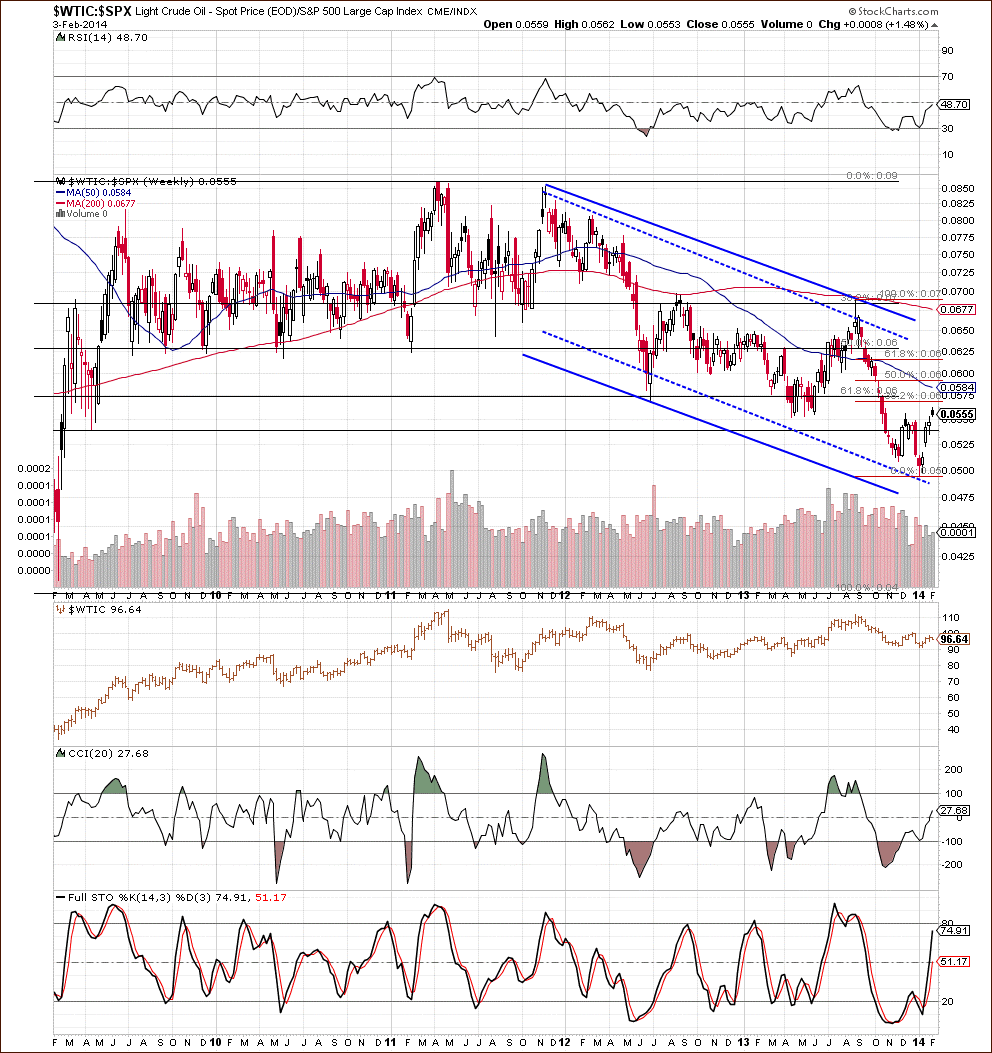
Before we summarize, we would like draw your attention to the non-USD (WTIC:UDN ratio) chart of crude oil once again. As a reminder, UDN is the symbol for the PowerShares DB US Dollar Index Bearish Fund, which moves in the exact opposite direction to the USD Index. Since the USD Index is a weighted average of the dollar's exchange rates with world's most important currencies, the WTIC: UDN ratio displays the value of crude oil priced in "other currencies".
Quoting our last Oil Investment Update:
(…)the first thing that catches the eye on the above chart is the long-term rising support line (marked in green) based on the August 2011 and June 2012 lows. As you see on the monthly chart, this strong support succesfully stopped declines in April and also in November 2013. Therefore, if history repeats itself once again, this line will likely stop further deterioration in crude oil this month.
As you see on the above chart, this long-term rising support line (marked in green) successfully stopped declines in the previous month and triggered a corrective upswing. Please note that November and December candlesticks formed a bullish engulfing pattern. Additionally, we noticed a double bottom after last month’s decline. On top of that, slightly below the long-term support line is the 50-month moving average. All the above facts support the bullish case and we can conclude that as long as crude oil priced in "other currencies" remains above this strong support zone, the space for correction is limited.
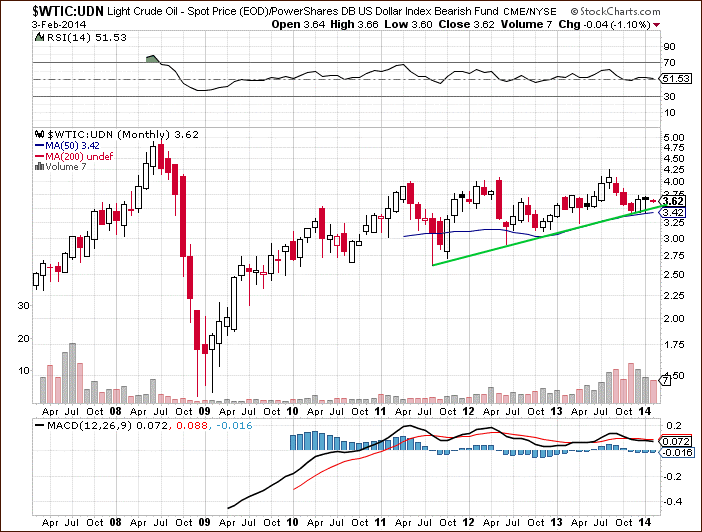
To see the current situation more clearly, let’s take a look at the weekly chart.
On the above chart, we see that crude oil rebounded sharply after reaching the long-term rising support line and a strong support zone created by the 200-week moving average and the 61.8% Fibonacci retracement level. With this upward move, light crude reached the 50-week moving average and approached the December high (which created a bearish engulfing pattern). Taking these facts into account, it seems that we may see a pullback in the coming week (or weeks). Nevertheless, as mentioned earlier, the space for correction is limited.
Scenarios
Just like a month ago, today’s Oil Investment Update includes scenarios of what could happen in the coming weeks. Naturally, we will continue to monitor the market in the coming days and if anything invalidates our long-term outlook we will send you an additional message.
- Bullish scenario
Looking at the medium- and short-term charts of crude oil (from dollar and non-USD perspectives) and all ratios, it seems that we will likely see a bigger pullback in the coming week (or weeks). In this case, the current corrective move will likely stop around one of the major Fibonacci retracement level: $95.78 (38.2%), $94.92 (50%), $94 (61.8%) or $93 (76.4%). Please note that the level of $93 is also reinforced by the 200-week moving average. After this correction, we will likely see further improvement in crude oil – especially if the price climbs above $100. - Bearish scenario
From today’s point of view, it seems unlikely, but if crude oil drops below the January low and breaks below blue lines (marked on the weekly chart) and the 61.8% Fibonacci retracement level (based on the entire Jun. 2012-Aug. 2013 rally) we will likely see further deterioration and the downside target for the sellers will be the long-term rising support line based on the November 2012 and April 2013 lows (currently around $90).
Summary
Although the situation from the long-term perspective hasn’t changed much in the previous month, the medium- and short-term outlook has improved as crude oil invalidated the breakdown below the lower border of the rising trend channel. With the recent rally, light crude reached the 50-week moving average and approached the strong resistance zone created by the 200-day moving average and the 38.2% Fibonacci retracement level based on the entire Aug.-Dec. decline. Additionally, crude oil priced in "other currencies" also reached its 50-week moving average and approached the December high (which created a bearish engulfing pattern). Taking these facts into account (and combining with the position of the short-term indicators), it seems that we will see a bigger pullback in the near future.
The oil-stocks-to-oil , oil-to-oil-stocks and oil-to-stocks ratios reached important support/resistance levels, which suggests that they may reversed and have a negative impact on the price of light crude in the coming week (or weeks).
On top of that, a negative correlation between crude oil and oil stocks came back in the previous weeks. As mentioned earlier, the XOI approached two important medium-term support lines and it seems that the proximity to these lines (in combination with the position of the medium- and short-term indicators) may encourages oil bulls to act and trigger an upward correction in the coming week (or weeks). Therefore, if the recent negative relation between light crude and oil stocks remains in place, we will likely see a pullback in the case of crude oil.
All the above provide us with bearish implications (in the short term) and, from today’s point of view, a move to the downside is likely to be seen. Nevertheless, we should keep in mind that as long as crude oil (priced in U.S. dollars) remains above the 200-week moving average and the bullish engulfing pattern (on the monthly chart) is not invalidated, it seems unlikely that we see a decline below the January low – especially if crude oil priced in "other currencies" remains above the long-term rising support line (marked in green) and the bullish engulfing pattern remains in play.
On the other hand, a strong resistance zone created by the 200-day moving average (currently at $99.20), the 38.2% Fibonacci retracement level based on the entire Aug.-Dec. decline (at $99.22), the 50-week moving average (currently at $98.27) and the long-term declining resistance line (currently around $100) keeps further growth in check. Therefore, it seems that we will likely see a bigger upward move, if crude oil breaks above this area.
Very short-term outlook: mixed with bearish bias
Short-term outlook: bullish
MT outlook: mixed
LT outlook: mixed
Bullish scenario: If the price of light crude increases above $100, we’ll open long positions.
Bearish scenario: If crude oil drops below $90, we’ll consider opening short positions.
This completes this week’s Oil Investment Update. Our next Oil Investment Update is scheduled for Thursday, March 6, 2014. Oil Trading Alerts subscribers will additionally receive similar but shorter alerts on a daily basis (or more than once a day when the situation requires it). You – Oil Investment Updates subscribers – will receive short Investment Alert messages should the outlook for the medium or long term change before the next Update is posted.
Thank you.
Nadia Simmons
Forex & Oil Trading Strategist
Oil Investment Updates
Oil Trading Alerts

