

U.S. consumer spending rose 0.1 percent in August. What does it mean for the gold market?
Consumer Spending Weak in August
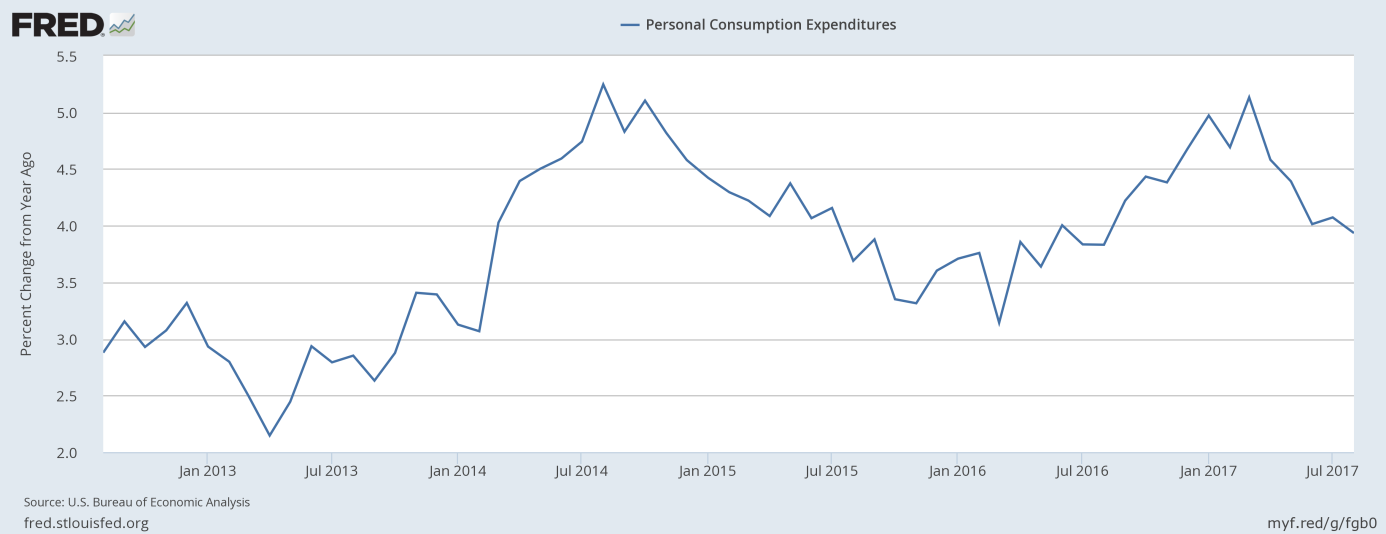
Personal consumption expenditures increased 0.1 percent in August, following a 0.3 percent rise in July. The rise was soft, but in line with expectations. However, spending declined for the first time since January (0.1 percent drop), if adjusted for inflation. The fall was driven mainly by fewer sales of new cars and trucks. But the results reflect also the effects of hurricane Harvey that made landfall in Texas on August 25, so there might be a rebound in the next months. On an annual basis, consumer spending rose 3.9 percent, which means that the pace of personal consumption expenditures growth decreased further, continuing its downward trend since March 2017, as one can see in the chart below.
Chart 1: Personal consumption expenditures from 2012 to 2017 (as percent change from year ago).
Personal Incomes As Bright Side of Report
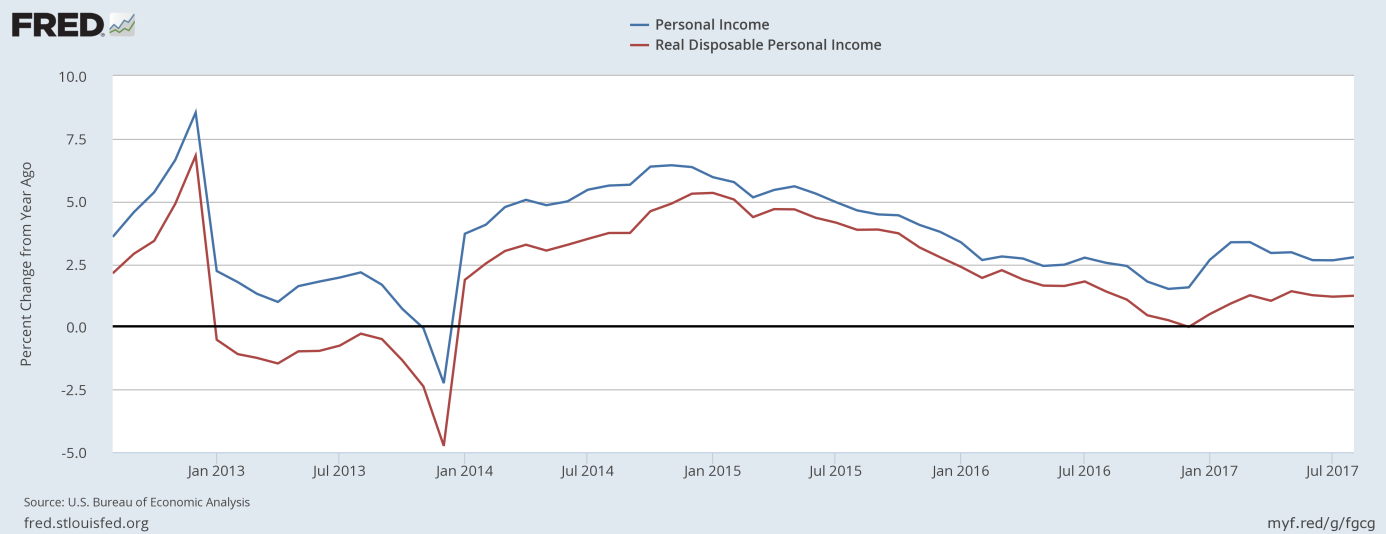
The income side of the report was better. Indeed, personal incomes rose 0.2 percent in August, following a 0.3 percent increase in the previous month. It means a slowdown, but it was in line with expectations. What is more worrisome is that real disposable personal income declined 0.1 percent in August. And that wages and salaries were unchanged in August. However, both nominal personal incomes and real disposable incomes accelerated slightly on an annual basis, as the chart below shows.
Chart 2: Nominal personal income (blue line) and real disposable personal income (red line) over the last 5 years (as percent change from year ago).
Inflation Still Subdued
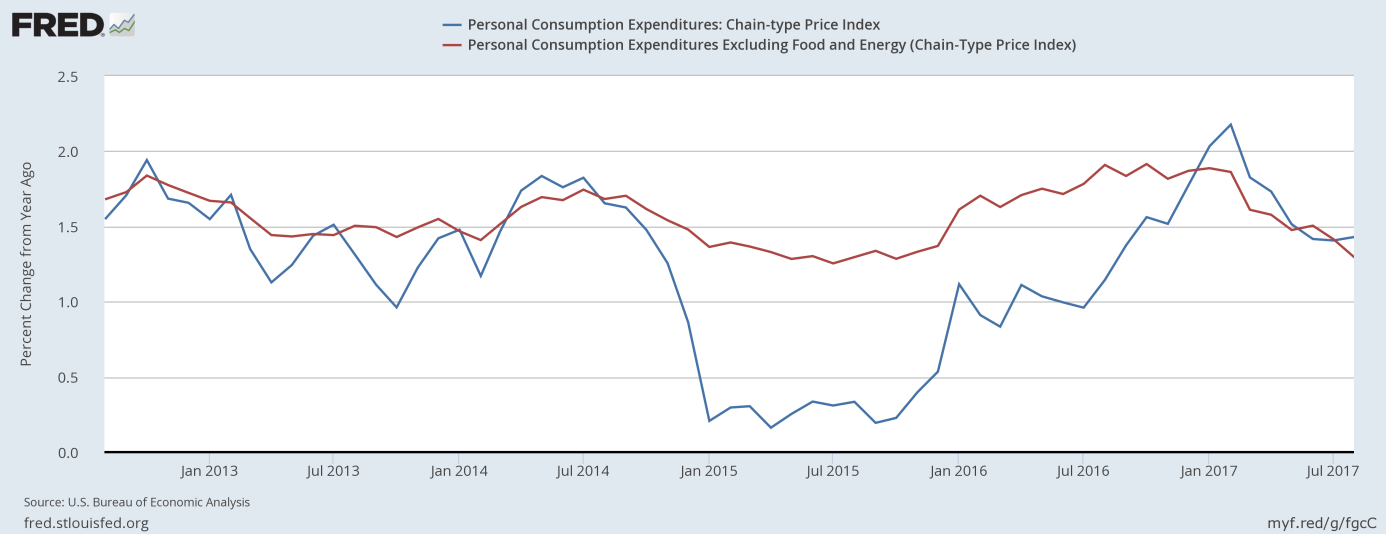
What is perhaps most important is that inflation remained subdued in August. The PCE price index rose 0.2 percent, following a 0.1-percent increase in July. Meanwhile, the core version of the index rose 0.1 percent for the fourth month in a row. On an annual basis, the PCE price index rose 1.4 percent, the same as in July and June. The core version jumped 1.3 percent, less than in previous months. It means a negative surprise for analysts who expected stronger inflation. It also implies that inflation retreated even further from its five-year peak in February, as one can see in the chart below.
Chart 3: PCE Price Index (blue line) and Core PCE Price Index (red line) from 2012 to 2017 (as percent change from year ago).
Subdued Inflation and Gold
The further slowdown in inflation could strengthen the doves’ camp at the Federal Reserve. As a reminder, inflation was soft despite the impact of hurricane Harvey, which was thought to temporary raise prices. However, the market odds of a Fed hike in December actually rose after the publication of the report from almost 73 percent to about 83 percent. Hence, investors should not count on the reversal of the Fed’s gradual tightening. As Yellen said last week in Cleveland, “it would be imprudent to keep monetary policy on hold until inflation is back to 2 percent.” Thus, given the current market expectations, the U.S. central bank is likely to deliver an upward move at the end of the year. This is not good news for the gold market. And indeed, despite disappointing spending data and subdued inflation, the price of gold declined on Friday, as one can see in the chart below.
Chart 4: Gold prices from September 29 to October 2, 2017.
Conclusions
The bottom line is that the August report about U.S. personal incomes and outlays was weak, but the gold prices did not manage to rise, which is bearish. The number should not change the Fed’s course – and the prospects of a December hike are a significant headwind for the yellow metal. Another short-term bearish factors are the decline in the EUR/USD exchange rate due to a tumultuous independence vote in Spain’s Catalonia and the absence of Chinese investors who enjoy a national holiday until October 9. Stay tuned!
If you enjoyed the above analysis, we invite you to check out our other services. We focus on fundamental analysis in our monthly Market Overview reports and we provide daily Gold & Silver Trading Alerts with clear buy and sell signals. If you’re not ready to subscribe yet and are not on our mailing list yet, we urge you to join our gold newsletter today. It’s free and if you don’t like it, you can easily unsubscribe.
Disclaimer: Please note that the aim of the above analysis is to discuss the likely long-term impact of the featured phenomenon on the price of gold and this analysis does not indicate (nor does it aim to do so) whether gold is likely to move higher or lower in the short- or medium term. In order to determine the latter, many additional factors need to be considered (i.e. sentiment, chart patterns, cycles, indicators, ratios, self-similar patterns and more) and we are taking them into account (and discussing the short- and medium-term outlook) in our trading alerts.
Thank you.
Arkadiusz Sieron
Sunshine Profits‘ Gold News Monitor and Market Overview Editor
Gold News Monitor
Gold Trading Alerts
Gold Market Overview

