According to the Fed, industrial production decreased 0.6 percent in March. What does it mean for the Fed’s monetary policy and gold market?
Industrial Production Still in Recession
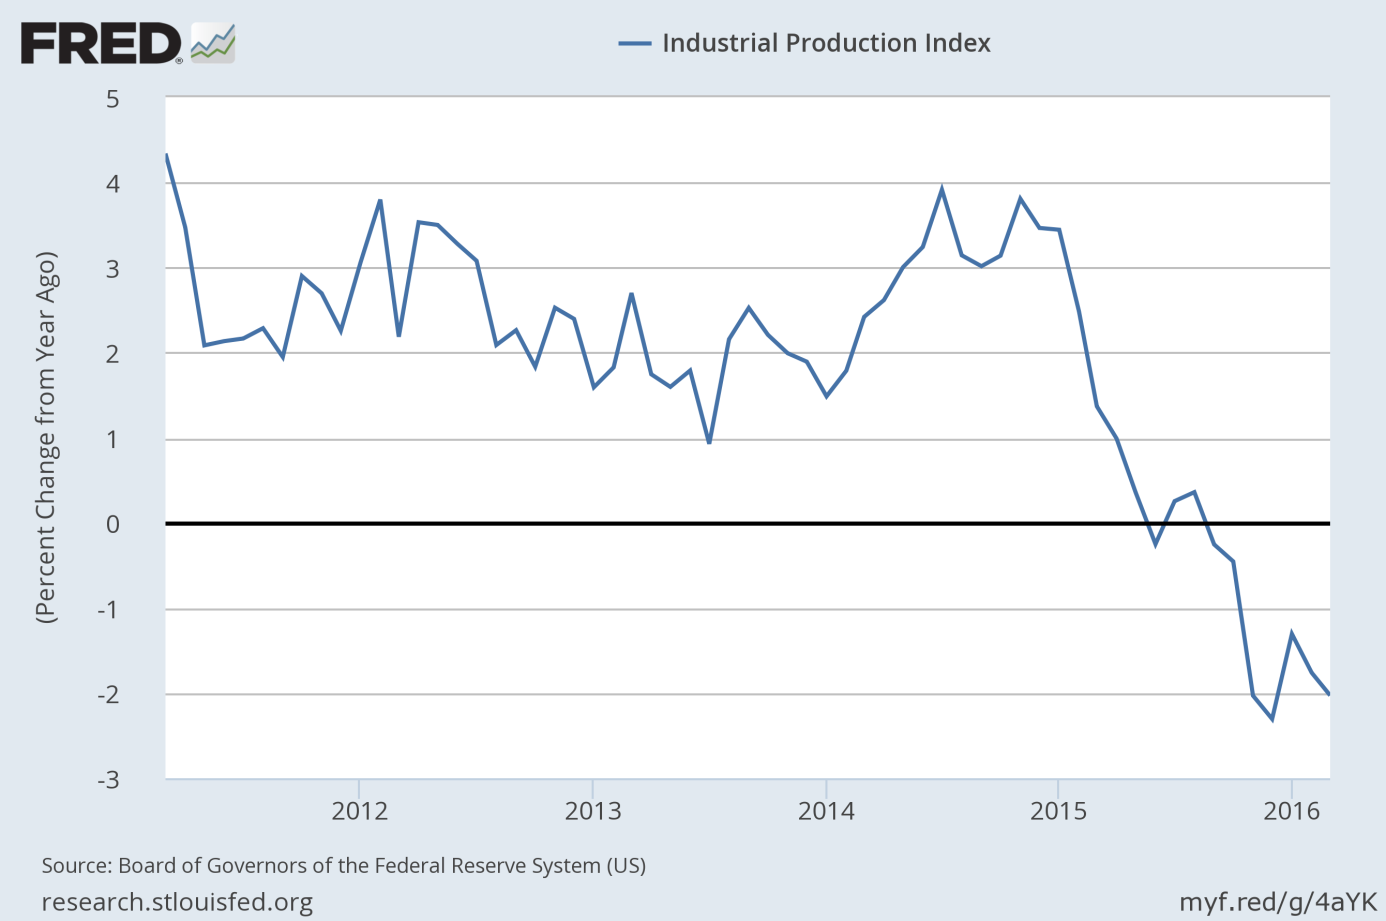
Last week was rich in economic data. We have already analyzed the impact of March retail sales and the CPI on the gold market. Today, we focus on industrial production, which contracted 0.6 percent for a second month in a row. It was the sixth decline in the past seven months, much bigger than the economists’ expectations (the Bloomberg Econoday consensus estimate for industrial production was -0.1% in a range of -0.5 to +0.4 percent). For the first quarter as a whole, industrial production fell at an annual rate of 2.2 percent. On an annual basis, industrial basis fell 2.0 percent, marking the seventh month of declines in a row, as one can see in the chart below. Therefore, the annual dynamics of industrial production looks recessionary, as the U.S. economy has never witnessed such a long contraction in industrial output without being in a recession.
Chart 1: Industrial Production (as percent change from year ago) from 2006 to 2016.

The weakness was widespread, as mining plunged 2.9 percent, utilities declined 1.2 percent and manufacturing dropped 0.3 percent. Interestingly, the latter component was pulled down by a 1.6 percent contraction in vehicle production. Moreover, capacity utilization for the industrial sector decreased 0.5 percentage point in March to 74.8 percent, a rate that is 5.2 percentage points below its long-run (1972–2015) average. Although there have recently been some encouraging signs that the sector is stabilizing (e.g., the Empire State Manufacturing Index for April rose to 9.6 from 0.6 in March), the U.S. industry is still in turmoil. Additionally, there were also some revisions. With them, the contraction in industrial production has lasted seven months instead of just five under the prior assumptions. It means that the U.S. industry is much worse than previously thought, which should prompt the Fed to continue its dovish stance. Therefore, the recent report should be positive for the gold market.
Inventories Still High
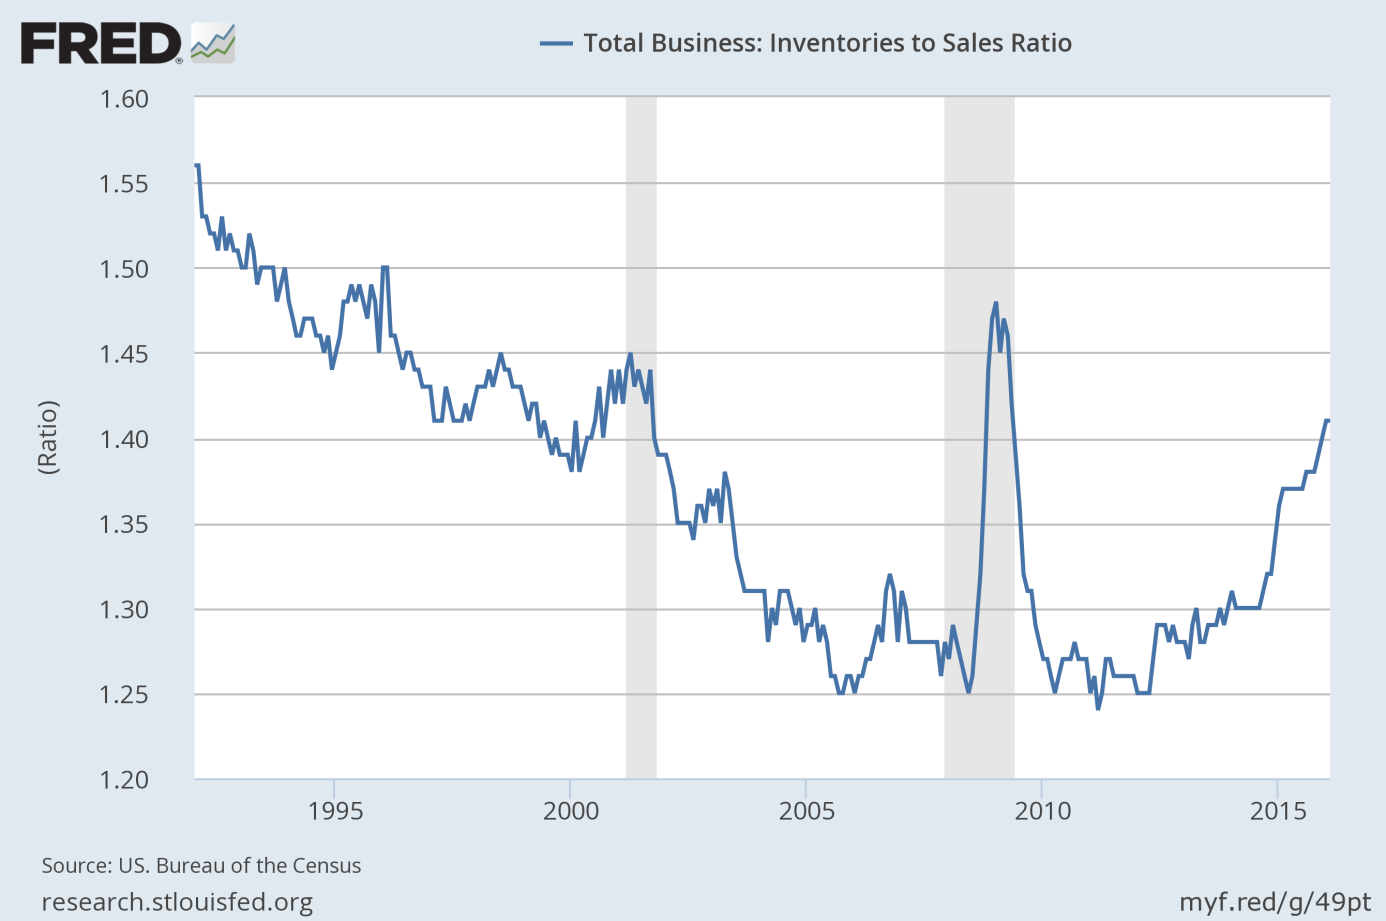
The decline in industrial output should not be surprising, since inventories are still extremely high. Indeed, the ratio of inventories to sales stayed at 1.41 in February, the highest level since the last recession, as one can see in the chart below.
Chart 2: Total business inventories to sales ratio from 1992 to 2016.

These are troubling dynamics, signaling that companies are not selling enough of what they produce. Since inventories tie up cash, companies increase them only if they are optimistic about future sales. When sales are weak, inventories jump and the inventories to sales ratio rises. The high level of inventories is important for two reasons. First, it signals oversupply, which should exert a deflationary pressure in the future, as entrepreneurs would want to sell off their stocks at reduced prices. The deflationary pressure is likely to ease further the Fed’s stance, which should be positive for the price of gold. Second, the increase in inventories adds to the GDP (inventories had to be produced), but when entrepreneurs try to reduce them, they slash orders, which reduces the production and GDP growth.
Conclusions
The key takeaway is that last week was rich in economic data. As in February, some indicators, such as retail sales and, especially, industrial production, still look discouraging in March. Moreover, the inventory to sales ratio remains high, being another indicator of an elevated risk of recession. This is good news for the gold market, since bad data is likely to reduce the confidence in the strength of the U.S. economy, which should spur some safe-haven demand for the yellow metal.
Disclaimer: Please note that the aim of the above analysis is to discuss the likely long-term impact of the featured phenomenon on the price of gold and this analysis does not indicate (nor does it aim to do so) whether gold is likely to move higher or lower in the short- or medium term. In order to determine the latter, many additional factors need to be considered (i.e. sentiment, chart patterns, cycles, indicators, ratios, self-similar patterns and more) and we are taking them into account (and discussing the short- and medium-term outlook) in our trading alerts.
Thank you.
Arkadiusz Sieron
Sunshine Profits‘ Gold News Monitor and Market Overview Editor
Gold News Monitor
Gold Trading Alerts
Gold Market Overview


