

Briefly: gold and the rest of the precious metals market are likely to decline in the next several weeks/months and then start another powerful rally. Gold’s strong bullish reversal/rally despite the USD Index’s continuous strength will likely be the signal confirming that the bottom is in.
Welcome to this week's Gold Investment Update.
Predicated on last week’s price moves, our most recently featured medium-term outlook remains the same as the price moves align with our expectations (and we remain on a streak of 11 realized – unleveraged – trades). On that account, there are parts of the previous analysis that didn’t change at all in the earlier days and are written in italics.
Generating optimism proved more challenging this week as investors began to weigh the pros and cons of pivot hopes. While lower rates initially dominated the narrative, the ramifications of a potential recession have moved into the limelight. And with the GDXJ ETF declining despite falling Treasury yields, the technicals and fundamentals continue to signal further weakness. Moreover, if (when) an economic malaise unfolds, gold, silver, and mining stocks should suffer substantial drawdowns.
We’ll begin today’s alert by dissecting the fundamentals, and then dive into the technical aspects that have proven so prescient over the last several months.
Gold Struggles Above $2,070
Although the Israel-Hamas war and rate-cut optimism have created bullish catalysts for gold, investors have shown little interest in holding long positions above $2,070. With the level near the 2020, 2022 and 2023 monthly highs, the crowd is still not sold on the prospect of much higher prices.
Furthermore, with the economic outlook continuing to darken, when bad news becomes bad news again, the PMs (especially mining stocks) could suffer mightily. For example, JOLTS job openings came in well below expectations on Dec. 5. And with the metric’s plight highly bearish for wage inflation, and therefore, consumption, more pain should confront the U.S. economy in the months ahead.
Please see below:
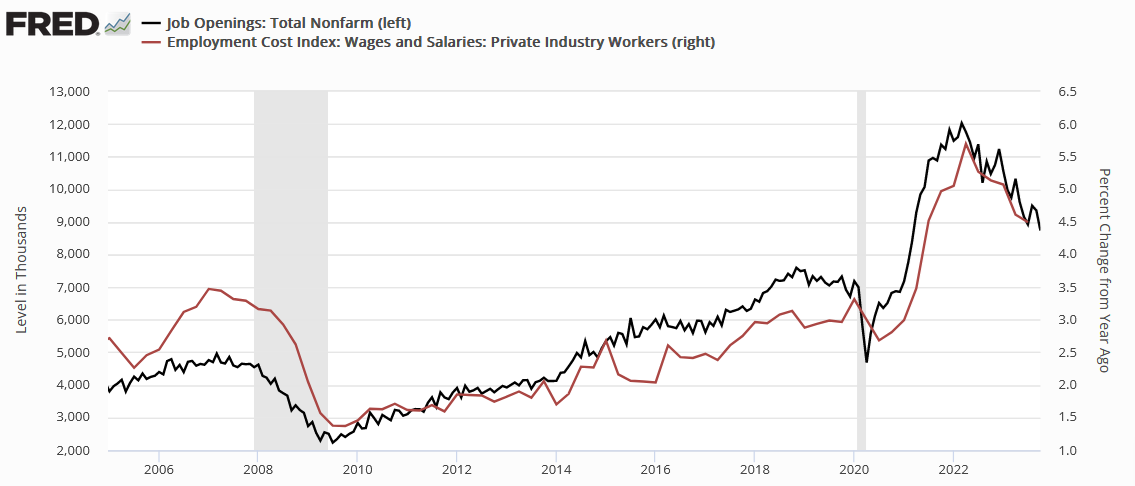
To explain, the black line above tracks JOLTS job openings, while the red line above tracks the year-over-year (YoY) percentage change in the Employment Cost Index (ECI). If you analyze the relationship, you can see that the pair often move in the same direction.
And with JOLTS’ descent signaling more downside for wages, weakening consumer spending could hurt risk assets, especially silver and mining stocks.
As further evidence, the S&P 500 often struggles mightily when job openings collapse. And this occurs because a weakening labor market hurts consumer demand and impairs corporate earnings. Consequently, JOLTS’ weakness should eventually hammer the S&P 500 and create even more trouble for the GDXJ ETF.
Please see below:

To explain, the black line above tracks JOLTS job openings, while the blue line above tracks the S&P 500. If you analyze the right side of the chart, you can see that a significant divergence has developed.
But, the S&P 500 has ignored the weakness because historical JOLTS drawdowns occurred during recessions, and one is yet to happen in this cycle. Although, with the black line poised to continue its crash and a recession likely to unfold in 2024, it could be a long way down before risk assets find a bottom.
Speaking of which, more timely data from LinkUp supports additional JOLTS weakness in 2024.
Please see below:
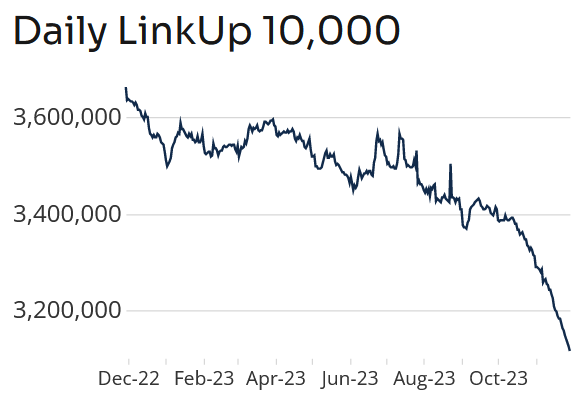
To explain, LinkUp’s job openings index has sunk like a stone over the last few months, and you can see the difference in its behavior before and after long-term interest rates rose dramatically (since September). As such, we believe risk assets still confront plenty of downside.
Debunking Rate-Cut Optimism
The recent narrative uplifting stocks and the PMs is the belief that a pivot is bullish. Conversely, pivots are not bullish, and risk assets often crash when they realize why rate cuts are occurring.
Please see below:
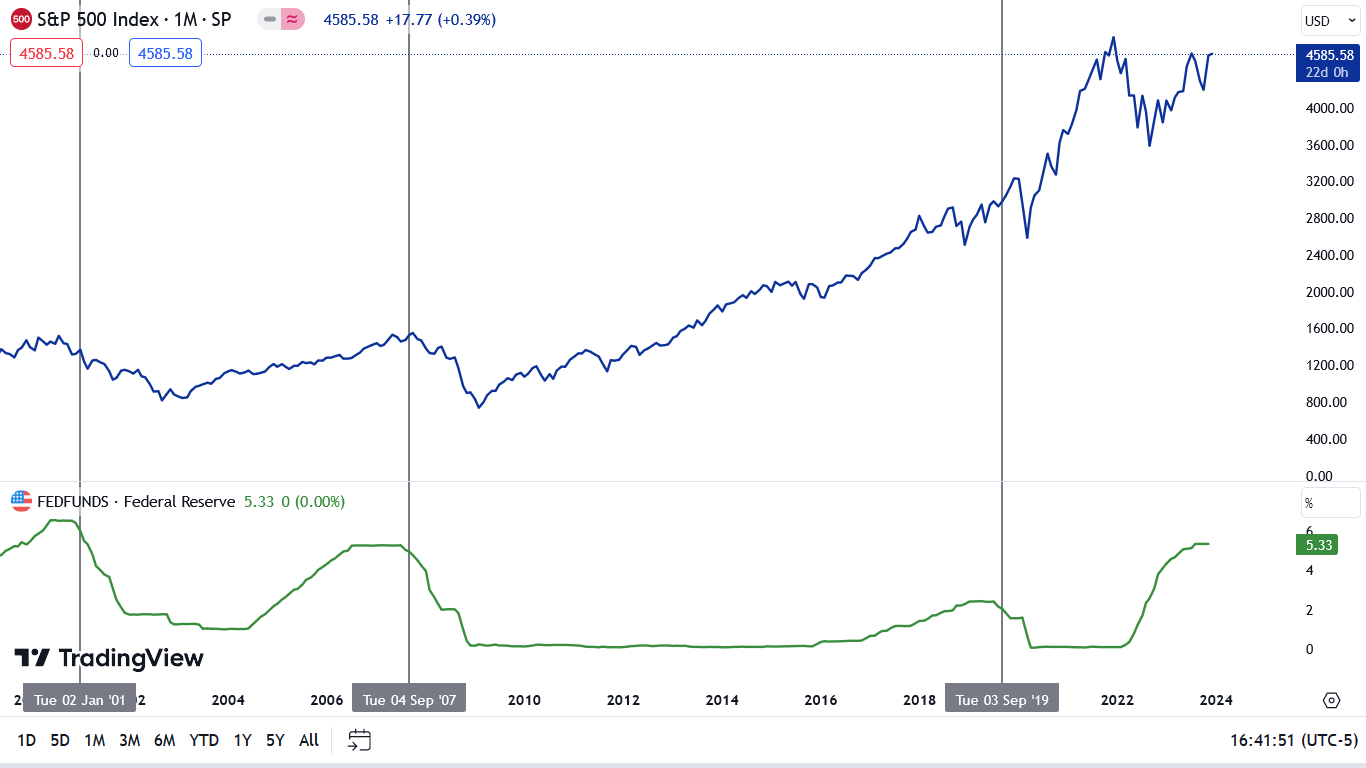
To explain, the blue line above tracks the S&P 500, while the green line tracks the federal funds rate (FFR). If you analyze the horizontal gray lines, you can see that the last three times the Fed cut the FFR, the S&P 500 was already sinking or was approaching a cliff.
Therefore, while it may seem like new highs are inevitable for all assets, the recent optimism is more of a ‘buy the rumor, sell the news’ type of trade. In other words, investors will likely bail on the S&P 500 and the GDXJ ETF when the Fed actually cuts rates. To that point, with oil prices resuming their crash, it’s a bad look for global growth when crude oil falls below $70.
Overall, the fundamentals continue to unfold as expected, with higher rates weighing heavily on the U.S. economy. And while the ‘bad news is good news’ trade remains intact, history shows it should end with sharp drawdowns of the S&P 500 and the GDXJ ETF and a meaningful rise in the USD Index.
Silver Still Underperforms Gold
While gold has dominated the headlines recently, silver and mining stocks have been material underperformers. And with the latter better barometers of investors’ enthusiasm, their relative weakness should concern the permabulls.
Likewise, with weak economic data unlikely to help silver when investors fully digest the ramifications (look past pivot optimism), a 2024 recession could push silver back to its 2022 lows.
For example, S&P Global released its U.S. Services PMI on Dec. 5. Chris Williamson, Chief Business Economist at S&P Global Market Intelligence, said:
“Firms providing both goods and services have become increasingly concerned about excessive staffing levels in the face of weakened demand, resulting in the smallest overall jobs gain recorded by the survey since the early pandemic lockdowns of 2020.”
Furthermore, after “evidence of spare capacity led to the non-replacement of voluntary leavers,” it’s another sign that the U.S. labor market has weakened. And while we warned that a recession, not inflation, is the next bearish catalyst, lower pricing pressures are normal when demand wanes at this part of the economic cycle.
Please see below:
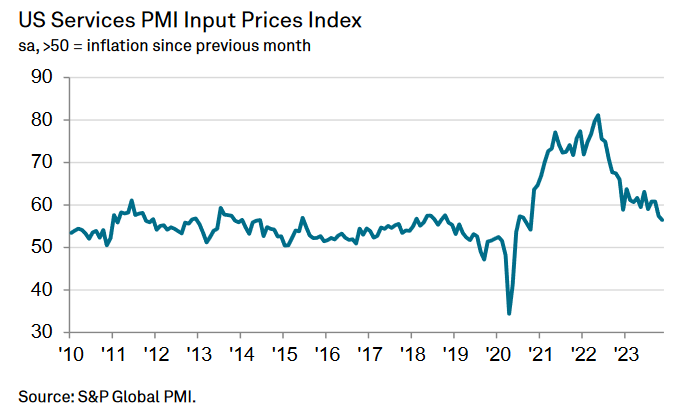
To explain, services inflation has been the primary driver of the pricing pressures as manufacturing PMIs have struggled. Thus, if (when) outright deflation occurs, risk assets like the PMs and the S&P 500 should come under heavy pressure.
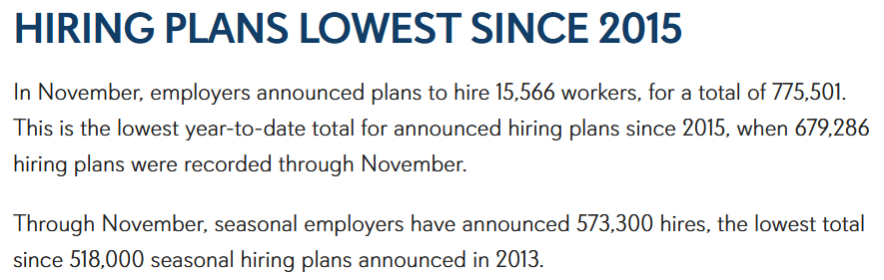
Continuing the theme, Challenger, Gray, and Christmas Inc. released its job cuts report on Dec. 7. An excerpt read:
“So far this year, companies have announced plans to cut 686,860 jobs, a 115% increase from the 320,173 cuts announced in the same period last year. It is the highest January-November total since 2020 when 2,227,725 cuts were recorded. Prior to 2020, it is the highest year-to-date total since 1,242,936 cuts were announced through November 2009.”
The report added:
“Companies are expecting slower growth in the coming months, particularly in industries that support consumers.”
Plus, with 2024 looking nothing like 2021 or 2022, the report provided more evidence of a labor market confronting serious problems, which should help spur the USD Index as volatility increases.
Please see below:
Uh-Oh Canada
The Bank of Canada (BoC) held its overnight lending rate steady on Dec. 6, as higher long-term interest rates have materially impacted the Canadian economy. The statement read:
“In Canada, economic growth stalled through the middle quarters of 2023. Real GDP contracted at a rate of 1.1% in the third quarter, following growth of 1.4% in the second quarter. Higher interest rates are clearly restraining spending: consumption growth in the last two quarters was close to zero, and business investment has been volatile but essentially flat over the past year.”
And with demand destruction poised to hit its neighbor next, the BoC added:
“In the United States, growth has been stronger than expected, led by robust consumer spending, but is likely to weaken in the months ahead as past policy rate increases work their way through the economy.”
So, while risk assets have celebrated this weakness, oil prices have run for cover. And with crude’s collapse likely to filter into other assets once they catch on, silver and mining stocks should be among the hardest hit when the drama unfolds.
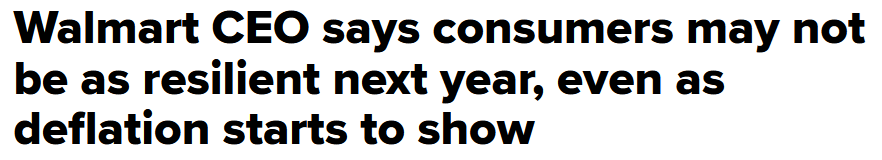
Finally, Walmart CEO Doug McMillon said that unpredictability could reign in 2024, even as deflation unfolds across the U.S.’ largest retailer. Thus, while securities are priced for a perfect landing, plenty of indicators signal a much different outcome.
Overall, silver’s strength is much more semblance than substance, as rate cuts typically occur when economic growth falters. And while investors assume they can skip the recession volatility, history suggests otherwise. As such, we believe assets like silver, the GDXJ ETF and the S&P 500 should face selling pressure in the months ahead.
The Bottom Line
The ‘bad news is good news’ trade has started to wane as investors seek the next catalyst to push prices higher. However, with economic destruction far from bullish, the pivot buyers should suffer when the scars become more obvious. Consequently, we think profound corrections are on the horizon.
In conclusion, the PMs declined on Dec. 7, as investors await the release of U.S. nonfarm payrolls. But, while volatility could be amplified, employment trends continue to move in ominous directions.
Technically Speaking
The GDXJ ETF has struggled this week as rate-cut enthusiasm has started to wane. And while the technicals remained bearish throughout the corrective upswing, they continue to showcase their might as mining stocks lack the fuel for a meaningful rally. Consequently, my comments from yesterday remain up to date, and I expect resistance to build in the days ahead.
Some say that war never changes, and in some aspects, that’s true. But markets’ reactions to war are also remarkably similar.
What I’m going to start today’s analysis with is not something you’ll read in many places. Usually, analysts are either following just the technicals or just the fundamental aspects of a given market. But the true edge comes from combining both worlds. From really understanding the basics and then applying them in ways that are not necessarily popular, but that work remarkably well, nonetheless.
So, the key rule behind the technical analysis is that the history rhymes. Similar situations price- and volume-wise trigger similar emotional responses, which in turn trigger similar reactions to news or events, regardless of what they are. As humans don’t become less emotional – in general – over time, technical analysis continues to work, and we can compare the same patterns across various times, even though the geopolitical situation in the world changes dynamically.
The next key thing that I want to emphasize is that markets react to expectations and concerns much more than they react to facts. In fact, sometimes markets can move in the opposite way to what a given news release “should” cause, just because the expectations were missed. Remember when stocks plunged in 2008 after Bernanke cut rates by 0.75%? Pointless? Maybe so, but the market expected an even bigger move.
This is exactly why fear or concern about a major military conflict is something that is much more likely to cause the markets to move than the conflict itself.
The below chart from Google Trends shows just how significantly the concern with “war” increased and then… It faded away, even though the wars themselves haven’t.
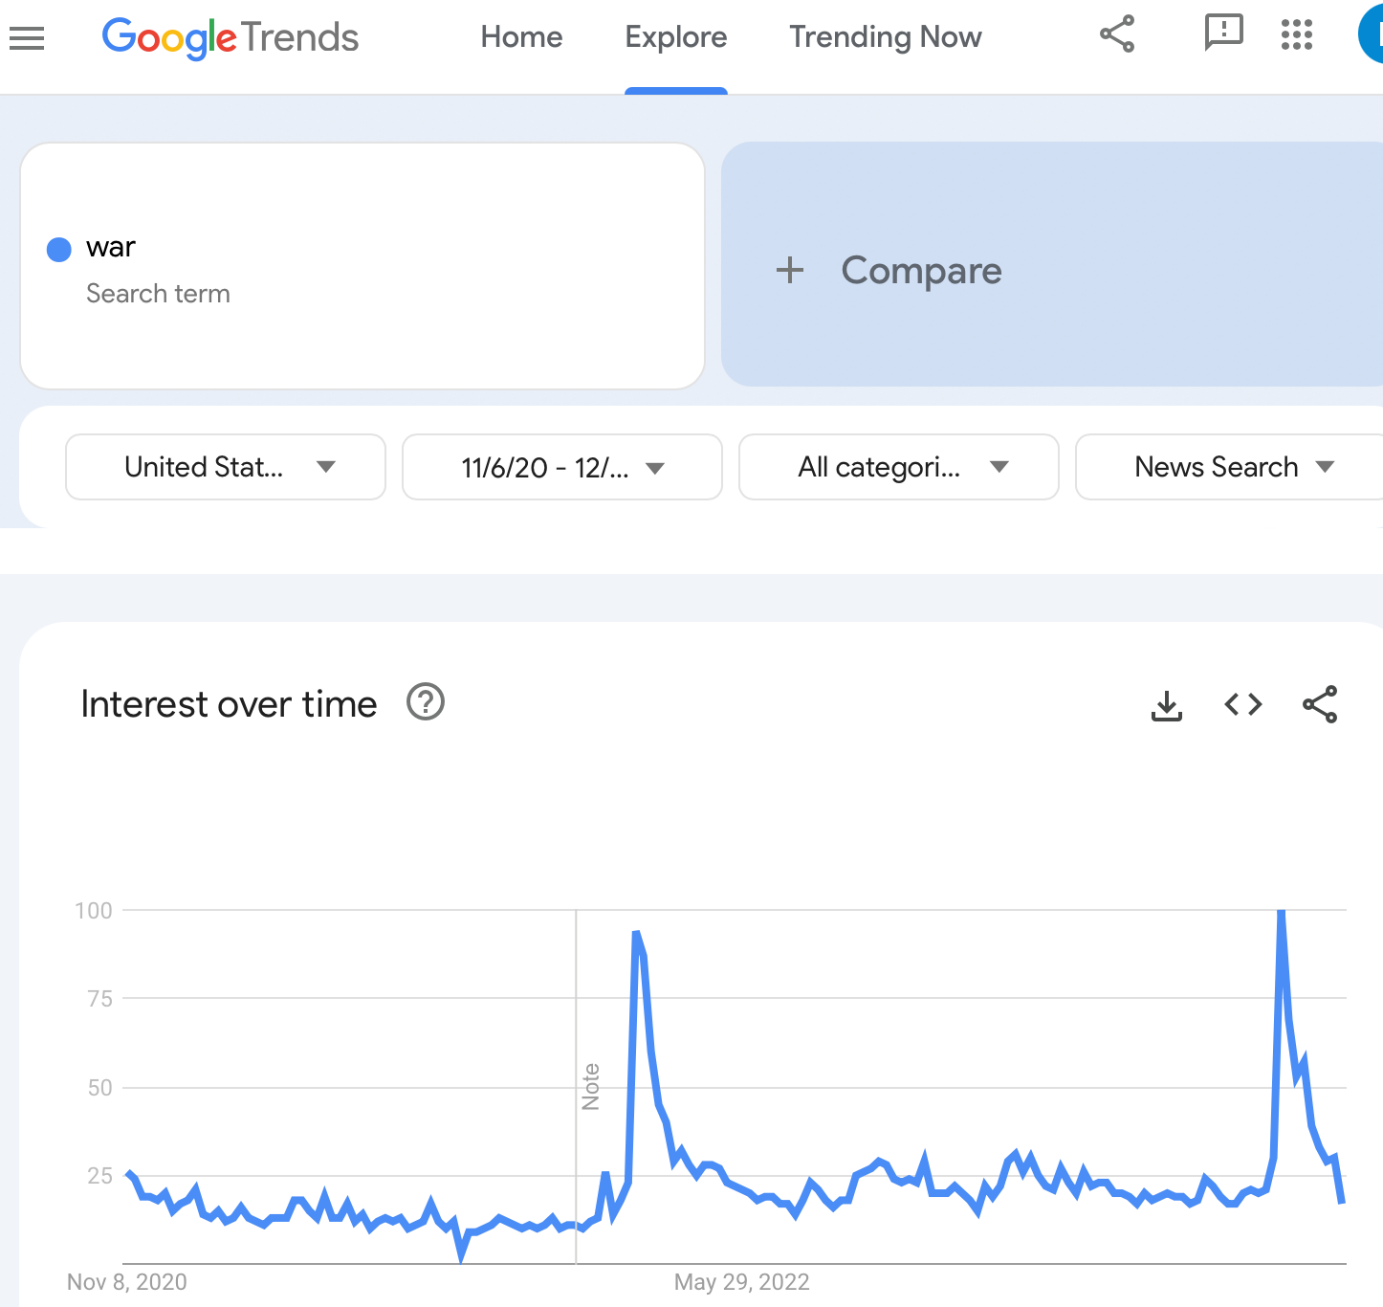
The first spike is the increase that we saw right before the Russian invasion, and the second one is based on the recent events in the Middle East.
And here’s where it gets really interesting.
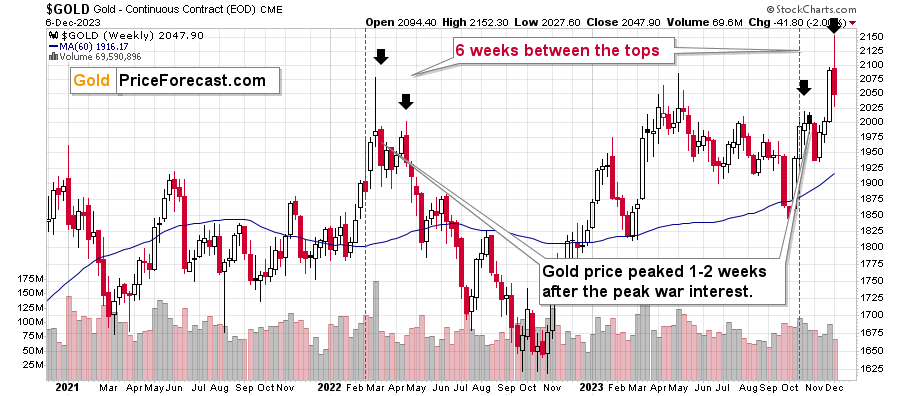
Gold topped 1-2 weeks after the above-mentioned concern peaked. That happened in early 2022, and it happened recently.
Then, back in 2022, we saw a small decline and then the gold price rallied once more before starting its huge decline.
There were six weeks between the initial and the final top, and I marked both of them with black arrows.
What happened recently?
The same thing!
Not to the letter, of course, as there are always some differences. In this case, it’s the second top that’s higher, and not the first one, like in 2022.
However, the time between both tops is once again six weeks! This is a remarkable accuracy in the analogy.
This means that the implications of the entire post-peak-concern pattern are very much up-to-date. This is huge because the follow-up action in 2022 was very significant. Gold prices declined by hundreds of dollars, and junior mining stock prices were approximately cut in half. Yes, in half.
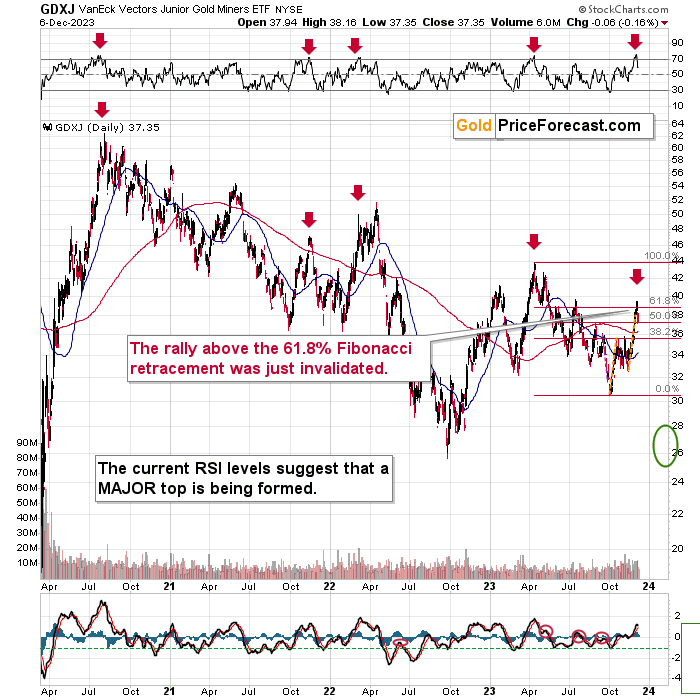
The GDXJ topped at $51.65 in April 2022, and then it bottomed at $25.67 in September, 2022, that’s over 50% lower.
The GDXJ just topped below $40… Is it possible to decline to $20? Of course, the market just has to do what it already did.
Oh, and by the way, this entire analogy doesn’t end with the precious metals market. We can see it also in stocks and in copper.
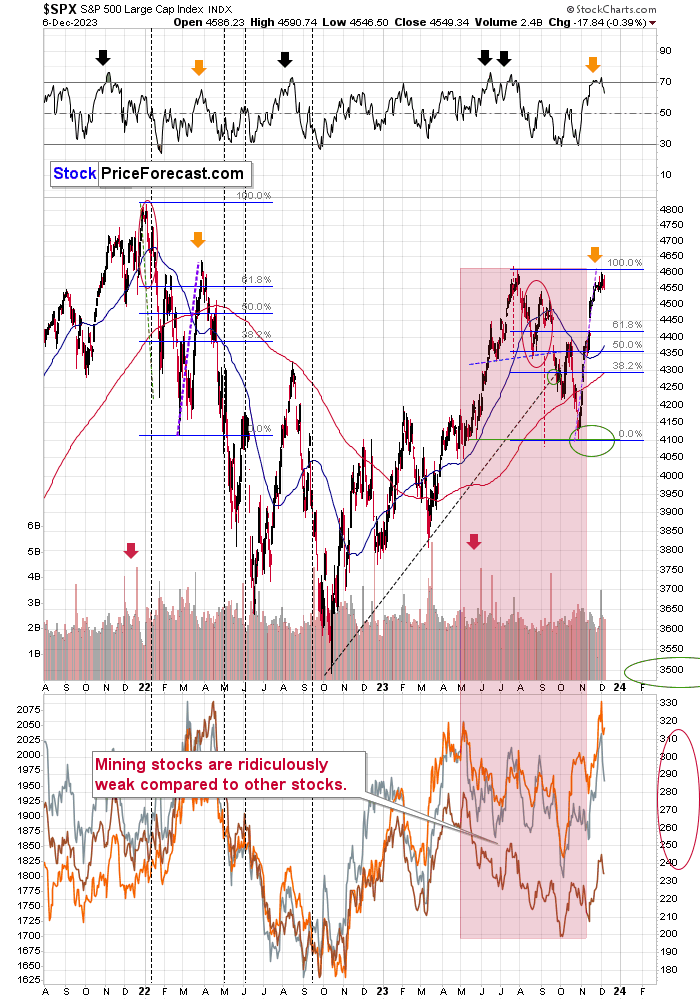
Stocks rallied sharply in Q1 and in early Q2, 2022, and even though very few people wanted to believe that back then, it was actually a major top.
Not only did we see a sharp rally in recent weeks, but it was also actually a rally of almost the identical size as the early-2022 one! The number of factors confirming this analogy is truly remarkable.
Gold’s huge invalidation and inability to hold ground above its previous high as well as miners’ relative weakness makes the situation even clearer. Yes, it’s still possible that gold would soar (and the factors that I’m looking for as bullish signs remain as previously), but a huge decline here is much more likely. And it can be a very lucrative move for those who position themselves ahead of the big price moves…
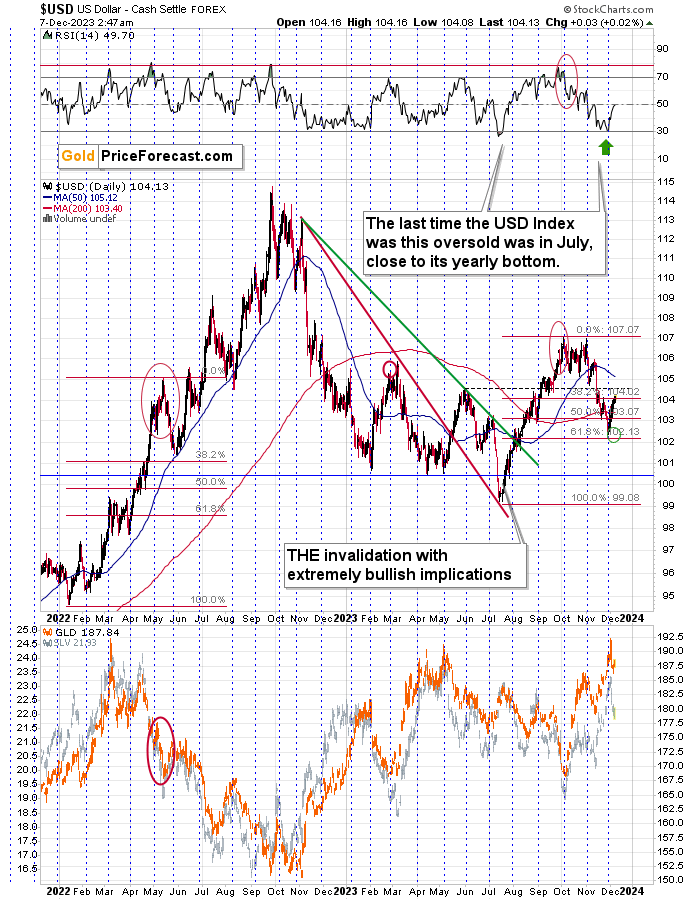
The USD Index was after a correction and was starting another massive rally when miners and stocks topped in April 2022. The same appears to be the case right now. The USDX moved to its 61.8% Fibonacci retracement and then it rallied back up. Once again, the pattern seems to be repeating.
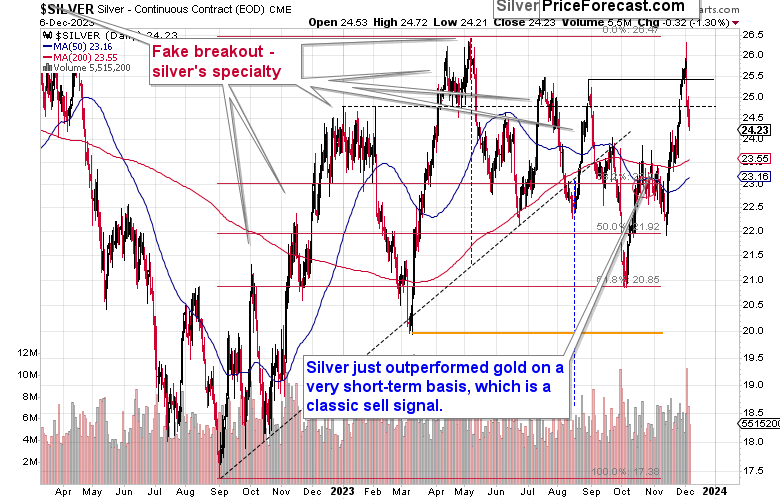
Remember when I wrote that silver was known for fake breakouts and that its move above the early January 2023 high was likely to be invalidated?
That’s exactly what we just saw. The white metal went back below this year’s highs. And you know what happened next in each previous case after this happened? Silver price plunged.
The first pause was at about $23. That’s where we might see some short-term support also this time, but if gold moves below its rising support line, silver is likely to slide as well. In consequence, silver’s pause is unlikely to be anything more than just that. Not a major bottom, not the start of a new, powerful rally, but a pause.
And now, for maybe the most bearish analogy – copper.
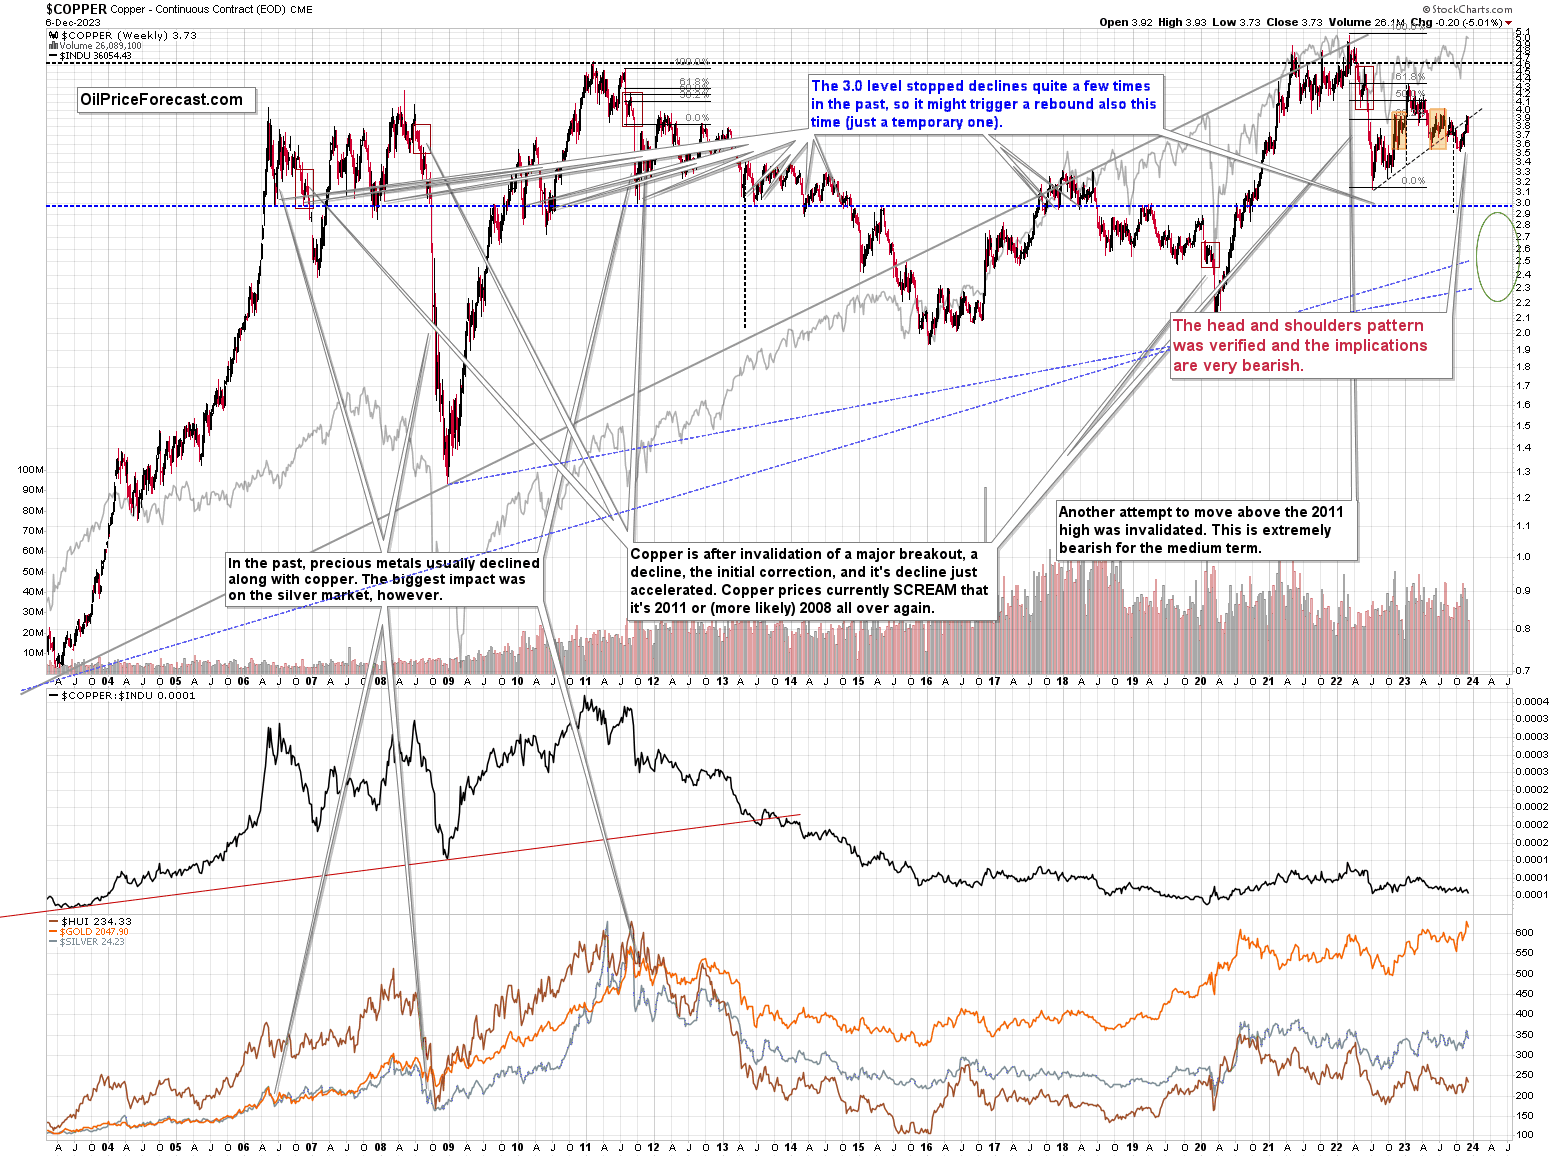
The copper price declined after touching its rising support line, which is also the neck level of a medium-term head-and-shoulders pattern. This pattern was now verified, and the target below $3 is likely to be copper’s next stop.
And yes, this is in perfect tune with how copper declined in 2022! If the analogy continues, we’re likely to see the most volatile part of the decline. Of course, copper stocks, like the FCX, are likely to slide as well.
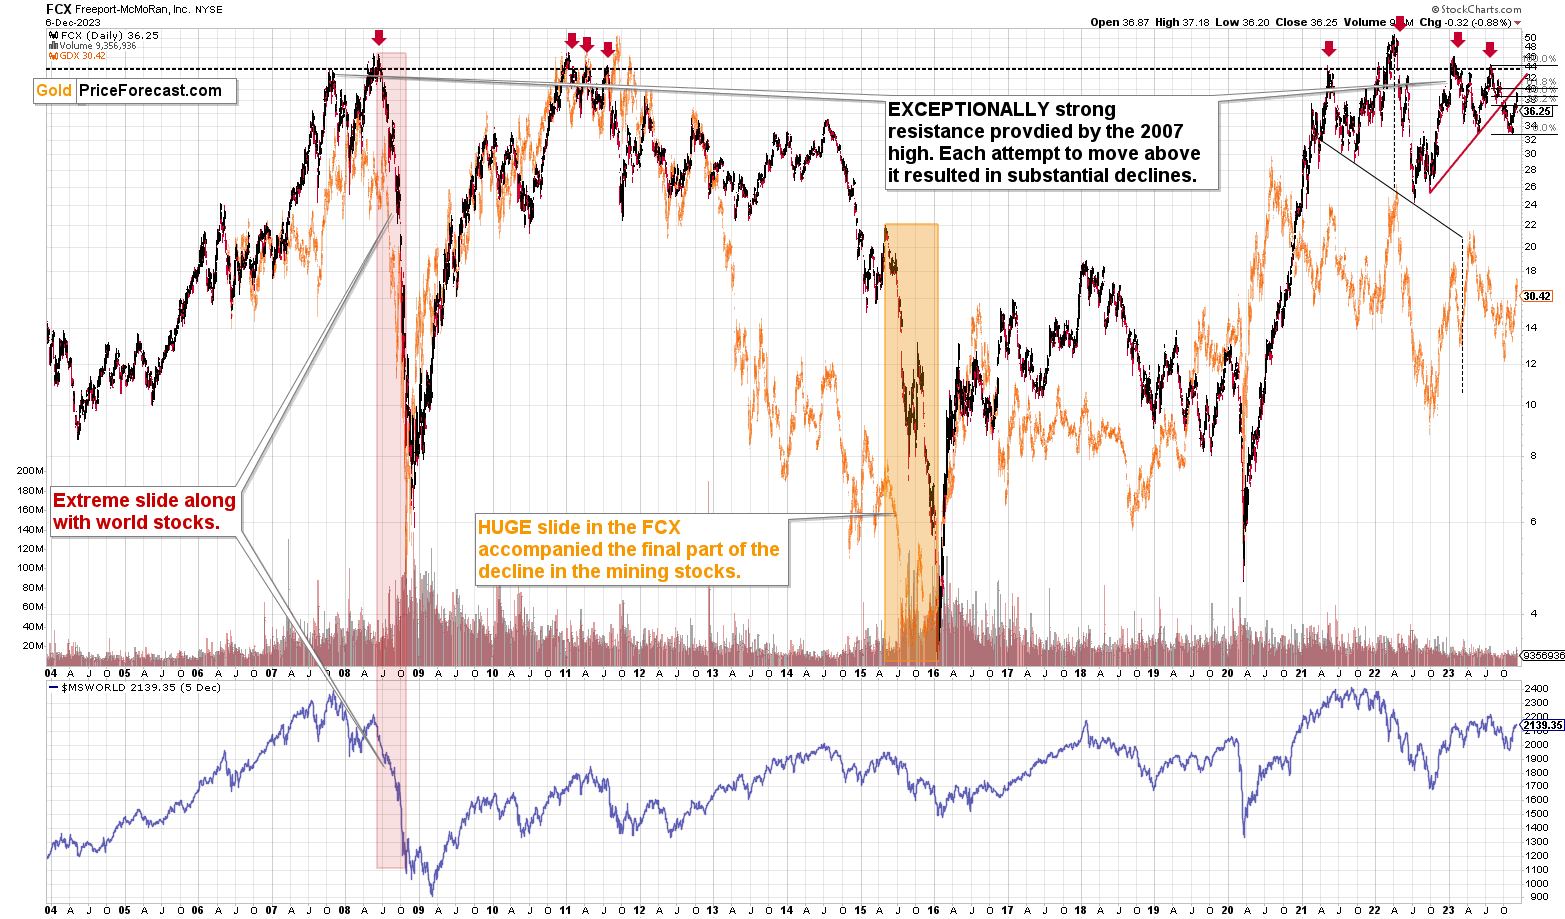
FCX verified its own breakdown, and it corrected less than 61.8% of the preceding short-term decline, so in technical terms, the medium-term decline remains intact.
You can see it more clearly in the below chart.
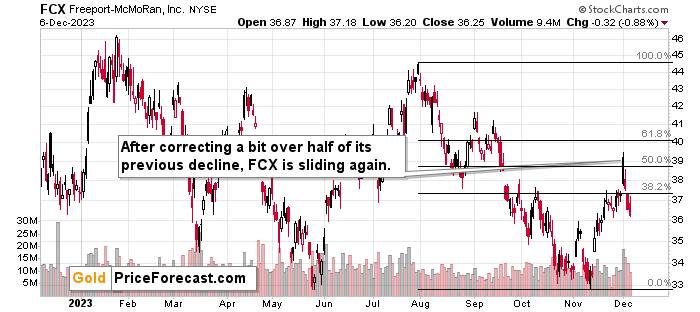
The FCX is back below its early-October high, and it appears ready to slide once again. The previous chart shows that the decline could be huge if stocks fall similarly to what they did in 2008, and this remains a good possibility.
So, all in all, the medium-term trends continue to point to much lower precious metals and mining stock prices, and based on the current analogies, it’s very likely that junior mining stocks and FCX will slide in a truly breathtaking manner in the following weeks and months.
IF gold breaks to new highs (at least in terms of the daily closing prices) and then confirms its breakout by at least three consecutive closes above its 2020 high, and we see strength in the miners, and we don’t see significant outperformance of silver, the situation might become bullish.
Again, the likely outcome is seeing a huge decline from here. I previously wrote that it was likely that we would see gold’s invalidation, and that’s exactly what happened. The decline is likely to follow, even if it doesn’t follow today or tomorrow.
= = =
If you’d like to become a partner/investor in Golden Meadow, you’ll find more details in the above link.
Overview of the Upcoming Part of the Decline
- It seems that the recent – and probably final – corrective upswing in the precious metals sector is over.
- If we see a situation where miners slide in a meaningful and volatile way while silver doesn’t (it just declines moderately), I plan to – once again – switch from short positions in miners to short positions in silver. At this time, it’s too early to say at what price levels this could take place and if we get this kind of opportunity at all.
- I plan to switch from the short positions in junior mining stocks or silver (whichever I’ll have at that moment) to long positions in junior mining stocks when gold / mining stocks move to their 2020 lows (approximately). While I’m probably not going to write about it at this stage yet, this is when some investors might consider getting back in with their long-term investing capital (or perhaps 1/3 or 1/2 thereof).
- I plan to return to short positions in junior mining stocks after a rebound – and the rebound could take gold from about $1,450 to about $1,550, and it could take the GDXJ from about $20 to about $24. In other words, I’m currently planning to go long when GDXJ is close to $20 (which might take place when gold is close to $1,450), and I’m planning to exit this long position and re-enter the short position once we see a corrective rally to $24 in the GDXJ (which might take place when gold is close to $1,550).
- I plan to exit all remaining short positions once gold shows substantial strength relative to the USD Index while the latter is still rallying. This may be the case with gold prices close to $1,400 and GDXJ close to $15 . This moment (when gold performs very strongly against the rallying USD and miners are strong relative to gold after its substantial decline) is likely to be the best entry point for long-term investments, in my view. This can also happen with gold close to $1,400, but at the moment it’s too early to say with certainty.
- The above is based on the information available today, and it might change in the following days/weeks.
You will find my general overview of the outlook for gold on the chart below:
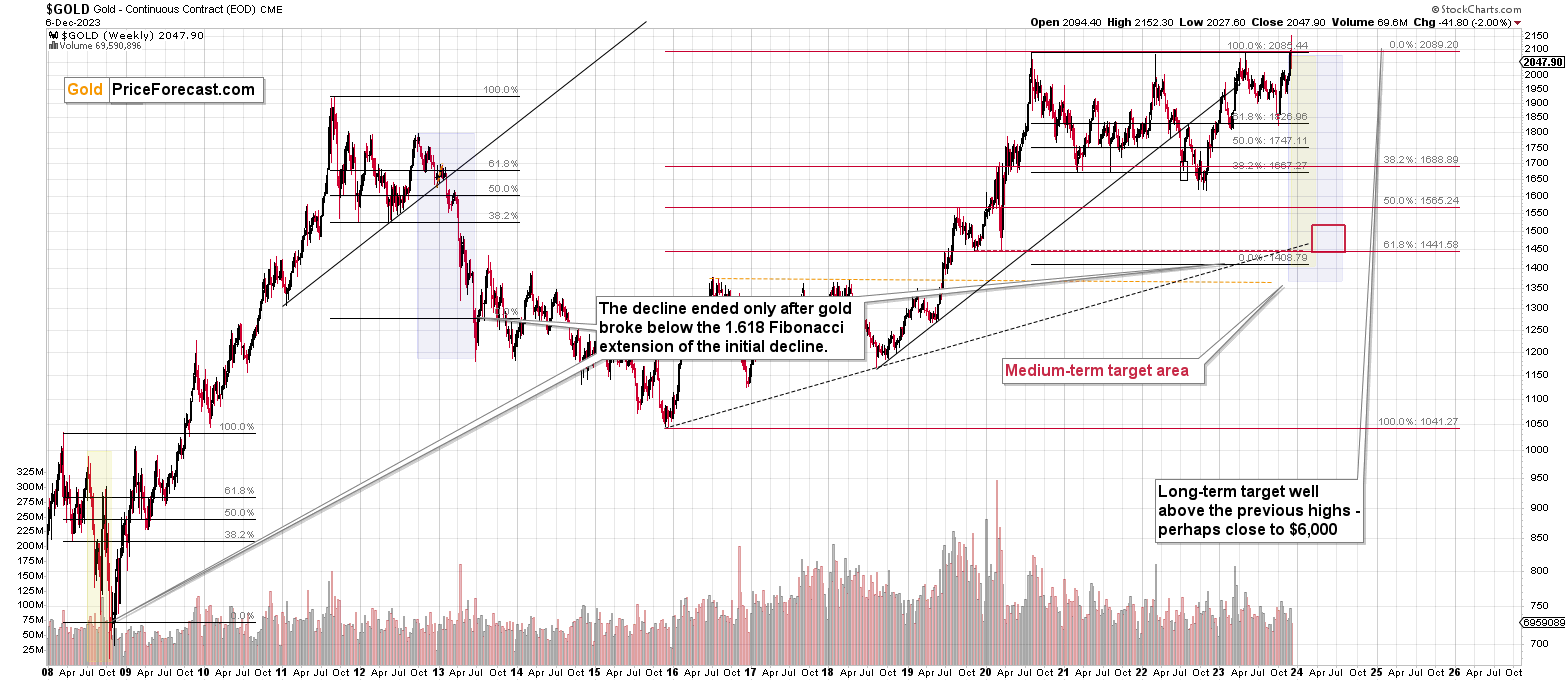
Please note that the above timing details are relatively broad and “for general overview only” – so that you know more or less what I think and how volatile I think the moves are likely to be – on an approximate basis. These time targets are not binding nor clear enough for me to think that they should be used for purchasing options, warrants, or similar instruments.
Letters to the Editor
Please post your questions in the comments feed below the articles if they are about issues raised within the article (or in the recent issues). If they are about other, more universal matters, I encourage you to use the Ask the Community space (I’m also part of the community) so that more people can contribute to the reply and enjoy the answers. Of course, let’s keep the target-related discussions in the premium space (where you’re reading this).
Summary
To summarize, the medium-term trend in the precious metals sector remains clearly down and given that the fear has most likely peaked, and the current technical indications point to lower precious metals prices, it seems that we won’t have to wait for much lower prices for long. The same goes for the FCX stock price.
To summarize:
Short-term outlook for the precious metals sector (our opinion on the next 1-6 weeks): Bearish
Medium-term outlook for the precious metals sector (our opinion for the period between 1.5 and 6 months): Bearish initially, then possibly Bullish
Long-term outlook for the precious metals sector (our opinion for the period between 6 and 24 months from now): Bullish
Very long-term outlook for the precious metals sector (our opinion for the period starting 2 years from now): Bullish
As a reminder, Gold Investment Updates are posted approximately once per week. We are usually posting them on Monday, but we can’t promise that it will be the case each week.
Our preferred ways to invest in and to trade gold along with the reasoning can be found in the how to buy gold section. Additionally, our preferred ETFs and ETNs can be found in our Gold & Silver ETF Ranking.
Moreover, Gold & Silver Trading Alerts are posted before or on each trading day (we usually post them before the opening bell, but we don’t promise doing that each day). If there’s anything urgent, we will send you an additional small alert before posting the main one.
Thank you.
Przemyslaw K. Radomski, CFA
Founder, Editor-in-chief

