

Briefly: in our opinion, full (300% of the regular position size) speculative short positions in junior mining stocks are justified from the risk/reward point of view at the moment of publishing this Alert.
PLEASE NOTE:
Dear readers,
As there was no weekly Friday Gold Investment Update this week, you are getting access to three Gold & Silver Trading Alerts.
Stay tuned!
Pretty much nothing changed on the long-term front since I posted last week’s flagship analysis, so this Friday, I will focus on one specific long-term link and I’ll show you a chart featuring one stock that I haven’t commented on in a while but that provides invaluable confirmation at this time.
Let’s start with the former.
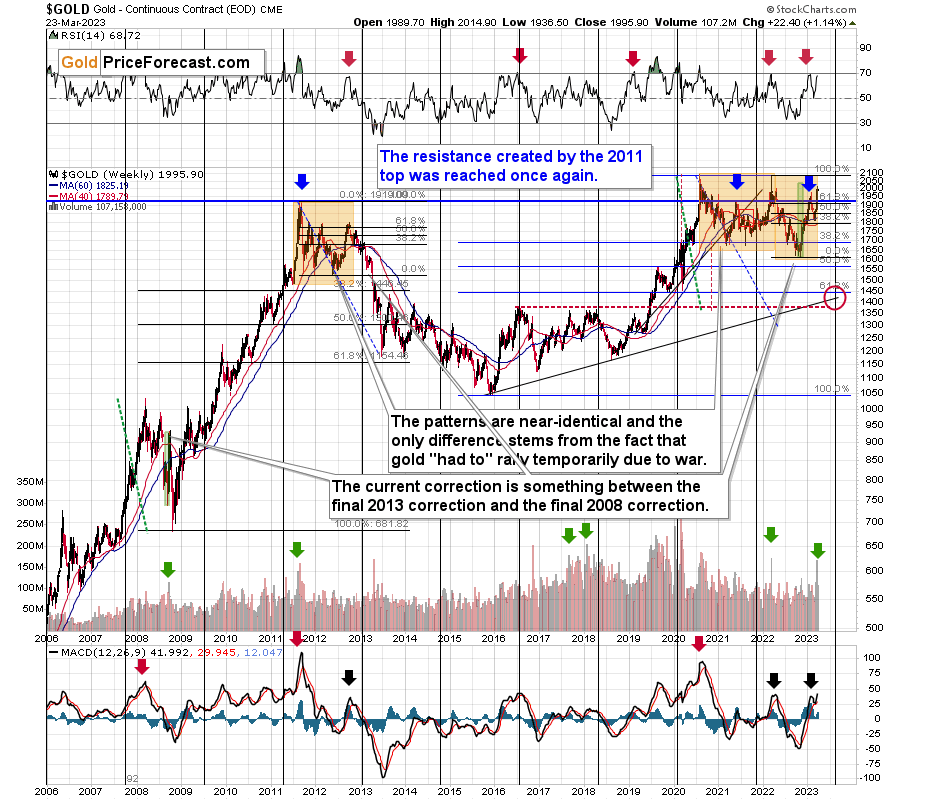
The entire 2020 – now period is a prolonged hybrid of what we saw in 2008 and what we saw between 2011 and 2013, but since I’ve been describing this for weeks (also last week), today I’d like to focus on something different.
Gold once again tried to move above $2,000 recently , just as it did a few other times in the previous years.
The first of the recent attempts took place in mid-2020, the second was in early 2022, the third was in early 2023, and we just saw another attempt this week.
Now, let’s take a look at the HUI Index and see what gold stocks did on those occasions – where did they top in each of those cases?
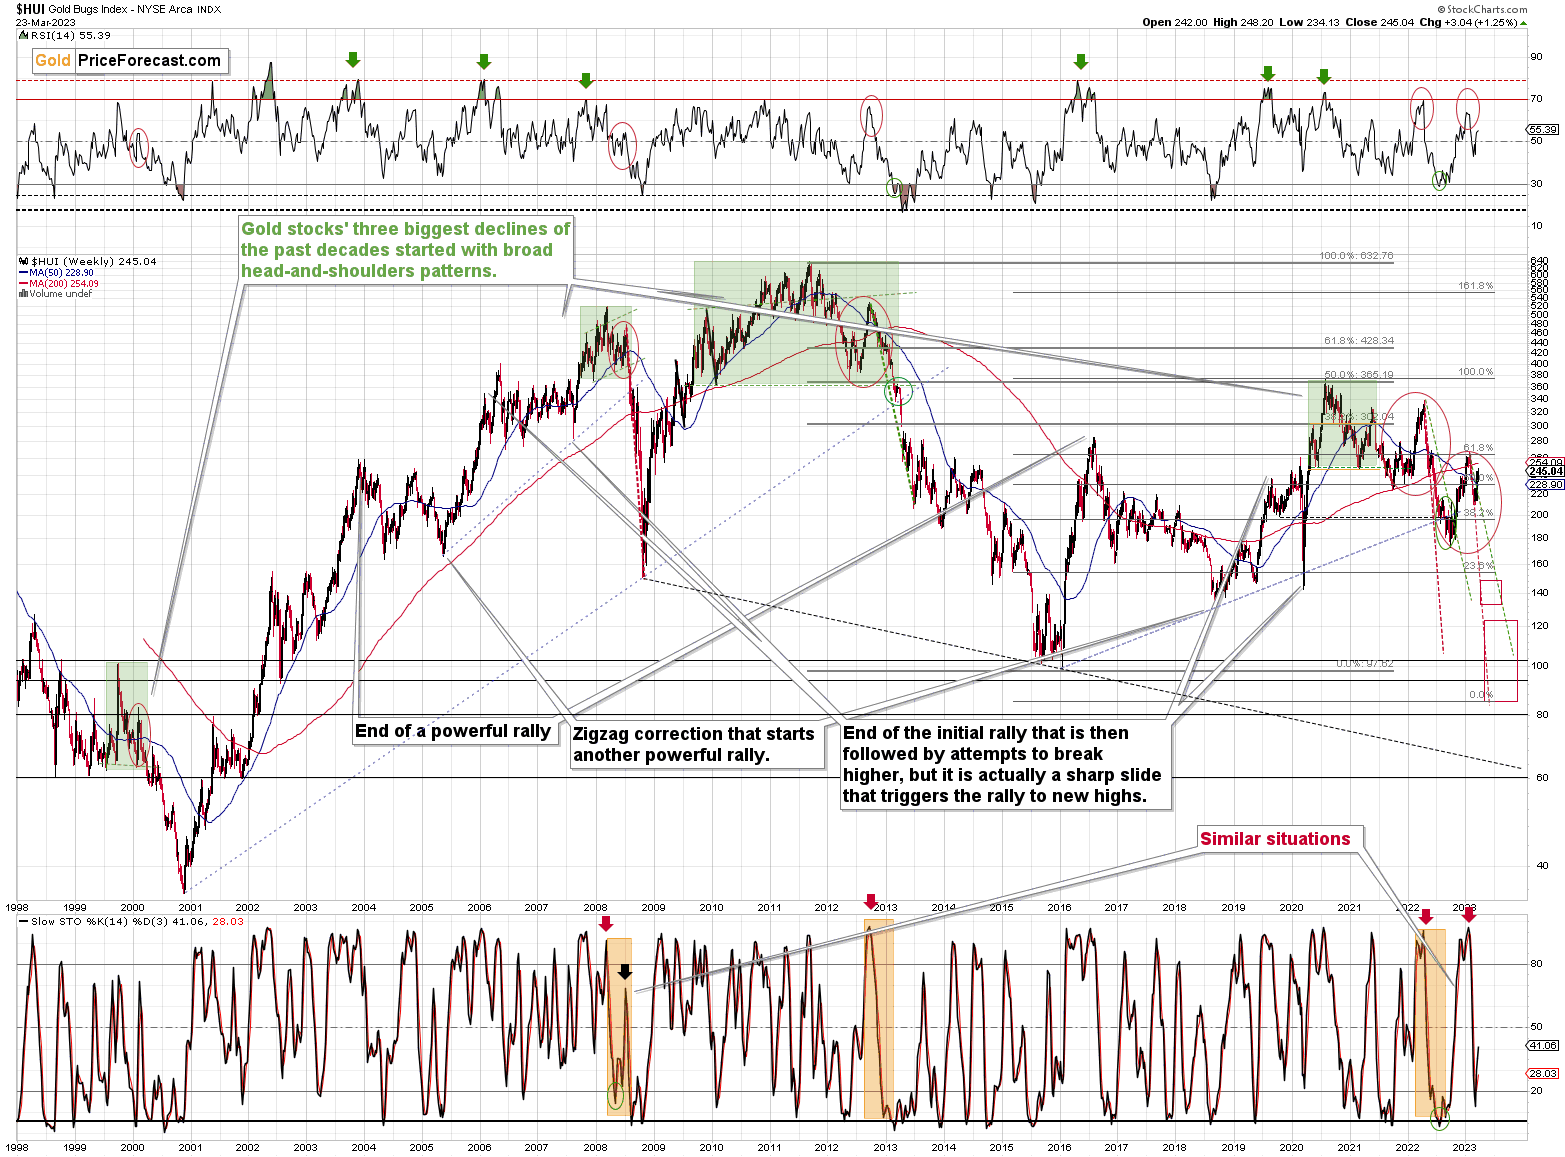
In mid-2020, the HUI Index topped just a little below 380.
In early 2022, the HUI Index topped just a little below 340.
In early 2023, the HUI Index topped a bit above 260.
And right now, the HUI Index seems to have topped below 250.
Gold stocks continue to show medium-term weakness relative to gold. This is very similar to what we saw in 2012 and early 2013, and it has profoundly bearish indications for the following months and weeks.
As far as the USD Index’s long-term picture is concerned, what I wrote yesterday remains fully up-to-date:
As far as the USD Index is concerned, the long-term chart continues to point to a similarity with what happened in 2008.
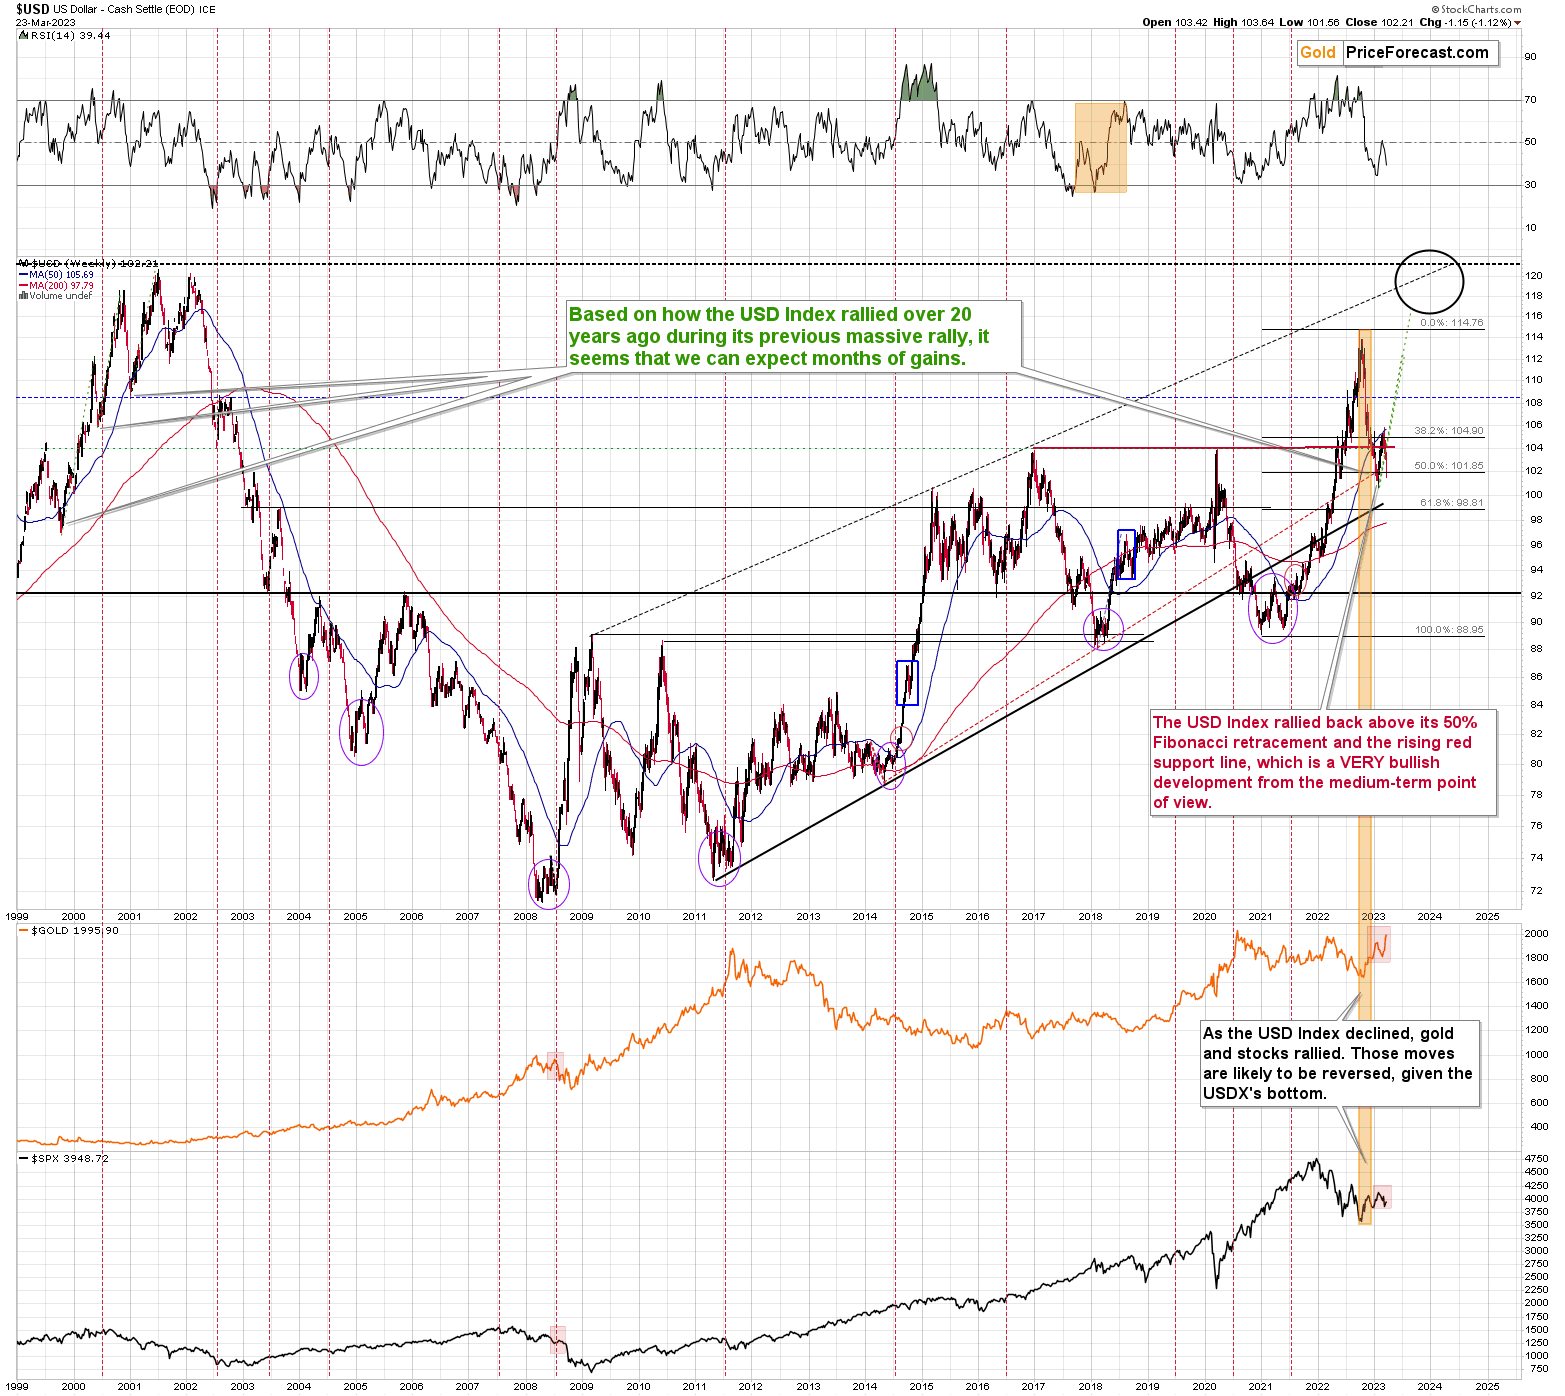
If you look at what happened in mid-2008 – before the near-vertical rally – you’ll see that the back-and-forth movement at the bottom was normal. There was not a single bottom, but a few of them. So, seeing a quick decline here doesn’t make the current picture bullish.
In fact, if you look at the RSI indicator, you’ll see that the final small decline that led to the final bottom started with RSI at about 50.
That’s exactly the level that was just hit, before USD’s recent short-term decline.
And when did that final short-term decline end in 2008? Above the previous lows, when RSI moved to… The levels that it’s at right now.
Yes, the situation is bullish for the USDX, even though it doesn’t seem like it based on what’s going on in the world. The sentiment was very similar back in 2008, and we all know what happened next.
The thing that I would like to add today is that the USDX moved slightly higher yesterday, and it’s moving more visibly higher in today’s pre-market trading.
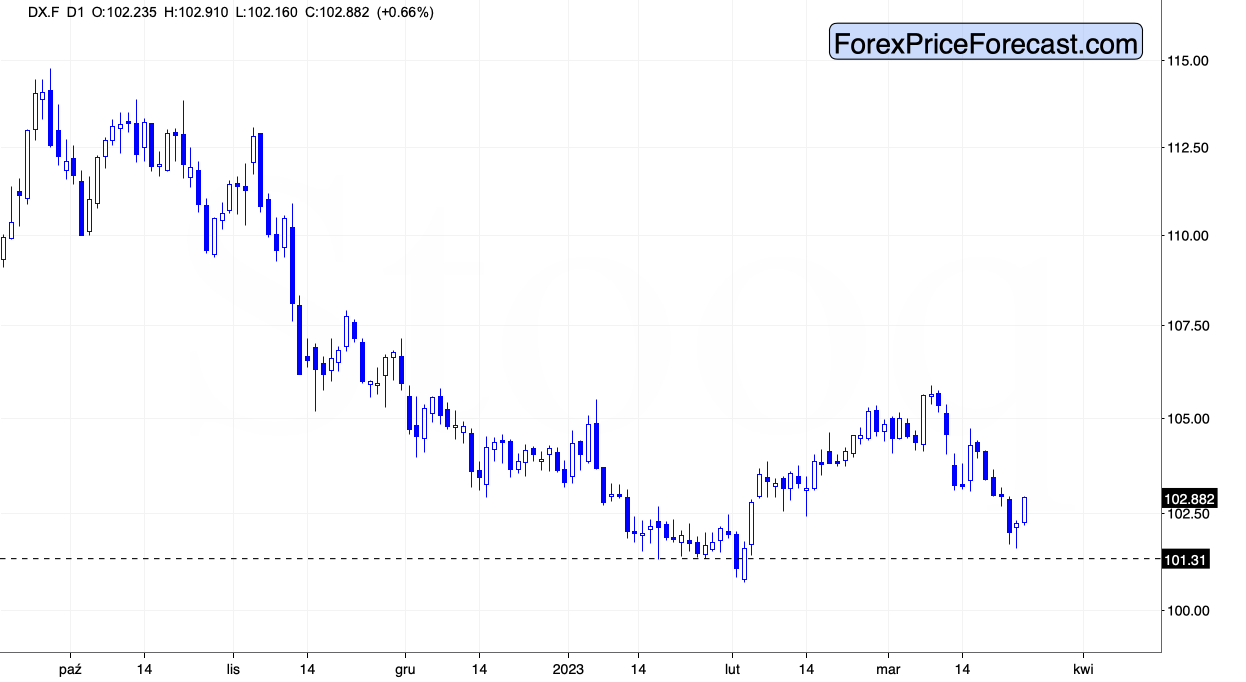
Was that the bottom? Based on the above short-term chart, it’s just possible, but based on the precious long-term chart, it’s quite likely. And even if not, it seems that the bottom is at hand, and the huge rally is likely just around the corner.
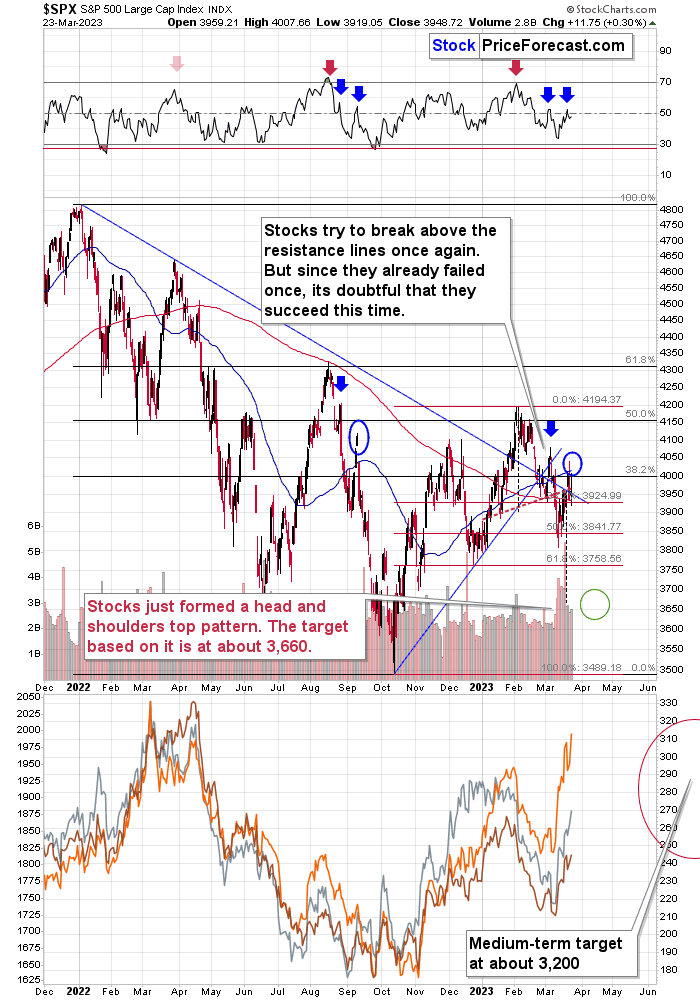
The situation on the general stock market also continues to develop in tune with my previous expectations. While the key technical development of extreme importance is visible in the long-term chart featuring world stocks (see last week’s analysis for details), today I’ll focus on the short-term confirmations. And we got those from the S&P 500 index.
Quoting my yesterday’s analysis:
Please take a look at the RSI – it just jumped above 50 for the second time after the major top. The same thing happened in September 2022. And what happened next? Stocks plunged!
So, if the history is similar to a smaller extent to 2008 and to a bigger extent to 2022, stocks might slide right away, or very soon.
When that happens, miners – and especially junior miners – would be likely to follow.
This means that we might (as I wrote above) or might not have a measured decline in juniors, and we might have a more volatile drop soon.
Which one will it be? I’m not sure, and I don’t care that much, because the position that we have is likely to become extremely profitable (in my view) in the following weeks, regardless of which of the above scenarios plays out.
The S&P 500 ended yesterday’s session a bit higher, but the most important thing is that it tried to move much higher and reversed its course. The S&P 500 futures are also down in today’s pre-market trading. Consequently, it seems that the next big move lower is already underway.
The implications for junior mining stocks are particularly bearish.
Let’s expand on the above and move to the precious metals sector.
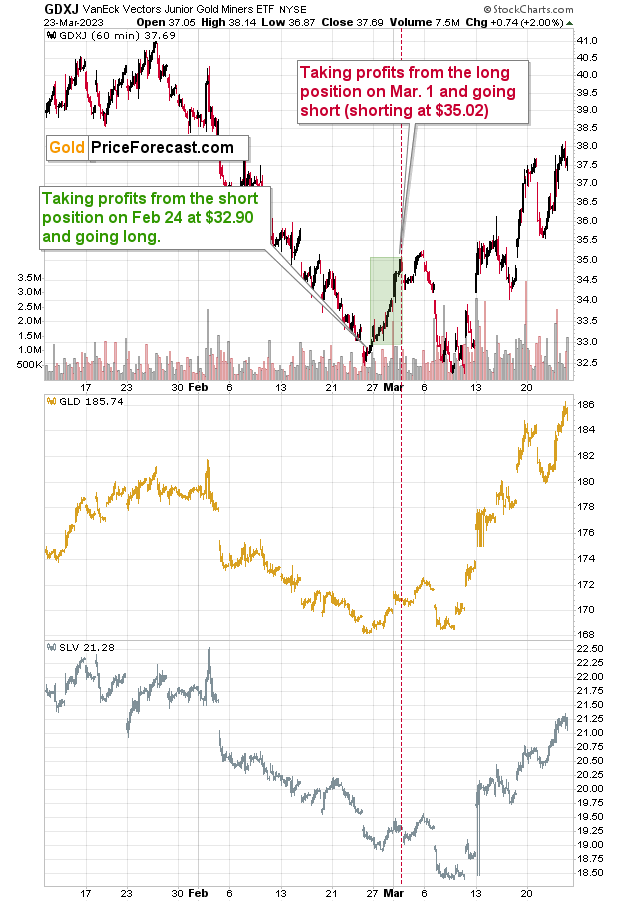
Silver is clearly outperforming gold on an immediate-term basis, which is the perfect cherry on the bearish cake.
Junior miners attempted to rally above their recent high yesterday, and they failed. This shows that it’s likely the final part of the upswing. The worst performer – junior mining stock sector – is catching up because it was “cheapest.” It’s likely being bought by those who don’t care if it was cheap for a reason. But I already wrote about it on Wednesday.
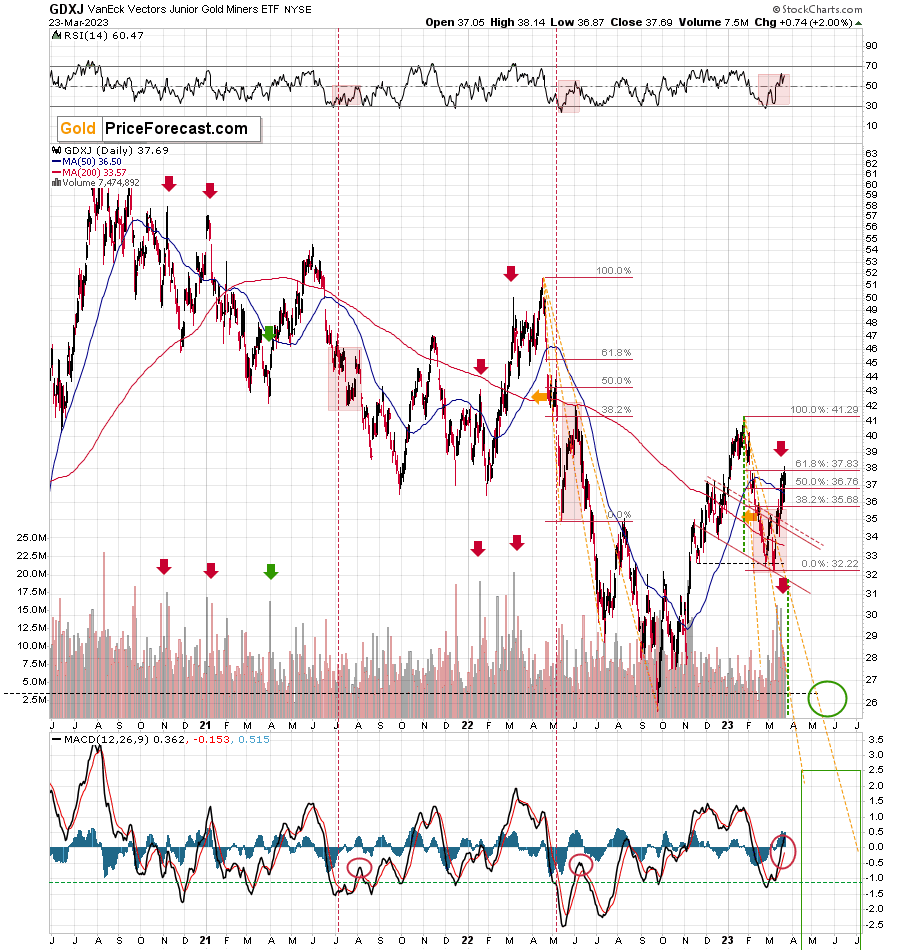
Based on the link to 2008, we can see some back-and-forth movement in the GDXJ in the following days as well, but that’s not really important because the ultimate follow-up action is likely to take the juniors MUCH lower. And I don’t mean just erasing the March rally. I mean moving to, and then below, the 2022 lows.
To put it into perspective, let’s zoom out.
The short-term downside target is at about $26, so entering the short position above $35 is likely to prove to be very beneficial shortly, in my view.
The move above it was, well, small. Gold moved up visibly, it was all accompanied by panic due to the situation in the banking system, but the reality is that junior miners didn’t move up substantially. They only briefly corrected 61.8% of their 2023 downswing, which is a relatively normal technical phenomenon.
In fact, it was just yesterday that the GDXJ once again tried to move above the 61.8% Fibonacci retracement, but it failed to do so. The GDXJ is down in today’s London trading, by the way.
Having said all the above, it’s time to move on to the one “extra” chart that I mentioned in the opening paragraph.
It’s GME – the Gamestop stock symbol.
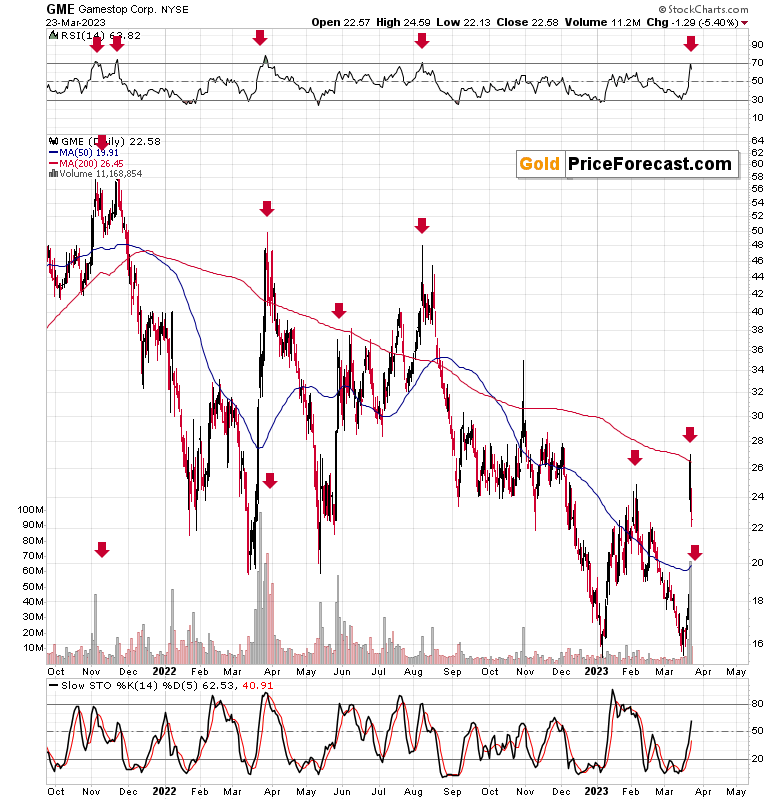
Why GME? Because it’s one of the recently (or not so recently) popular “meme stocks” that got the spotlight in 2021. The fundamentals of the company are not favorable in my view, and it’s been slowly declining from its 2021 “pumped” peak.
The thing is that since it doesn’t have a favorable fundamental situation, but it was popular with the investment public, it’s now a useful barometer of sentiment.
It’s likely getting cheaper for a reason, and yet, every now and then, we see sharp rallies and peaks in its price. Why would that be the case? It is most likely the phenomenon that I described previously – the worst performers get a boost at the end of the rally as the investment public enters the market.
Why is this relevant to us?
Well, please take a look at the moments that I marked with red arrows:
- November 2021
- Late March 2022
- Late May 2022
- Early August 2022
- Early February 2023
- and now.
What happened in the GDXJ at those times?
Let’s check:
- November 2021 – major top
- Late March 2022 – very close to the final top; before a huge slide
- Late May 2022 – major top
- Early August 2022 – major top
- Early February 2023 – major top
- and now.
The first two of those cases (I put them in bold) were accompanied by a big volume. The declines in the GDXJ in the following weeks were particularly big in those cases.
So, the situation in the GME makes it very likely that it was the general investment public’s buying that recently pushed GDXJ higher. This means that this rally should not be taken at its face value.
Instead – and the analysis of GME shows that – this should be treated as a very bearish indication of medium-term importance.
Since this comes on top of the link to 2008, the extremely bearish situation in world stocks, bearish confirmations in the S&P 500, and the bullish (medium-term importance, not just short-term one!) set-up in the USD Index, the outlook for the precious metals sector – in particular for the junior mining stocks – is currently very, very bearish. The profit potential for our short positions remains enormous.
I know it's difficult to hold on tight right before the market turns south, but I also know it's the best thing to do if we've done our homework (which I'm confident we have). Of course, I can’t promise any kind of performance, but in my honest opinion, I think that profits on this position will really become spectacular before this is all over.
Stay strong.
Overview of the Upcoming Part of the Decline
- It seems that we’re seeing another – and probably final – corrective upswing in gold, which is likely to be less visible in the case of silver and mining stocks.
- If we see a situation where miners slide in a meaningful and volatile way while silver doesn’t (it just declines moderately), I plan to – once again – switch from short positions in miners to short positions in silver. At this time, it’s too early to say at what price levels this could take place and if we get this kind of opportunity at all – perhaps with gold prices close to $1,500 - $1,550.
- I plan to switch from the short positions in junior mining stocks or silver (whichever I’ll have at that moment) to long positions in junior mining stocks when gold / mining stocks move to their 2020 lows (approximately). While I’m probably not going to write about it at this stage yet, this is when some investors might consider getting back in with their long-term investing capital (or perhaps 1/3 or 1/2 thereof).
- I plan to return to short positions in junior mining stocks after a rebound – and the rebound could take gold from about $1,450 to about $1,550, and it could take the GDXJ from about $20 to about $24. In other words, I’m currently planning to go long when GDXJ is close to $20 (which might take place when gold is close to $1,450), and I’m planning to exit this long position and re-enter the short position once we see a corrective rally to $24 in the GDXJ (which might take place when gold is close to $1,550).
- I plan to exit all remaining short positions once gold shows substantial strength relative to the USD Index while the latter is still rallying. This may be the case with gold prices close to $1,400 and GDXJ close to $15 . This moment (when gold performs very strongly against the rallying USD and miners are strong relative to gold after its substantial decline) is likely to be the best entry point for long-term investments, in my view. This can also happen with gold close to $1,400, but at the moment it’s too early to say with certainty.
- The above is based on the information available today, and it might change in the following days/weeks.
You will find my general overview of the outlook for gold on the chart below:
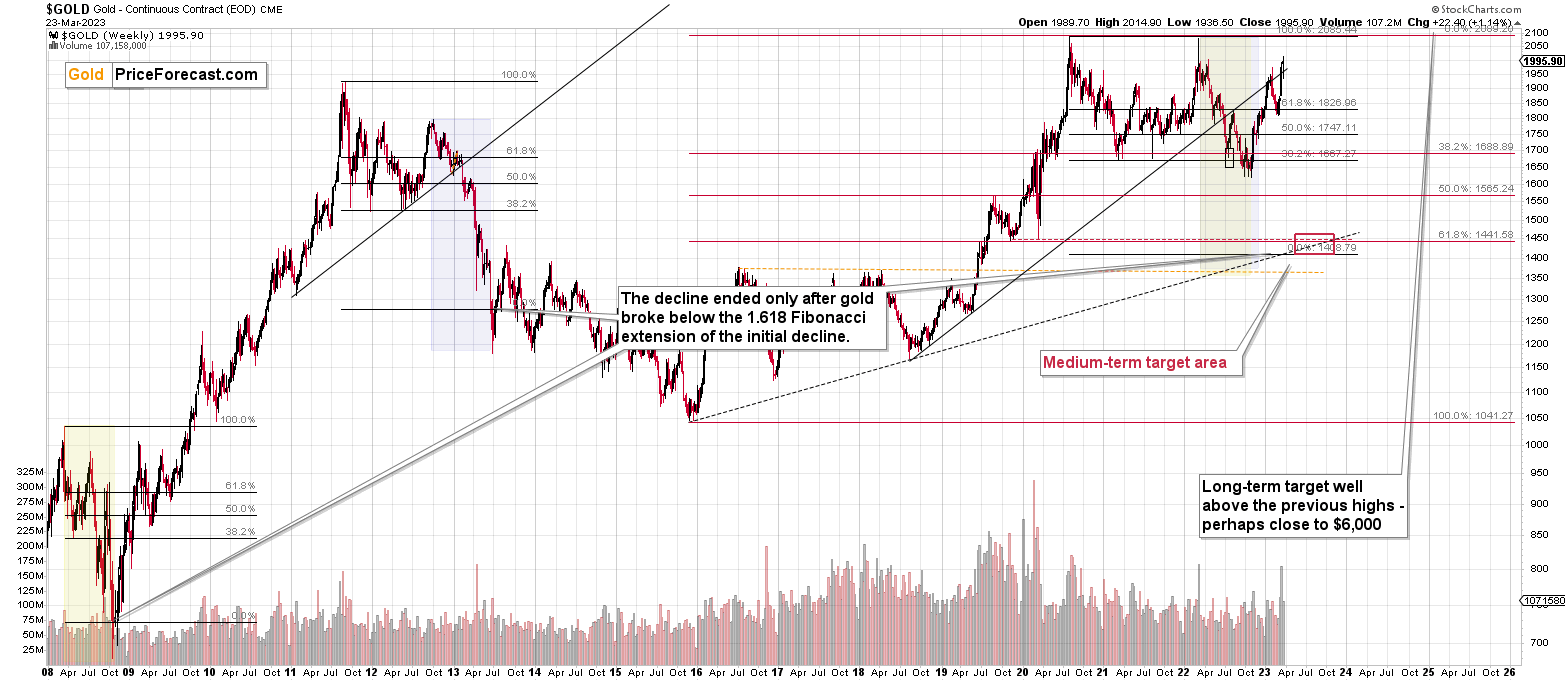
Please note that the above timing details are relatively broad and “for general overview only” – so that you know more or less what I think and how volatile I think the moves are likely to be – on an approximate basis. These time targets are not binding nor clear enough for me to think that they should be used for purchasing options, warrants, or similar instruments.
Letters to the Editor
Please post your questions in the comments feed below the articles, if they are about issues raised within the article (or in the recent issues), and if they are about other, more universal matters, I encourage you to use the Ask the Community space (I’m also part of the community, after all), so that more people can contribute to the reply and then enjoy the answer. Of course, let’s keep the target-related discussions in the premium space (where you’re reading this).
Summary
To summarize, we recently took profits from the additional FCX trade (right before the trend reversed!) and the current short position in junior mining stocks is – in my view – poised to become very profitable in the following weeks, and perhaps days.
Things might appear chaotic in the precious metals market right now, but based on the analogy to the previous crises (2020 and 2008), it’s clear that gold, miners, and other markets are pretty much doing the same thing all over again.
The implications of this “all over” are extremely bearish for junior mining stocks. Back in 2008, at a similar juncture, GDXJ’s price was about to be cut in half in about a week! In my opinion, while the decline might not be as sharp this time, it’s likely to be enormous anyway and very, very, very profitable.
===
As a reminder, we still have a “promotion” that allows you to extend your subscription for up to three (!) years at the current prices… with a 20% discount! And it would apply to all those years, so the savings could be substantial. Given inflation this high, it’s practically certain that we will be raising our prices, and the above would not only protect you from it (at least on our end), but it would also be a perfect way to re-invest some of the profits that you just made.
The savings can be even bigger if you apply it to our All-inclusive Package (Stock- and Oil- Trading Alerts are also included). Actually, in this case, a 25% discount (even up to three years!) applies, so the savings are huge!
If you’d like to extend your subscription (and perhaps also upgrade your plan while doing so), please contact us – our support staff will be happy to help and make sure that your subscription is set up perfectly. If anything about the above is unclear, but you’d like to proceed – please contact us anyway :).
As always, we'll keep you – our subscribers – informed.
To summarize:
Trading capital (supplementary part of the portfolio; our opinion): Full speculative short positions (300% of the full position) in junior mining stocks are justified from the risk to reward point of view with the following binding exit profit-take price levels:
Mining stocks (price levels for the GDXJ ETF): binding profit-take exit price: $26.13; stop-loss: none.
Alternatively, if one seeks leverage, we’re providing the binding profit-take levels for the JDST (2x leveraged). The binding profit-take level for the JDST: $13.87; stop-loss for the JDST: none.
For-your-information targets (our opinion; we continue to think that mining stocks are the preferred way of taking advantage of the upcoming price move, but if for whatever reason one wants / has to use silver or gold for this trade, we are providing the details anyway.):
Silver futures downside profit-take exit price: $17.83 (stop-loss: none)
SLV profit-take exit price: $16.73 (stop-loss: none)
ZSL profit-take exit price: $32.97 (stop-loss: none)
Gold futures downside profit-take exit price: $1,743 (stop-loss: none)
HGD.TO – alternative (Canadian) 2x inverse leveraged gold stocks ETF – the upside profit-take exit price: $10.97 (stop-loss: none due to vague link in the short term with the U.S.-traded GDXJ)
HZD.TO – alternative (Canadian) 2x inverse leveraged silver ETF – the upside profit-take exit price: $25.47 (stop-loss: none)
Long-term capital (core part of the portfolio; our opinion): No positions (in other words: cash)
Insurance capital (core part of the portfolio; our opinion): Full position
Whether you’ve already subscribed or not, we encourage you to find out how to make the most of our alerts and read our replies to the most common alert-and-gold-trading-related-questions.
Please note that we describe the situation for the day that the alert is posted in the trading section. In other words, if we are writing about a speculative position, it means that it is up-to-date on the day it was posted. We are also featuring the initial target prices to decide whether keeping a position on a given day is in tune with your approach (some moves are too small for medium-term traders, and some might appear too big for day-traders).
Additionally, you might want to read why our stop-loss orders are usually relatively far from the current price.
Please note that a full position doesn't mean using all of the capital for a given trade. You will find details on our thoughts on gold portfolio structuring in the Key Insights section on our website.
As a reminder - "initial target price" means exactly that - an "initial" one. It's not a price level at which we suggest closing positions. If this becomes the case (as it did in the previous trade), we will refer to these levels as levels of exit orders (exactly as we've done previously). Stop-loss levels, however, are naturally not "initial", but something that, in our opinion, might be entered as an order.
Since it is impossible to synchronize target prices and stop-loss levels for all the ETFs and ETNs with the main markets that we provide these levels for (gold, silver and mining stocks - the GDX ETF), the stop-loss levels and target prices for other ETNs and ETF (among other: UGL, GLL, AGQ, ZSL, NUGT, DUST, JNUG, JDST) are provided as supplementary, and not as "final". This means that if a stop-loss or a target level is reached for any of the "additional instruments" (GLL for instance), but not for the "main instrument" (gold in this case), we will view positions in both gold and GLL as still open and the stop-loss for GLL would have to be moved lower. On the other hand, if gold moves to a stop-loss level but GLL doesn't, then we will view both positions (in gold and GLL) as closed. In other words, since it's not possible to be 100% certain that each related instrument moves to a given level when the underlying instrument does, we can't provide levels that would be binding. The levels that we do provide are our best estimate of the levels that will correspond to the levels in the underlying assets, but it will be the underlying assets that one will need to focus on regarding the signs pointing to closing a given position or keeping it open. We might adjust the levels in the "additional instruments" without adjusting the levels in the "main instruments", which will simply mean that we have improved our estimation of these levels, not that we changed our outlook on the markets. We are already working on a tool that would update these levels daily for the most popular ETFs, ETNs and individual mining stocks.
Our preferred ways to invest in and to trade gold along with the reasoning can be found in the how to buy gold section. Furthermore, our preferred ETFs and ETNs can be found in our Gold & Silver ETF Ranking.
As a reminder, Gold & Silver Trading Alerts are posted before or on each trading day (we usually post them before the opening bell, but we don't promise doing that each day). If there's anything urgent, we will send you an additional small alert before posting the main one.
Thank you.
Przemyslaw K. Radomski, CFA
Founder, Editor-in-chief

