

Briefly: gold and the rest of the precious metals market are likely to decline in the next several weeks/months and then start another powerful rally. Gold’s strong bullish reversal/rally despite the USD Index’s continuous strength will likely be the signal confirming that the bottom is in.
Welcome to this week's Gold Investment Update.
Predicated on last week’s price moves, our most recently featured medium-term outlook remains the same as the price moves align with our expectations (and we not only took profits from the previous short position, but we profited on the rebound, and now expect further returns on the short side again). On that account, there are parts of the previous analysis that didn’t change at all in the earlier days and are written in italics.
Rattled bond bulls became the walking wounded, as the FOMC’s hawkish projections led to a major sell-off. Along the way, the USD Index rallied and the GDXJ ETF suffered, which aligned with out medium-term fundamental projections. Moreover, the technicals have accurately predicted these moves for months, and we expect more downside before long-term buying opportunities emerge.
We’ll begin today’s alert by dissecting the fundamentals, and then dive into the technical aspects that have proven so prescient over the last several months.
Unrealistic Expectations Are Gold’s Kryptonite
Treasury yields were unhinged on Sep. 21, as a major bond-market sell-off helped uplift the USD Index and upend the GDXJ ETF. As a result, our short position produced even more profits, and further gains are expected in the weeks and months ahead.
Yet, it’s like déjà vu all over again. For example, unrealistic expectations were all the rage in 2021, as inflation was dismissed as transitory and Fed Chairman Jerome Powell assumed that raising interest rates was preposterous. Moreover, with the naïve optimism keeping gold uplifted and the stock market above its fair value, investors’ faith in the Fed was on full display.
Please see below:
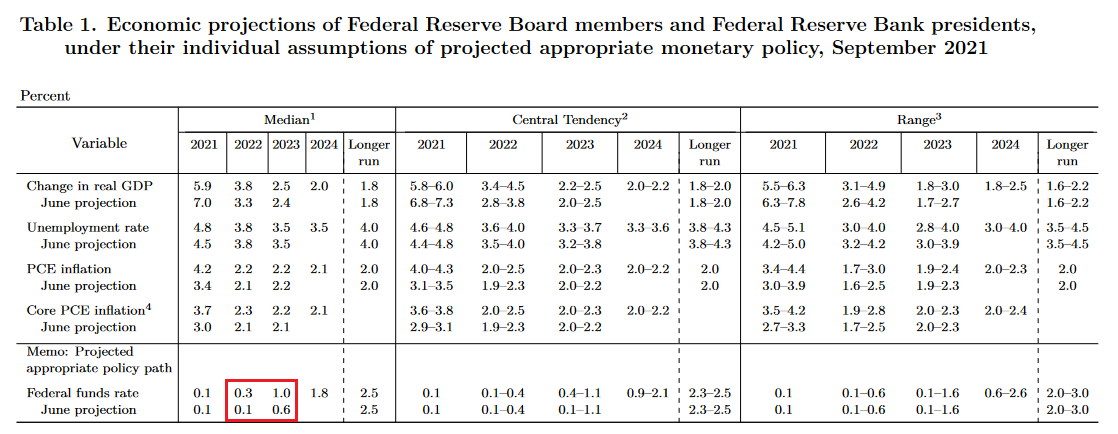
To explain, the table above is sourced from the FOMC’s September 2021 Summary of Economic Projections (SEP). If you analyze the red rectangle, you can see that the median federal funds rate (FFR) estimate was 0.30% in 2022 and 1% in 2023. However, the FFR ended 2022 north of 4% and rose above 5% in 2023. Thus, there was little prescience in Powell’s predictions, and silver suffered mightily as hawkish re-pricings unfolded.
Furthermore, we warned that investors’ loyalty to the Fed would backfire. We wrote on Aug. 31, 2021:
With Fed Chairman Jerome Powell threading the dovish needle on Aug. 27, investors rejoiced as he downplayed the consequences of surging inflation. However, while his perpetual patience may elicit comfort in the short term, the medium-term ramifications could end up shocking the financial markets.
Case in point: while Powell allows the economy to run hot, his lack of prudence has left him far behind the inflation curve. And with one policy mistake liable to result in an accelerated rate hike cycle once the Fed finally moves, his ability to placate investors could come under immense pressure.
So, while Powell’s inflation blunder cost investors dearly, they are still buying what he’s selling.
Please see below:
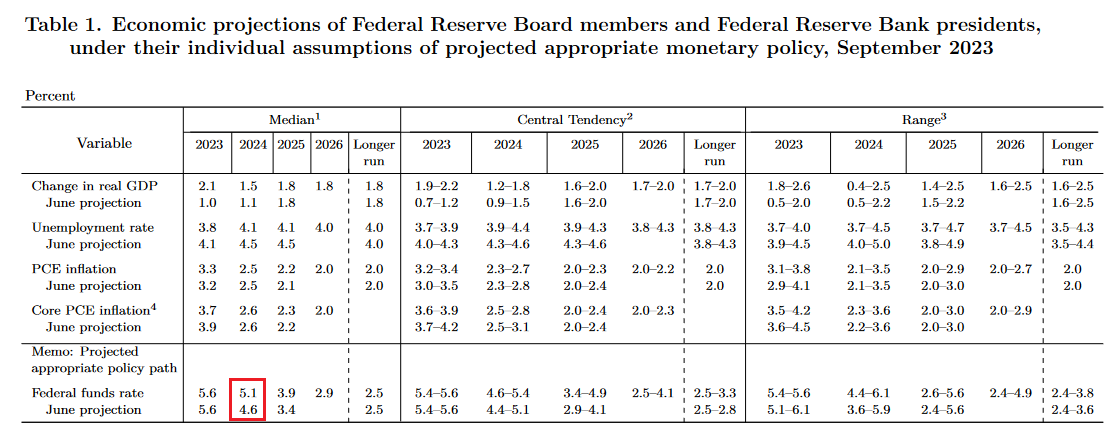
To explain, the FOMC released its latest SEP on Sep. 20. If you analyze the red rectangle, you can see that the committee raised its 2024 FFR projection from 4.6% to 5.1%. In other words, the Fed expects the FFR to remain above 5% throughout 2024, with fewer rate cuts expected now than in June.
But, the expectation is highly unrealistic, and the current SEP is like September 2021 in reverse.
In reality, long-term interest rates have risen dramatically over the last several weeks, and these impact consumers’ borrowing costs, not the FFR. So, while the FFR was high throughout 2022, long-term rates’ unwillingness to rise in lockstep is why we faded the recession narrative. In contrast, long-term interest rates are doing the heavy lifting now, and the medium-term ramifications should be severe.
False Hope
This cycle is already long in the tooth, and the crowd is buying that the U.S. economy will remain strong enough to keep rates this high for the next 15 months. We believe the prospect is highly unrealistic, and assets like oil could crash if (when) a recession unfolds.
Please see below:
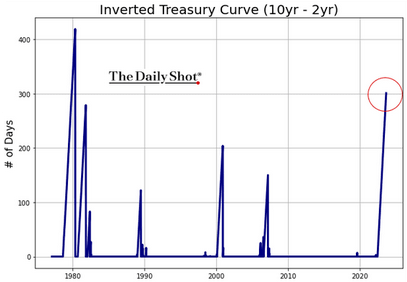
To explain, the 10-2 Treasury yield spread has gone negative before every recession since 1980. And the blue line above tracks the number of days it has been inverted. If you analyze the right side of the chart, you can see that the current inversion is the second-longest on record, meaning that recessions arrived sooner in prior cycles. Consequently, the idea of the inversion remaining in place for another 15 months is laughable, in our opinion.
Second, the historical movement of the FFR highlights the FOMC’s unrealistic expectations, and if (when) they go up in smoke, the USD Index should soar.
Please see below:
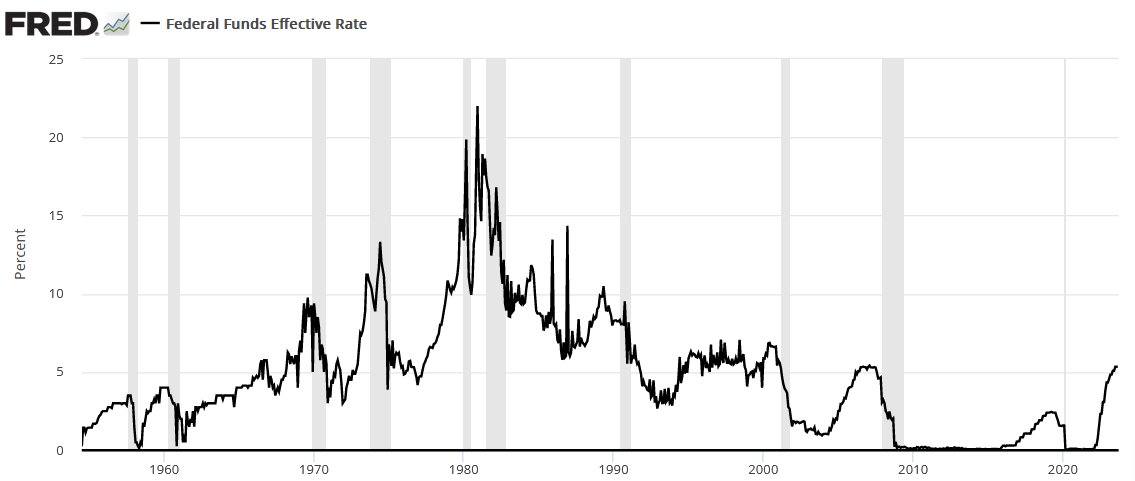
To explain, the black line above tracks the FFR, while the vertical gray bars represent recessions. If you analyze the movement of the former, you can see that the FFR never goes sideways for long, especially after rising off of a low base. Conversely, sharp rises and falls have been present since the 1950s, which highlights why Powell’s prediction is so unrealistic.
As examples, the FFR went sideways during the mid-1990s, but it only rose by roughly 3%, so it’s not comparable to the nearly 6% of this cycle. Similarly, the FFR stayed in the 5% range for roughly 13 months before the global financial crisis (GFC). Yet, the FFR has already been above 5% for roughly five months in this cycle, which further emphasizes why another 15 months of a 5%+ FFR lacks historical credibility.
Finally, while the crowd learned nothing from the FOMC’s “transitory” misstep, soft landing expectations should suffer the same ominous fate.
Please see below:
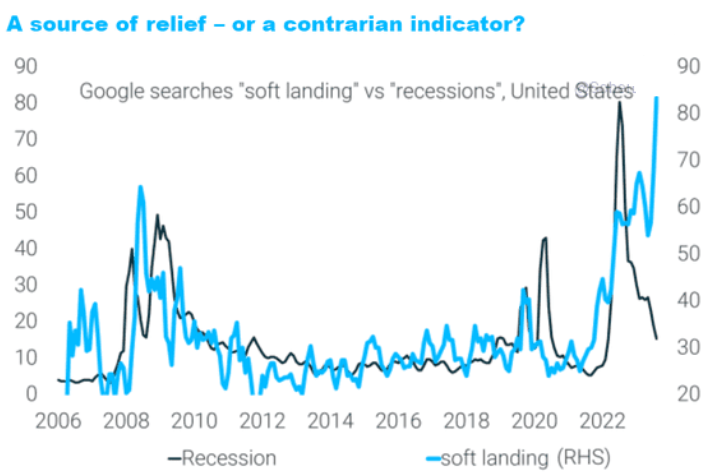
To explain, the dark and light blue lines above track Americans’ Google Searches for “recession” and “soft landing.” If you analyze the behavior of the light blue line before the GFC, you can see that a soft landing was also popular then.
And now, the divergence on the right side of the chart shows how soft landing hopes are extremely consensus, while recession searches have collapsed. In our opinion, this mirrors the consensus view that inflation would be transitory in 2021, and another reality check should commence in the months ahead.
Overall, a recession won’t arrive overnight, but the current outlook is nowhere near as sanguine as the narrative suggests. Growth continues to weaken, and many of the metrics that caused us to remain FFR bulls in 2021 and 2022 have turned in ominous directions. Therefore, while the current weakness can be attributed to seasonality, the S&P 500 should endure a major drawdown when investors’ faith in the Fed evaporates once again.
Dead Ends Ahead for Silver
With the FOMC’s hawked-up SEP and Powell’s inflation focus upending several risk assets, rising real interest rates continue to weaken silver’s bull thesis. And with the Fed chief promising more of the same on Sep. 20, higher interest rates and/or a recession are both bullish for the USD Index. Powell said:
“The worst thing we can do is to fail to restore price stability, because the record is clear on that. If you don’t restore price stability, inflation comes back and... you can have a long period where the economy is just very uncertain, and it’ll affect growth. It... can be a miserable period to have inflation come constantly coming back and the Fed coming in and having to tighten again and again.”
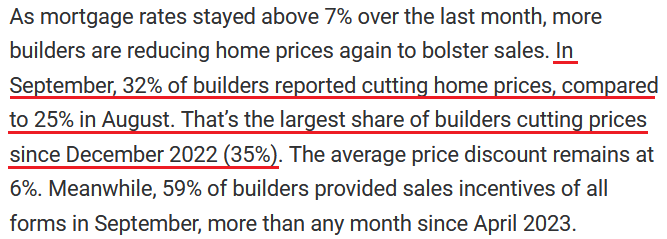
Thus, with Powell keen on avoiding the mistakes of the 1970s, the soft landing narrative should disintegrate as the inflation fight continues. For example, the National Association of Homebuilders (NAHB) released its Housing Market Index (HMI) on Sep. 18. The report stated:
“All three major HMI indices posted declines in September. The HMI index gauging current sales conditions fell six points to 51, the component charting sales expectations in the next six months also declined six points to 49 and the gauge measuring traffic of prospective buyers dropped five points to 30.”
More importantly, the drag was driven by higher long-term interest rates, which we warned were the key ingredient for a recession. And with the rate surge still ongoing, the situation should worsen and help push gold off the recessionary cliff.
Please see below:
Likewise, while homebuilder confidence has come under pressure from higher long-term Treasury yields, there is still plenty of room to fall.
Please see below:
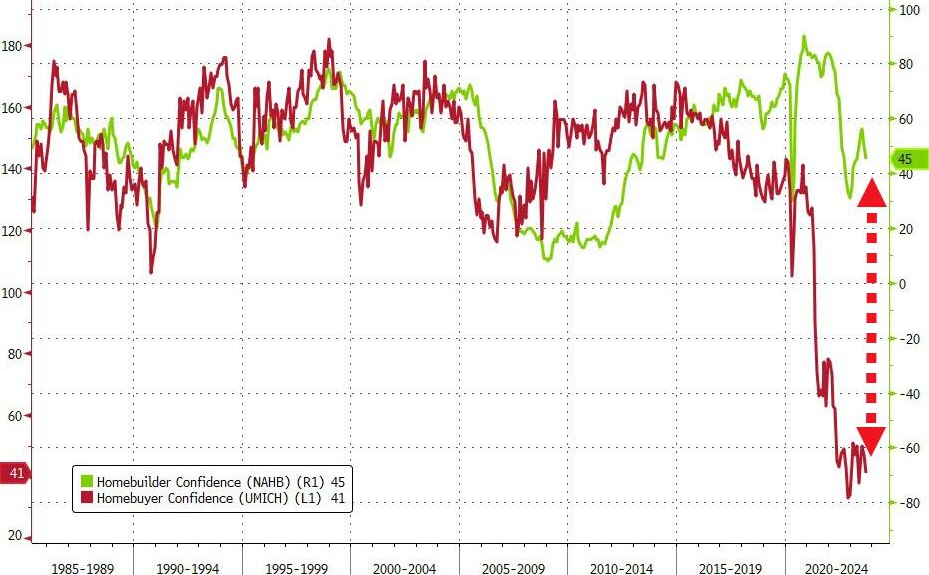
To explain, the green line above tracks homebuilder confidence, while the red line above tracks homebuyer confidence. If you analyze their movement, you can see that the pair were largely interconnected since the 1980s. Yet, with unaffordability pushing the red line to/near its all-time lows, higher long-term interest rates make the situation even gloomier. As such, the data does not support a soft landing.
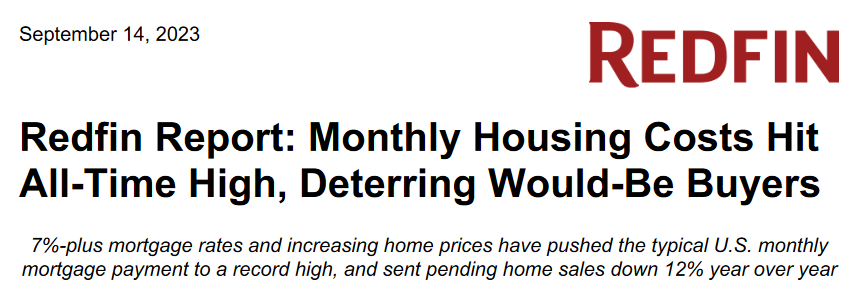
Speaking of which, RedFin – a U.S. residential real estate brokerage and mortgage origination company – revealed on Sep. 14 that “the median U.S. monthly mortgage payment hit an all-time high of $2,632 during the four weeks ending September 10.” And again, long-term interest rates are higher now, which means even worse conditions in the weeks ahead. The report added:
“It’s more expensive than ever to buy a home, with monthly payments at a record high due to stubbornly high rates and home prices. Although the weekly average mortgage rate has declined slightly from August’s two-decade high, it’s still sitting above 7%. Prices are up, too, increasing 4% year-over-year (YoY).”
Please see below:
Oil Is a Bad Indicator
While some view higher oil prices as an indicator of economic prosperity, the harsh truth is that crude is a late-cycle darling that only dampens the economic outlook. Remember, higher oil prices increase gasoline and heating costs for Americans. And with the colder weather poised to bite over the next 60 days, that’s less disposable income to spend on S&P 500 companies’ goods and services.
Furthermore, with the CTAs’ (algorithms) momentum bets boosting prices, the unraveling should be swift when the recession scars become more obvious.
Please see below:
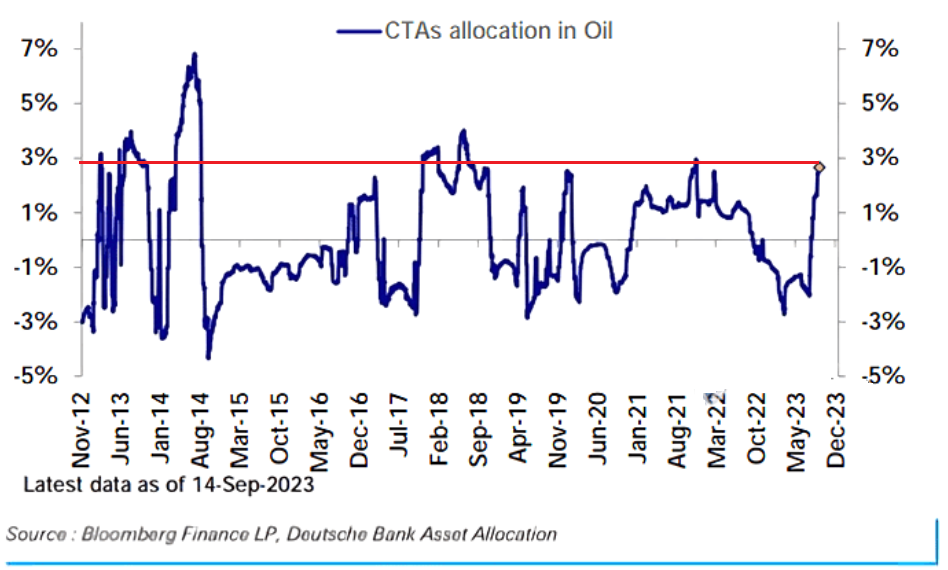
To explain, the blue line above tracks CTAs exposure to oil. If you analyze the horizontal red line, you can see that the bulls are nearly all in, and a major liquidation is unlikely to help the S&P 500 or the PMs. In other words, when volatility strikes and is a function of real fear, the ramifications are highly bearish for risk assets like silver and mining stocks.
Overall, soft landing expectations and FOMC belief helped elicit a prominent bond-market sell-off. Yet, the irony is that higher long-term interest rates only increase the chances of a recession, which negates the two catalysts that pushed them higher in the first place. But, the USD Index should be a profound winner from the rate re-pricing, while the PMs will likely come out on the losing end.
The Bottom Line
The fundamentals continue to perform as expected, and our warning about higher long-term interest rates has come to fruition. Next up, the ramifications of these higher long-term yields should push the global economy into recession and help push risk assets to the final lows. History shows that recessions are required to win the inflation war, and this cycle should be no different.
In conclusion, the PMs declined on Sep. 21, as Powell sparked anarchy in the bond market. And while gold, silver and mining stocks should continue their drawdowns, it could result from a whole new narrative (recession) in the months ahead.
Technically Speaking
I warned the miners were weak, and they again buckled under the pressure. Moreover, increasing the size of the short position was prudent, as a reversal occurred nearly on cue. As a result, yesterday’s comments remain up to date, and I encourage you to read them to understand what should unfold in the weeks ahead.
A reversal can be powerful. Two are often a game-changer. We just saw three.
On Wednesday, I wrote the following:
The momentum remains positive, so reaching this target – close to $1,965 – might be what triggers the reversal.
The reversal is likely anyway because the fact that both resistance lines cross creates a triangle-vertex-based reversal point. And it is due right about now.
Consequently, we might see some very interesting action in the upcoming days – with gold likely reversing its course, but quite likely from slightly higher price levels.
On the chart below, it’s clearly visible that gold did indeed move to the above-mentioned combination of resistance levels.
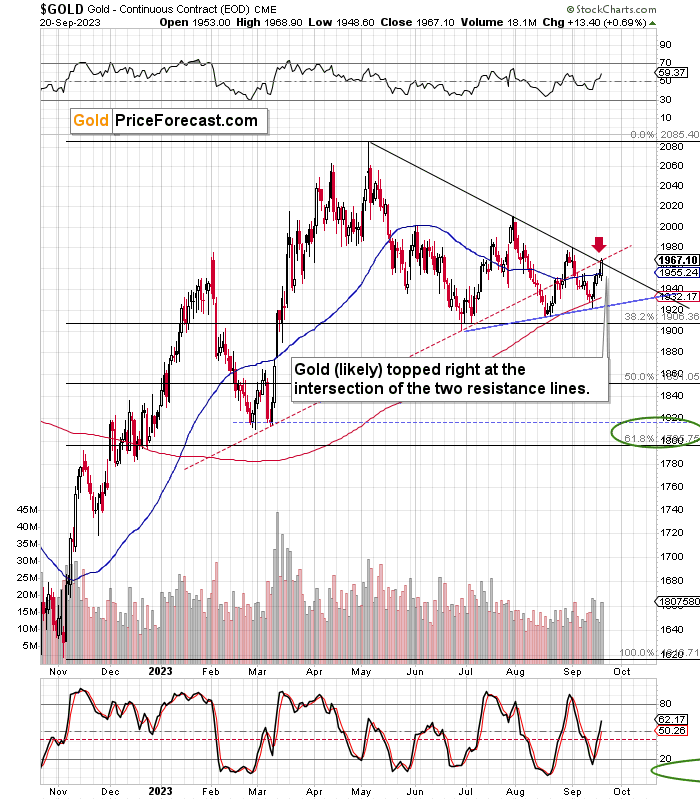
And on the chart below, you can see that it also reversed.
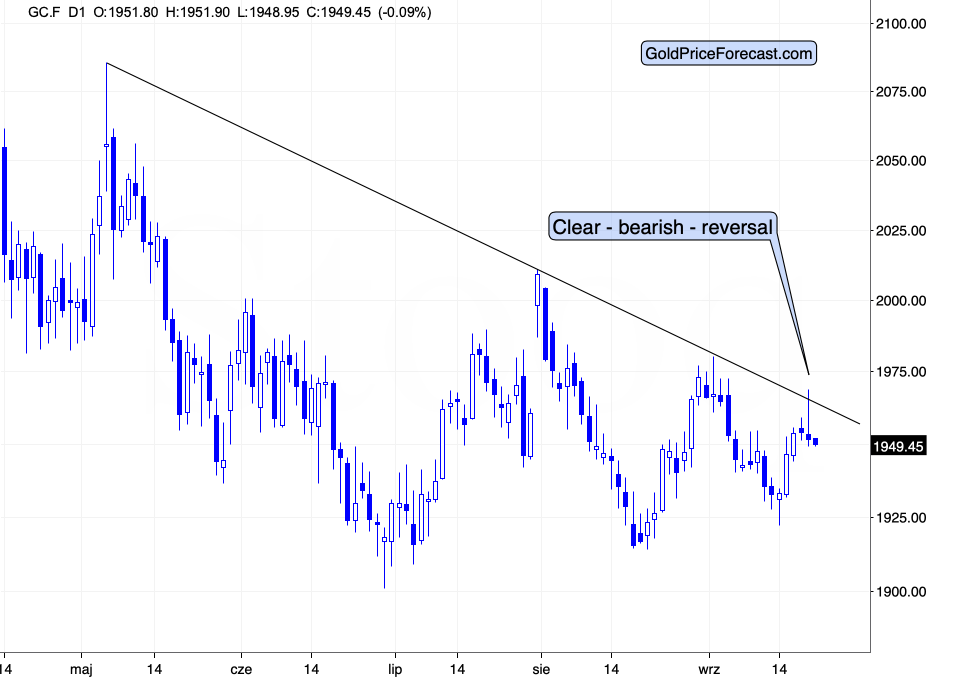
The reversal was clear, and if we want to be precise, gold moved slightly above the resistance line and then invalidated this tiny breakdown, which made the reversal even more bearish!
Besides, gold was not the only part of the precious metals sector that reversed in a profound manner. We saw the same things in silver and mining stocks.
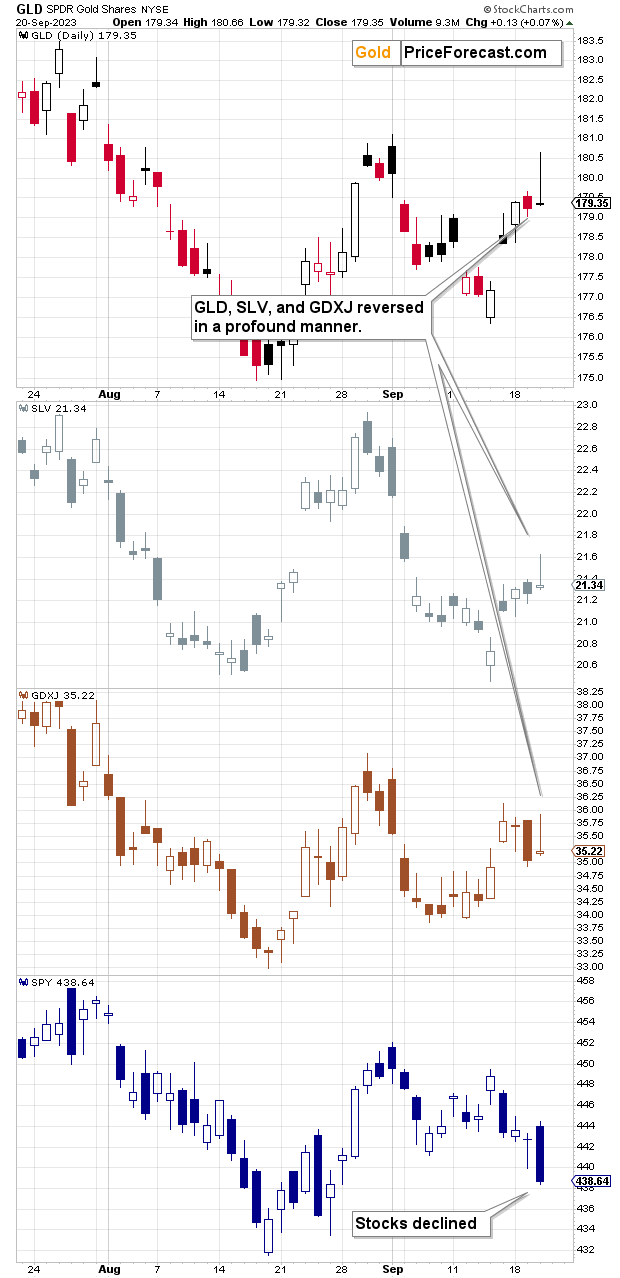
The gravestone doji candlesticks are a form of an intraday reversal, which is likely to be followed by lower prices.
Since we saw not one but three of such reversals, the overall bearish implications are much stronger than if we just saw one. This further reinforces the scenario that I featured previously – namely, the precious metals sector corrected after the bullish reversal, but it wasn’t likely to correct substantially before turning south once again. What we just saw is a confirmation that the move lower is about to start. It’s not yet too late to position oneself to benefit from it, but it might soon be.
Let’s focus on silver for a bit.
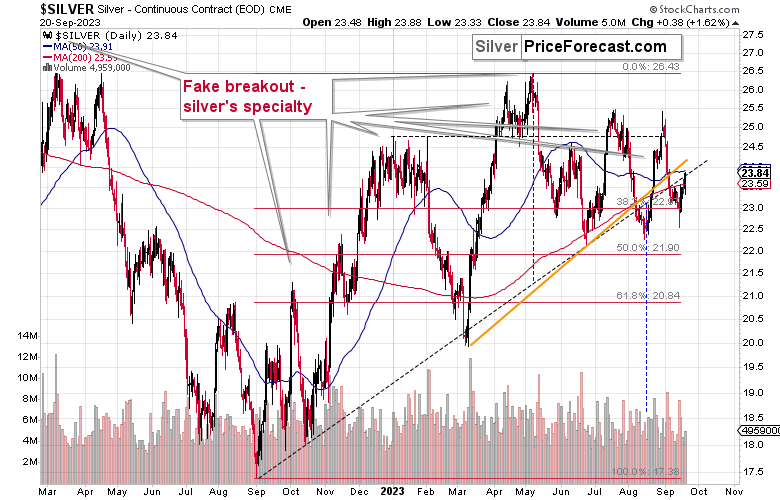
The white metal moved to its 50-day moving average as well as its rising resistance line.
This means that it moved higher enough to form a top.
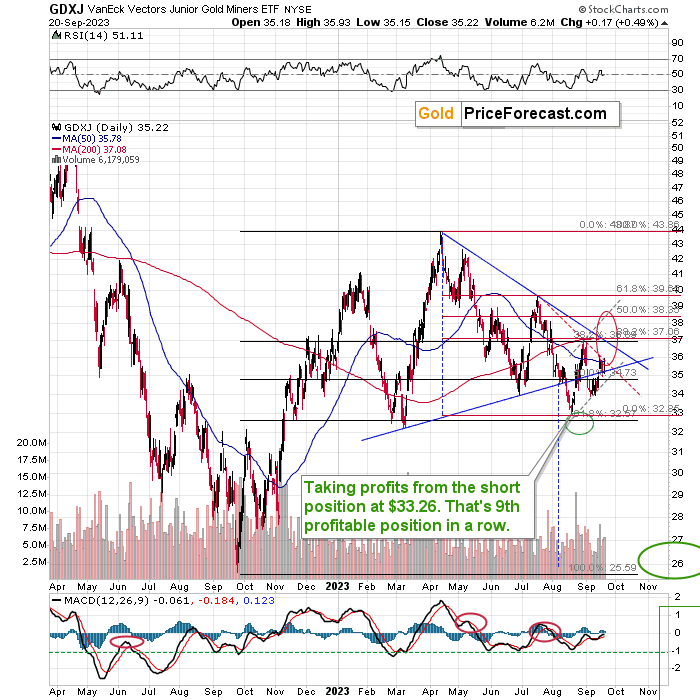
The GDXJ didn’t even move as high as I was originally expecting it to move (while gold did), but this only confirms the bearish nature of the most recent price moves. The move up was the correction, while the move lower was the real thing.
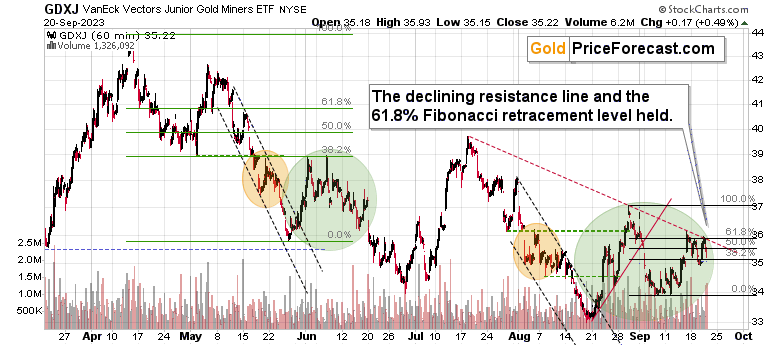
The declining red resistance line managed to stop the decline along with the help of the very short-term 61.8% Fibonacci retracement that’s visible on the lower of the above charts.
What’s most bullish about the above charts is that the GDXJ didn’t even manage to move above its recent high, slightly above $36, while gold did the analogous thing.
The relative weakness, the resistance levels that were reached, the reversals – it all points to lower junior mining stock prices in the following days and weeks.
On top of that, let’s keep in mind that we saw a breakdown in the Toronto Stock Exchange Venture Index, which also serves as a very-long-term proxy for junior miners, as so many of them are included in this index.
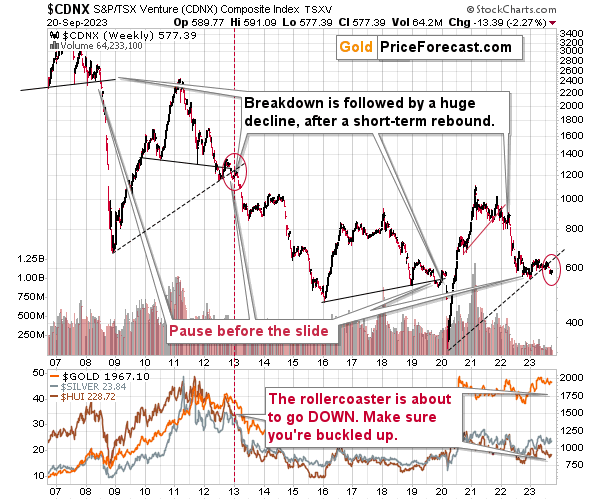
When we saw something similar in early 2013, an enormous decline followed. The current breakdown is clearly visible.
It has begun.
Speaking of long-term charts, here’s one featuring copper.
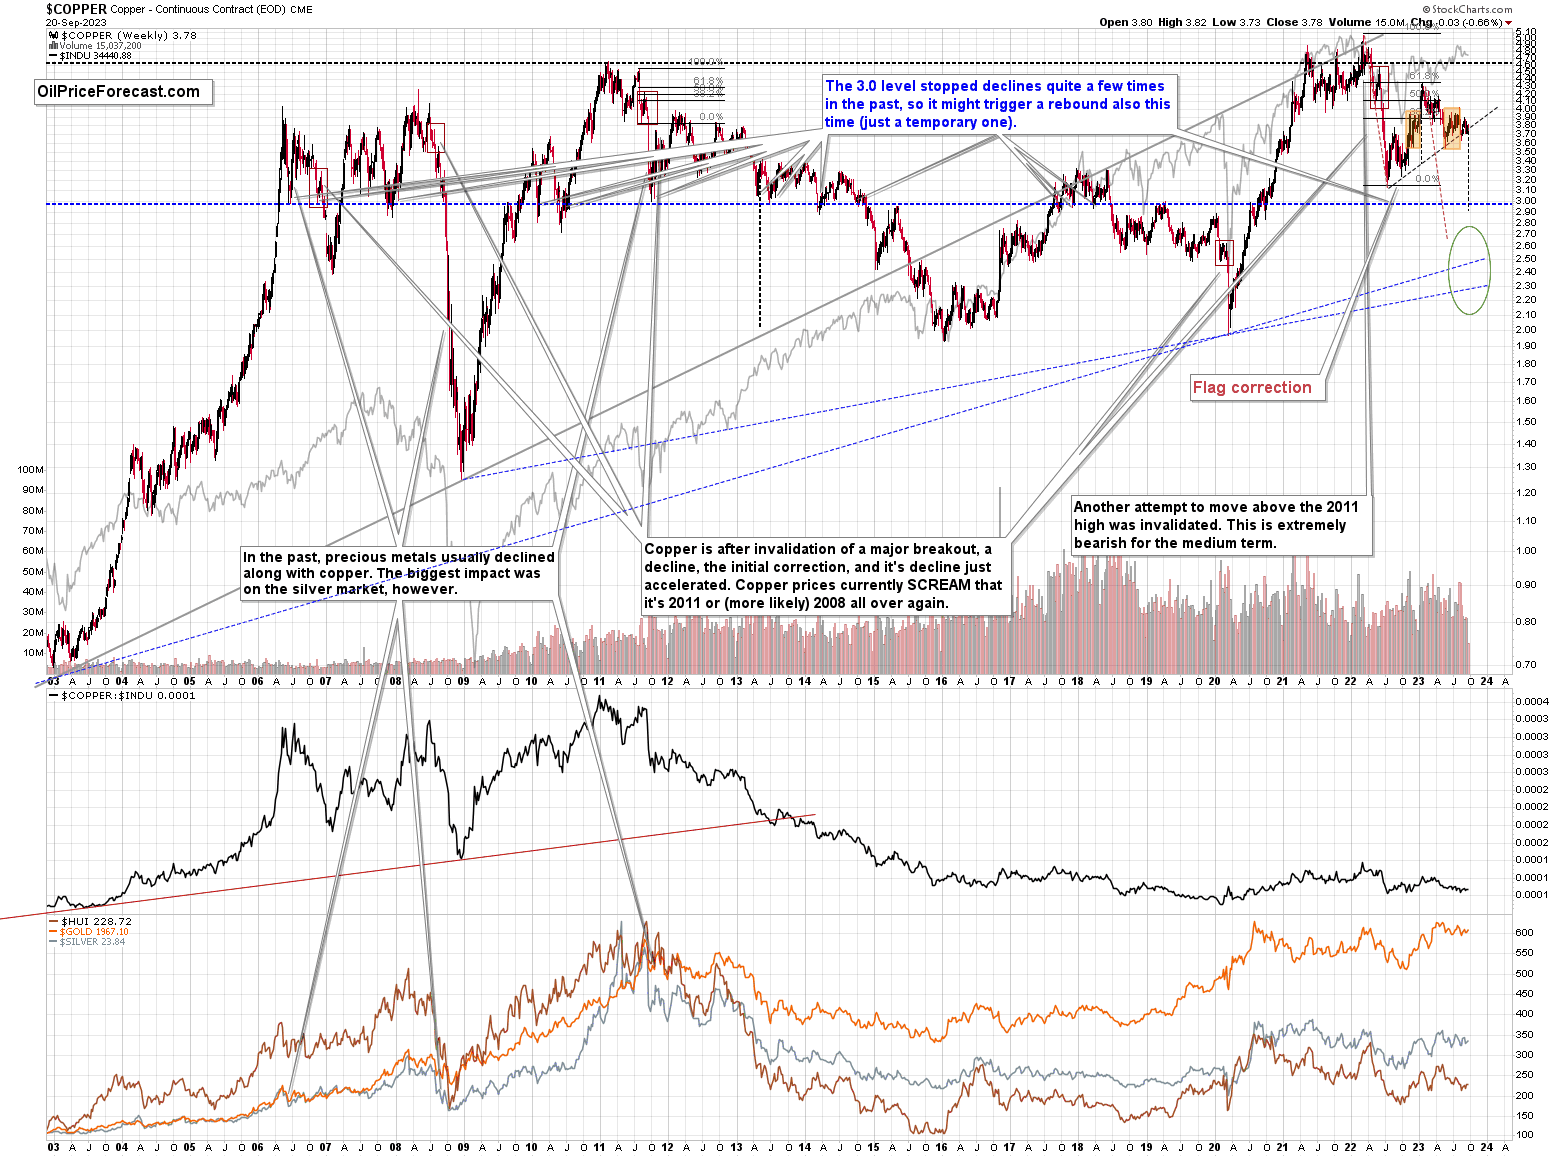
Copper appears to be on the verge of breaking below the rising support line based on its 2022 and 2023 lows. This breakdown would also mean the creation of the head-and-shoulders pattern, with the downside target slightly below the $3.0 level.
The weakness that we recently saw in one of the key copper (and gold) stocks – FCX – confirms that.
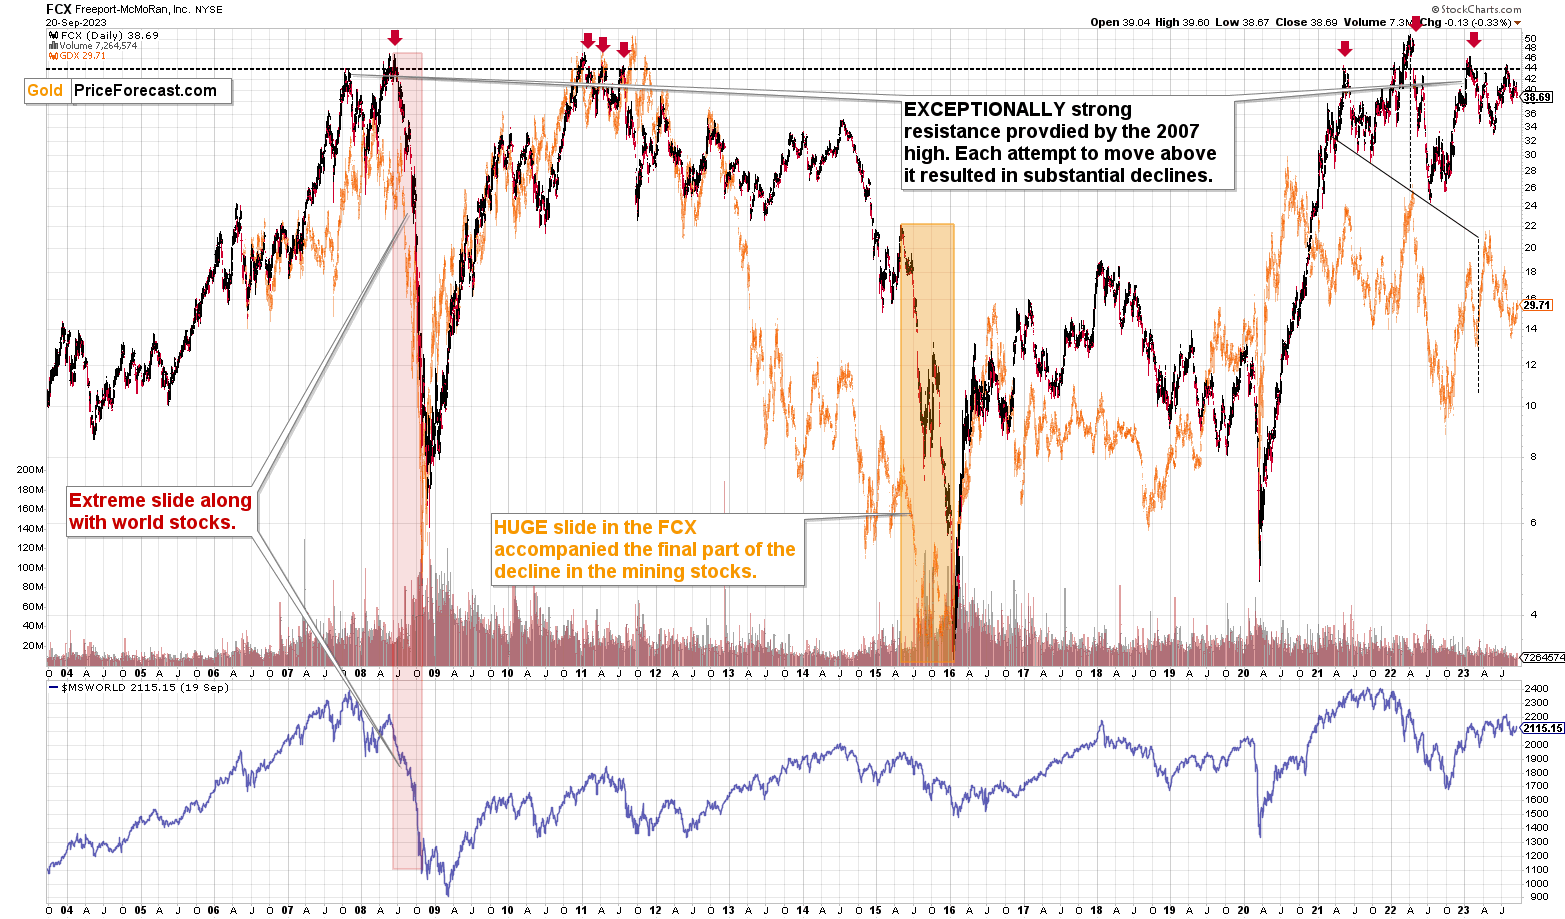
FCX tried to move above its 2007 high, and it failed. All previous attempts like that failed, and they were all followed by either sizable or enormous declines. So far, the current move lower is not that significant, which means that there’s likely more downside ahead.
Other stocks are likely to decline, too.
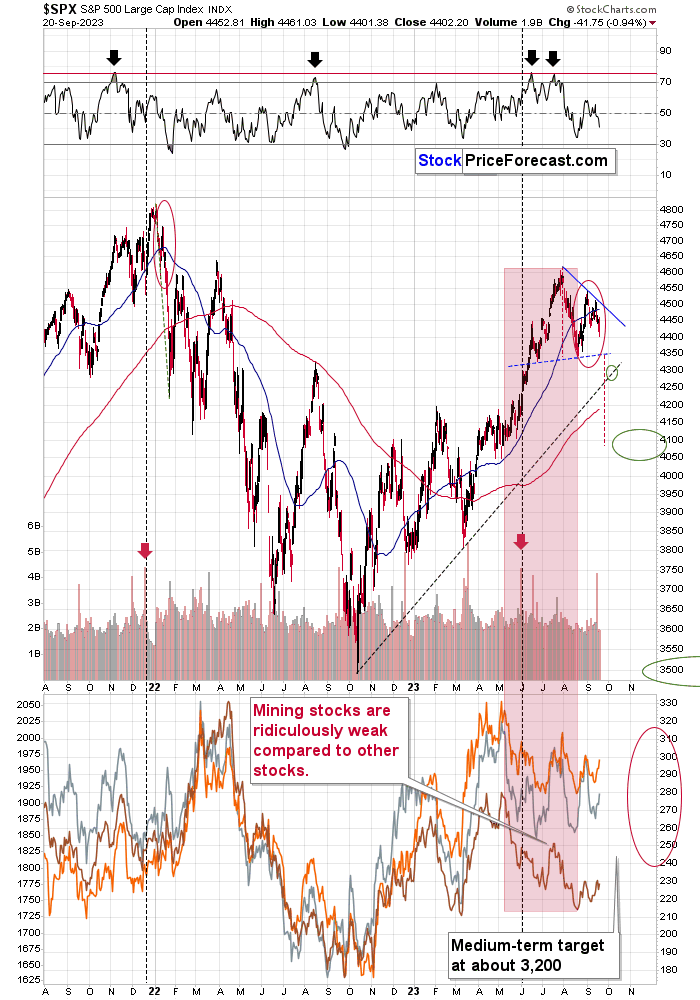
The S&P 500 moved higher recently, but it didn’t move above its declining blue resistance line, so it was not a big deal.
And indeed, stocks have declined after touching that resistance line.
The bearish head and shoulders pattern that started in June will be completed once stocks move below 4,350. Then, they will be on their way to slide to about 4,100, which in turn is likely to lead to much lower precious metals’ prices, in particular junior mining stocks’ prices, which are highly correlated with stocks.
Based on where the next support lines are and what tends to happen after the head-and-shoulders patterns are completed, it might be the case that stocks decline to about 4,300 and then correct slightly before sliding to new short-term lows.
Meanwhile, here’s what the USD Index has been doing recently:
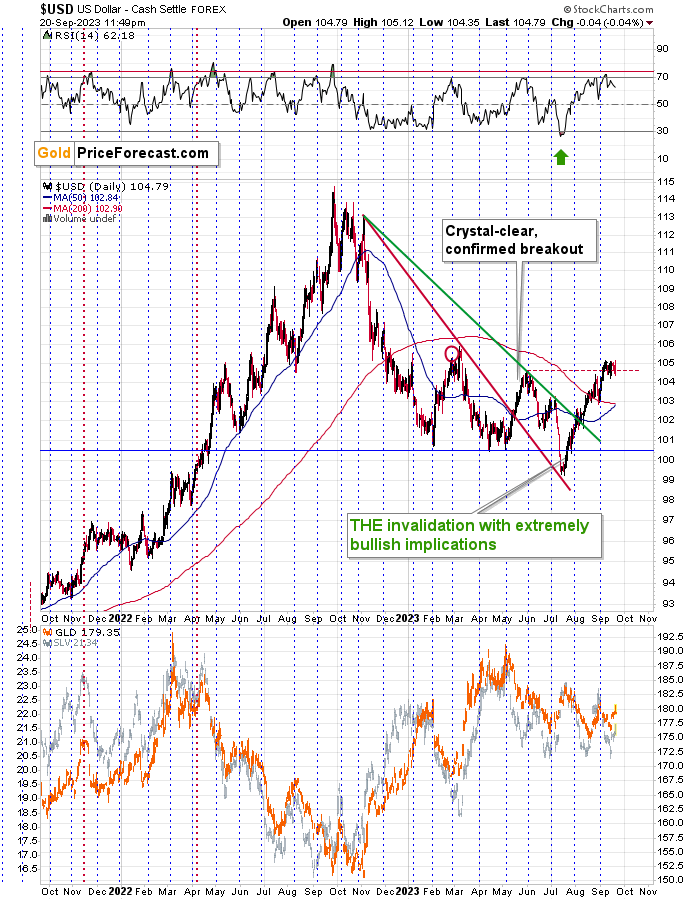
It’s been consolidating above its May/June highs, confirming the breakout above them. The U.S. currency appears ready to rally once again.
The context has been positive for many weeks now, and it continues to be the case right now. By “context” I mean the developments on the long-term USDX chart.
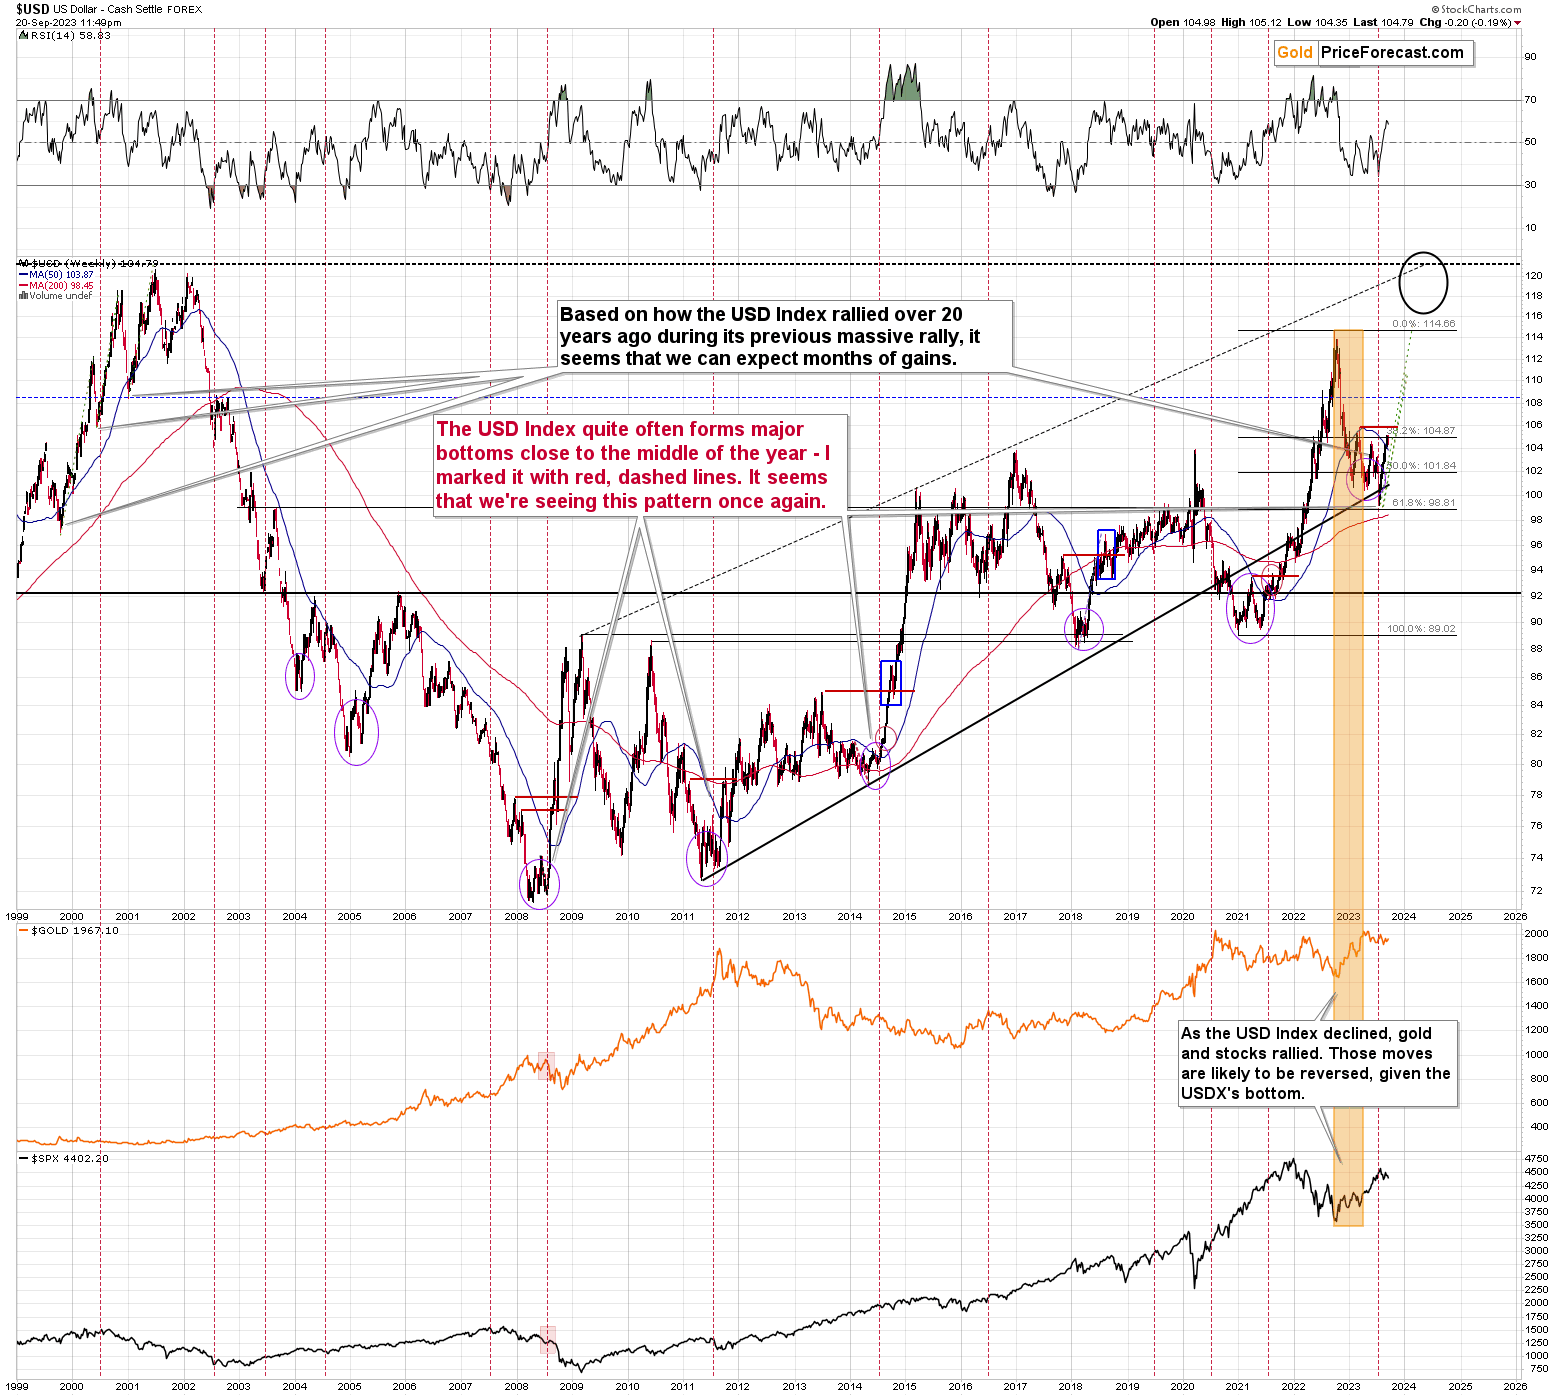
I copied the sizes of medium-term rallies from 2000 (when we saw a previous rally from similar price levels), and I marked them on the current situation with green. Based on what already happened, the USDX can keep on rallying until 110 or so before another meaningful (!) pullback. There might be smaller pullbacks earlier, though.
All in all, it seems that the corrective upswing that we were expecting to see is already over, and lower precious metals and mining stock values are just around the corner.
===
If you’d like to participate in my Mastering Multidimensional Wealth | 1:1 Coaching Experience (perhaps by re-investing some of your profits into yourself), or become a partner/investor in Golden Meadow, you’ll find more details in the above links.
Overview of the Upcoming Part of the Decline
- It seems that the recent – and probably final – corrective upswing in the precious metals sector is over.
- If we see a situation where miners slide in a meaningful and volatile way while silver doesn’t (it just declines moderately), I plan to – once again – switch from short positions in miners to short positions in silver. At this time, it’s too early to say at what price levels this could take place and if we get this kind of opportunity at all.
- I plan to switch from the short positions in junior mining stocks or silver (whichever I’ll have at that moment) to long positions in junior mining stocks when gold / mining stocks move to their 2020 lows (approximately). While I’m probably not going to write about it at this stage yet, this is when some investors might consider getting back in with their long-term investing capital (or perhaps 1/3 or 1/2 thereof).
- I plan to return to short positions in junior mining stocks after a rebound – and the rebound could take gold from about $1,450 to about $1,550, and it could take the GDXJ from about $20 to about $24. In other words, I’m currently planning to go long when GDXJ is close to $20 (which might take place when gold is close to $1,450), and I’m planning to exit this long position and re-enter the short position once we see a corrective rally to $24 in the GDXJ (which might take place when gold is close to $1,550).
- I plan to exit all remaining short positions once gold shows substantial strength relative to the USD Index while the latter is still rallying. This may be the case with gold prices close to $1,400 and GDXJ close to $15 . This moment (when gold performs very strongly against the rallying USD and miners are strong relative to gold after its substantial decline) is likely to be the best entry point for long-term investments, in my view. This can also happen with gold close to $1,400, but at the moment it’s too early to say with certainty.
- The above is based on the information available today, and it might change in the following days/weeks.
You will find my general overview of the outlook for gold on the chart below:
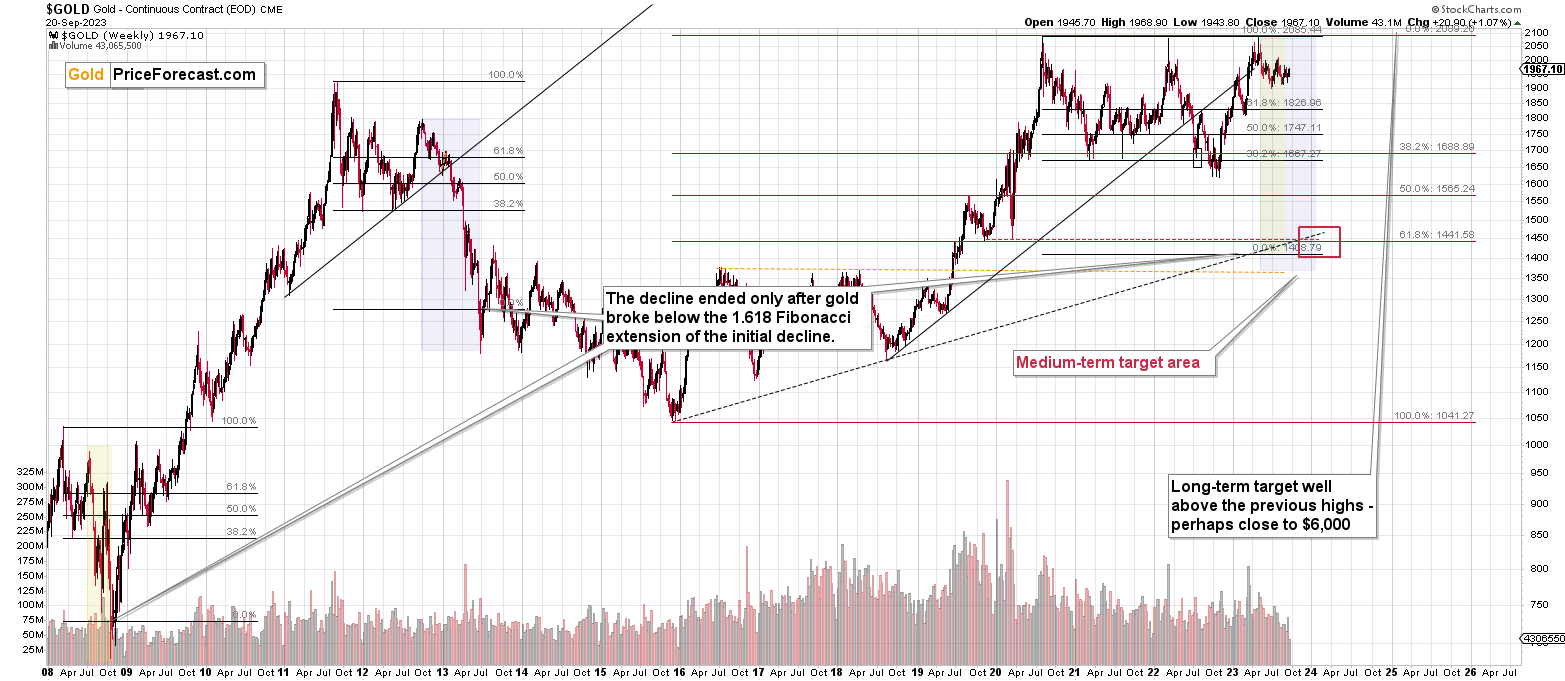
Please note that the above timing details are relatively broad and “for general overview only” – so that you know more or less what I think and how volatile I think the moves are likely to be – on an approximate basis. These time targets are not binding nor clear enough for me to think that they should be used for purchasing options, warrants, or similar instruments.
Letters to the Editor
Please post your questions in the comments feed below the articles, if they are about issues raised within the article (or in the recent issues). If they are about other, more universal matters, I encourage you to use the Ask the Community space (I’m also part of the community), so that more people can contribute to the reply and enjoy the answers. Of course, let’s keep the target-related discussions in the premium space (where you’re reading this).
Summary
To summarize, the medium-term trend in the precious metals sector remains clearly down, and it seems that the corrective upswing is already over and the profits on our current short position are going to increase. We just caught the 10th profitable trade in a row – congratulations. The outlook for the short positions in junior miners and in the FCX remains very favorable.
===
Finally, since 10th profitable trade in a row is such a great piece of news (and the same goes for the fact that the current short position is already profitable), here’s… Even more great news! The possibility to extend your subscription for up to three years (at least by one year) with a 20% discount from the current prices is still open.
Locking in those is a great idea not only because it’s perfect time to be ready for what’s next in the precious metals market, but also because the inflation might persist longer than expected and prices of everything (including our subscriptions) are going to go up in the future as well. Please reach out to our support – they will be happy to assist you and make sure that your subscription days are properly extended at those promotional terms. So, for how many years would you like to lock-in your subscription?
To summarize:
Short-term outlook for the precious metals sector (our opinion on the next 1-6 weeks): Bearish
Medium-term outlook for the precious metals sector (our opinion for the period between 1.5 and 6 months): Bearish initially, then possibly Bullish
Long-term outlook for the precious metals sector (our opinion for the period between 6 and 24 months from now): Bullish
Very long-term outlook for the precious metals sector (our opinion for the period starting 2 years from now): Bullish
As a reminder, Gold Investment Updates are posted approximately once per week. We are usually posting them on Monday, but we can’t promise that it will be the case each week.
Our preferred ways to invest in and to trade gold along with the reasoning can be found in the how to buy gold section. Additionally, our preferred ETFs and ETNs can be found in our Gold & Silver ETF Ranking.
Moreover, Gold & Silver Trading Alerts are posted before or on each trading day (we usually post them before the opening bell, but we don’t promise doing that each day). If there’s anything urgent, we will send you an additional small alert before posting the main one.
Thank you.
Przemyslaw K. Radomski, CFA
Founder, Editor-in-chief

