

Briefly: gold and the rest of the precious metals market are likely to decline in the next several weeks/months and then start another powerful rally. Gold’s strong bullish reversal/rally despite the USD Index’s continuous strength will likely be the signal confirming that the bottom is in.
The Weekly Fundamental Roundup
The fundamentals and technicals have performed as expected, with the PMs coming under heavy pressure in recent weeks. Initially, the crowd assumed that a higher U.S. federal funds rate (FFR) was a recipe for an immediate recession. However, we warned numerous times that long-term interest rates created demand destruction and were too low to upend American consumers.
Yet, long-term interest rates have risen dramatically, and it’s likely only a matter of time before an ominous economic event unfolds (which has been the case throughout history). So, while gold remains relatively uplifted, the GDXJ ETF and silver have been significant underperformers, and we believe more downsides should commence before potential relief rallies unfold.
Stubborn Fundamentals Keep a Lid on Gold
While the crowd assumed a new bull market was underway, we warned that higher interest rates and a stronger USD Index would remain a thorn in gold’s side. And while the yellow metal has demonstrated relative strength, other areas of the precious metals market haven’t been so lucky.
For example, silver and the GDXJ ETF have dramatically underperformed, and the latter’s weakness has boosted the profits from our short position.
Please see below:
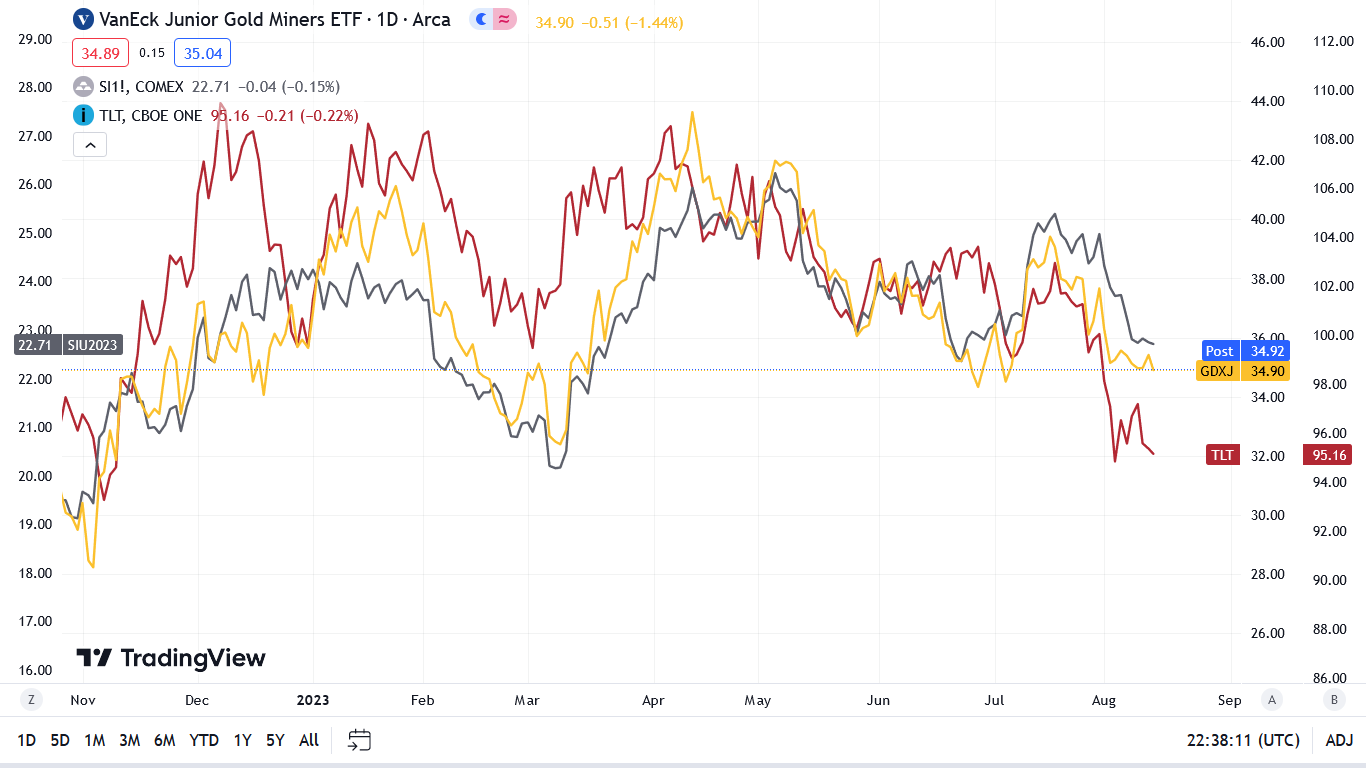
To explain, the gold line above tracks the GDXJ ETF, the gray line tracks the silver futures price, and the red line tracks the iShares 20+ Year Treasury Bond (TLT) ETF. If you analyze their recent movement, you can see that lower TLT prices (higher long-term interest rates) have not been celebrated by the PMs.
And with the development unfinished, we believe more pain should confront the PMs before long positions are justified.
Please see below:
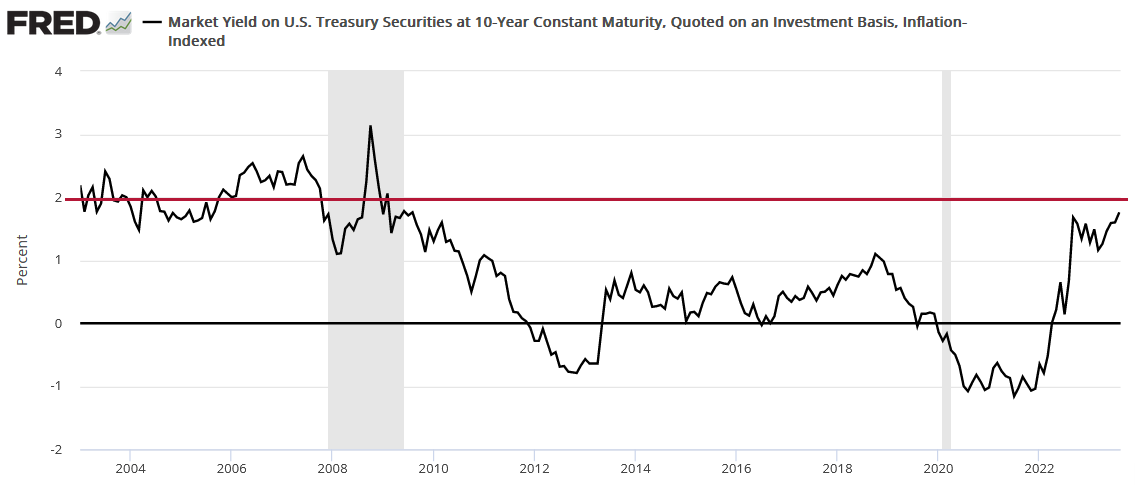
To explain, the black line above tracks the U.S. 10-Year real yield. And when nominal interest rates rise faster than inflation expectations, real interest rates increase, which is bearish for assets like silver and gold. Consequently, the surge on the right side of the chart is part of the reason why the GDXJ ETF ended the Aug. 14 session down substantially from its Dec. 31, 2020 close.
More importantly, while the U.S. 10-Year real yield hit a new cycle high of 1.83% on Aug. 3, more upside should occur over the medium term. The horizontal red line above marks the 2% level. And as you can see, the metric surpassed 2% numerous times from 2003 through 2008. Furthermore, those readings occurred when inflation was less problematic than it is now. As such, if (when) the U.S. 10-Year real yield hits 2%+, the PMs should come under immense pressure.
Dollar Prospects
The USD Index is an important variable that has risen materially since bottoming in July. And while it’s still early, Europe’s economic underperformance should weigh on the EUR/USD and keep the USD Index uplifted in the back half of 2023. We wrote on Jul. 14:
While no one cares right now, investors’ appetite for European risk assets should come under immense pressure over time, and the USD Index should be a primary beneficiary.
Please see below:
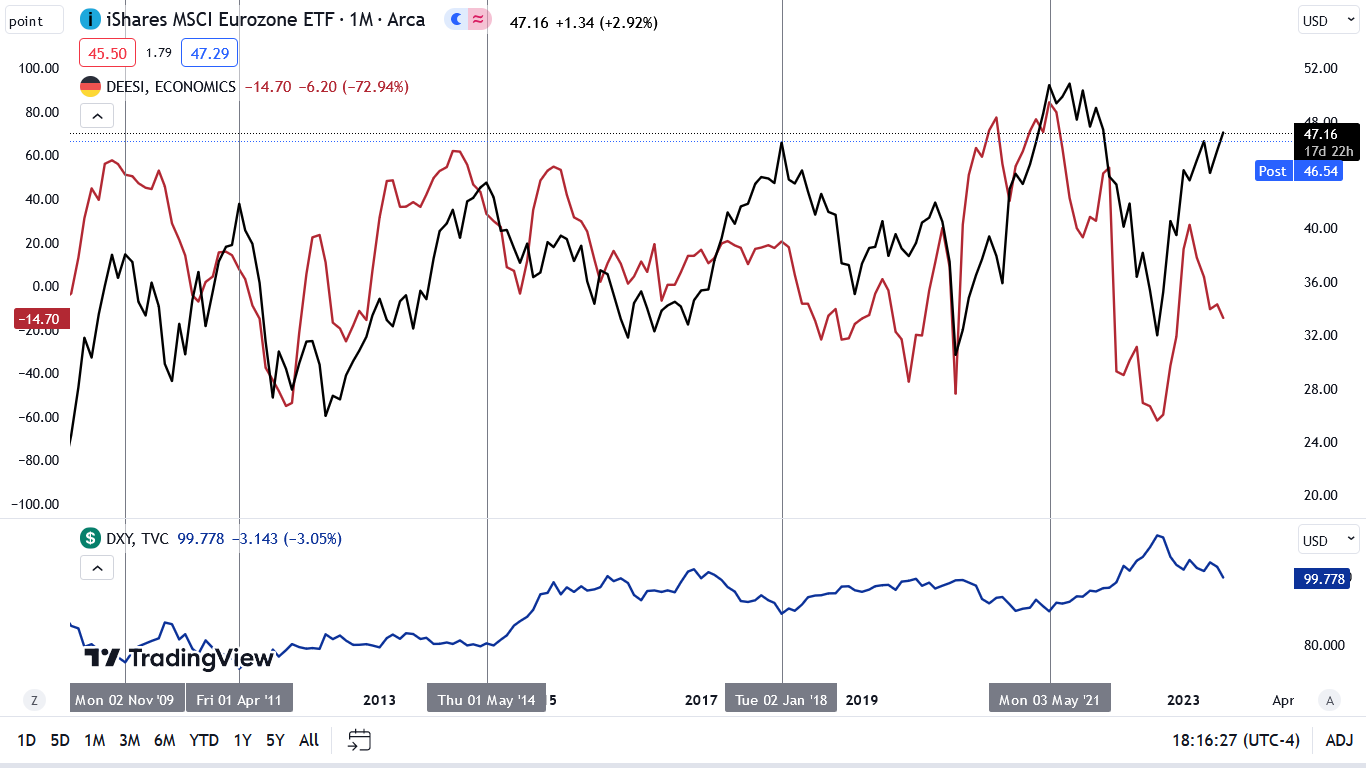
To explain, the black line above tracks the monthly movement of the iShares MSCI Eurozone (EZU) ETF, while the red line above tracks the German ZEW Economic Sentiment Index. As you can see, when weak economic sentiment plagues Europe, its stock markets suffer mightily.
Yet, if you analyze the right side of the chart, you can see that the EZU ETF closed at a new 2023 high on Jul. 13, while the ZEW ESI has materially diverged. However, since 2009, the EZU ETF has not been able to prosper when the ZEW ESI crashes, and this time should be no different.
To that point, please turn your attention to the blue line at the bottom, as it tracks the USD Index. If you analyze the vertical gray lines, you can see that when the EZU ETF peaks and begins its descent, the USD Index bottoms and begins its ascent.
Thus, with the prediction proving prescient, the EZU ETF’s recent decline has coincided with a USD Index rally.
Please see below:
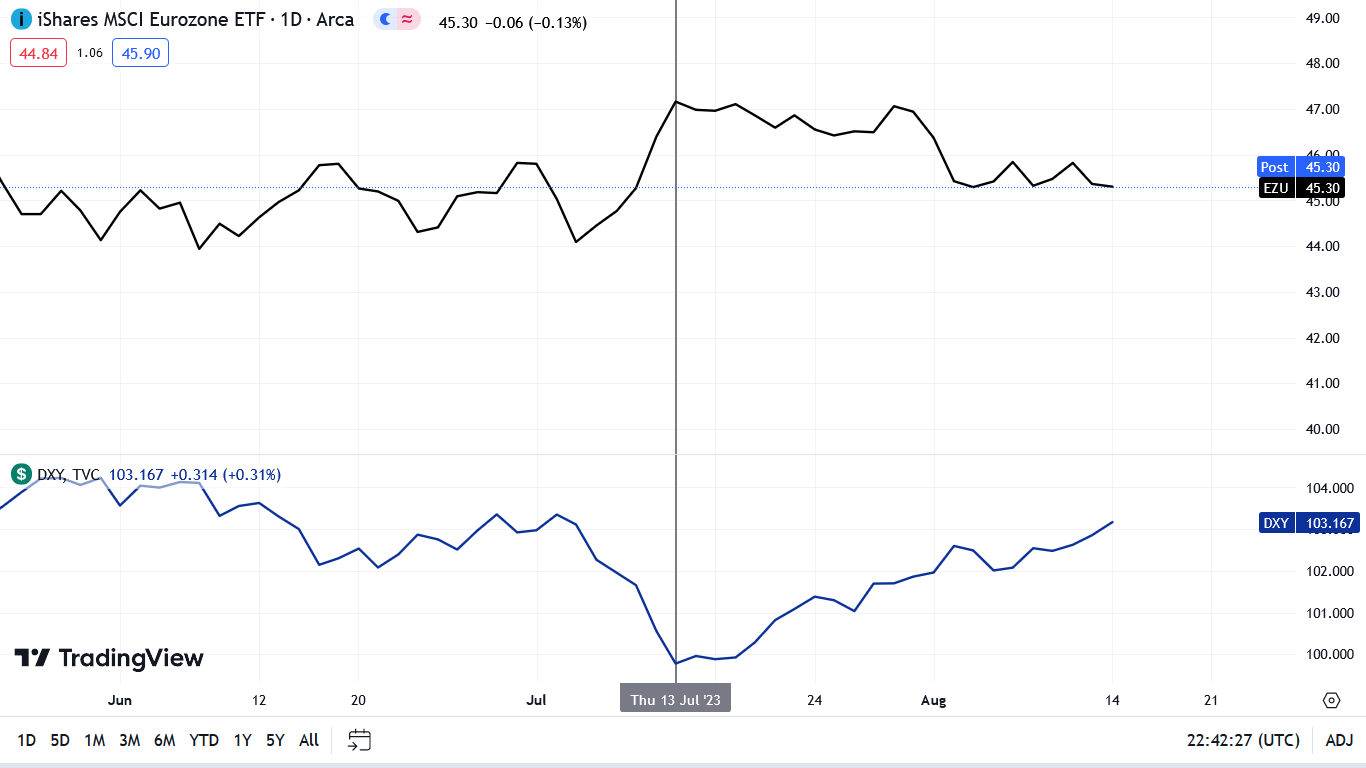
To explain, the black line above tracks the EZU ETF, while the blue line at the bottom tracks the USD Index. As you can see, the relationship has held, as expected, and we believe it will intensify as the Fed and the ECB continue to battle inflation and higher oil prices.
Overall, the fundamentals remain aligned with our expectations, as the USD index has rallied, and nominal and real interest rates have followed suit. Moreover, the weakness of gold, silver, and mining stocks has occurred alongside a relatively strong stock market. But, if the S&P 500 corrects, it should put downward pressure on the PMs and lead to even more profits for our short position.
Do you think the U.S. 10-Year real yield will hit 2%?
Silver Lost Its 200-Day MA
After bouncing off the key level in June, silver is now materially below its 200-day moving average. And with the metric a barometer of a healthy uptrend, the white metal’s price action aligns with its bearish fundamentals. Plus, gold has broken below its 50-day MA, and the technical damage should be concerning to the medium-term bulls.
Furthermore, with Fed officials hinting at more hawkish policy in the months ahead, higher-for-longer interest rates should continue to boost our GDXJ ETF short position. For example, Fed Governor Michelle Bowman said on Aug. 5:
“I also expect that additional rate increases will likely be needed to get inflation on a path down to the FOMC’s 2% target…. We should remain willing to raise the federal funds rate at a future meeting if the incoming data indicate that progress on inflation has stalled.”
Likewise, Richmond Fed President Thomas Barkin said on Aug. 3:
“Inflation remains too high,” and officials should be wary of declaring the “job done.”
Also, while Philadelphia Fed President Patrick Harker wants to “hold rates steady” on Aug. 8, he added:
“We will need to be there for a while. The pandemic taught us to never say never, but I do not foresee any likely circumstance for an immediate easing of the policy rate.”
So, with even cautious participants advocating to hold the FFR where it is, a lack of dovish policy should hurt silver in the back half of 2023. Remember, as inflation comes down and the FFR remains constant, it pushes up short-term real yields.
For context, real interest rates should be analyzed by subtracting breakeven inflation rates from their identical nominal yield. However, since the FFR is a current metric, we can compare it to the current headline Consumer Price Index (CPI).
Please see below:
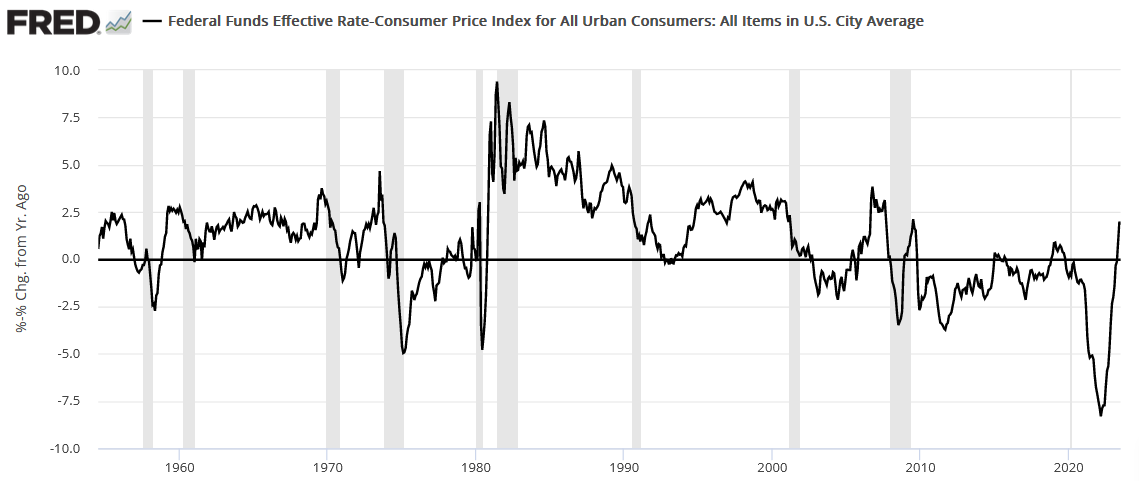
To explain, the black line above subtracts the year-over-year (YoY) percentage change in the headline CPI from the FFR. If you analyze the right side of the chart, you can see that the metric has gone from deeply negative to materially positive.
Yet, like the U.S. 10-Year real yield still has an upside, in our opinion, the metric above hit 3.84% in 2006, which is well above the current reading of 1.82%. Therefore, while problematic inflation could usher the FFR higher, an ominous economic event or further disinflation could also help it reach the 2006 highs. Thus, we still expect more upside for short and long-term real interest rates, and that’s bullish for the USD Index and bearish for the PMs.
On top of that, the QT liquidity drain remains on schedule, and a continuation of the theme is also bearish for gold, silver, and mining stocks.
Please see below:
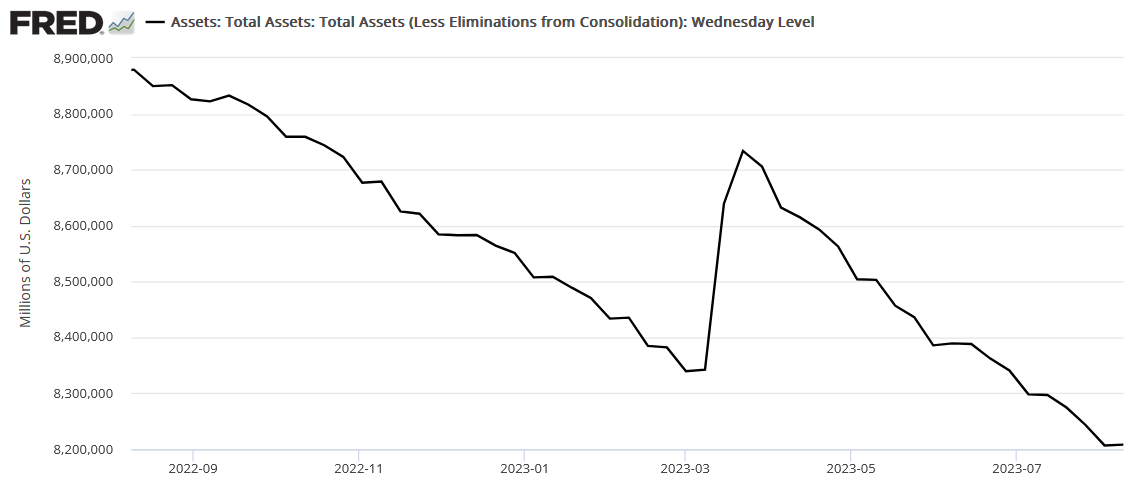
To explain, the black line above tracks the Fed’s balance sheet. If you analyze the right side of the chart, you can see that new cycle lows have become the norm, and this is unlikely to stop unless (until) the U.S. economy falls off a cliff. So, while we believe this cycle ends with a recession, when it finally hits, history shows financial market sell-offs are well underway before the Fed can stop the bleeding.
Forthcoming Inflation
While the recent CPI print met expectations on Aug. 10, month-over-month (MoM) readings of 0.20% would be celebrated by the Fed if they continued. But, the CPI numbers did not reflect the recent surge in commodity prices.
Please see below:
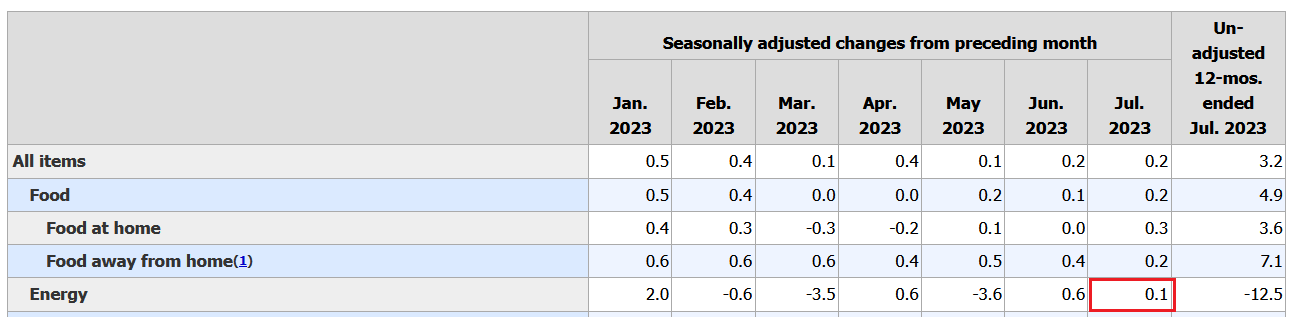
To explain, the energy component of the headline CPI only increased by 0.10% MoM in July. However, crude oil prices have rallied hard since the end of June, as has the S&P GSCI (commodity index). As a result, these input pressures should put upward pressure on inflation in the future.
To that point, the Cleveland Fed expects the headline CPI to rise by 0.77% MoM in August, which reflects the recent commodity rally.
Please see below:
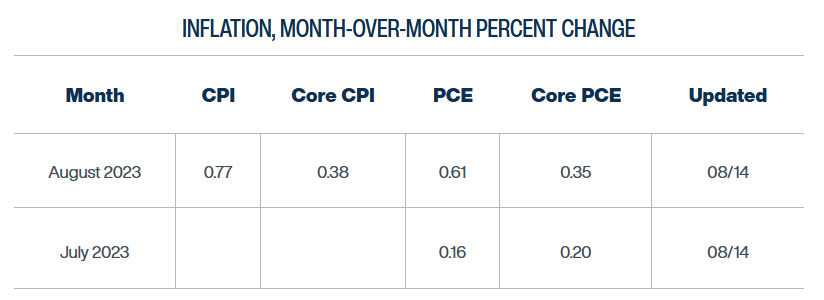
So, with base effects ending in June and higher commodity prices poised to filter into the CPI in the months ahead, it creates a bullish backdrop for inflation. And with higher interest rates and continued QT also part of the cocktail, volatility should rise dramatically relative to H1 2022. As such, several financial assets should suffer crises of confidence as the weather turns.
Overall, the outlooks for the PMs remain bearish because the outlooks for real yields and the USD Index remain bullish. Moreover, the higher long-term interest rates go, the greater the chance of an ominous economic event unfolding. Thus, with the GDXJ ETF closing below $35 and increasing the profits from our short position, the S&P 500 should be the next casualty. As such, we expect the junior miners to head lower and produce further gains on the short side in the weeks ahead.
Do you think the liquidity drain will create more problems for financial assets in the fall and winter months?
The Bottom Line
Hawkish realities have reigned recently, as the bond market has begun to price in the economic fundamentals. In other words, lower long-term interest rates are stimulative, and positioning for a recession often prevents it from occurring.
Conversely, with rates ratcheting higher, mortgage loans, auto loans, and other financing products have become more expensive. And as higher borrowing costs reduce Americans’ disposable incomes, a Minsky Moment should strike the financial markets when investors realize what it takes to eradicate inflation.
In conclusion, the PMs declined on Aug. 14, as higher interest rates and a stronger U.S. dollar undermined their performance. And with the gambit poised to continue, we anticipate further weakness before a short-term buying opportunity emerges.
What to Watch for This Week
With more U.S. economic data releases next week, the most important are as follows:
- Aug. 15: U.S. retail sales, New York Fed Empire Manufacturing Index
While it will take time for rising Treasury yields to disrupt the U.S. economy, consumption should suffer as higher interest rates eat away at Americans’ disposable income. Thus, monitoring retail sales will provide important clues.
In addition, the New York Fed’s regional survey will clarify how manufacturing firms in New York State feel about higher borrowing costs.
- Aug. 16: FOMC Minutes
While Fed officials have been united in their hawkish stance, the FOMC Minutes should showcase their rate-hike expectations in the months ahead.
- Aug. 17: Philadelphia Fed Manufacturing Index
Similar to the New York Fed’s survey, the Philadelphia Fed’s results will provide an early look at how the recent rate rise impacts Pennsylvania businesses.
All in all, economic data releases impact the PMs because they impact monetary policy. Moreover, if we continue to see higher employment and inflation, the Fed should keep its foot on the hawkish accelerator. If that occurs, the outcome is profoundly bearish for the PMs.
Overview of the Upcoming Part of the Decline
- It seems that the recent – and probably final – corrective upswing in the precious metals sector is over.
- If we see a situation where miners slide in a meaningful and volatile way while silver doesn’t (it just declines moderately), I plan to – once again – switch from short positions in miners to short positions in silver. At this time, it’s too early to say at what price levels this could take place and if we get this kind of opportunity at all.
- I plan to switch from the short positions in junior mining stocks or silver (whichever I’ll have at that moment) to long positions in junior mining stocks when gold / mining stocks move to their 2020 lows (approximately). While I’m probably not going to write about it at this stage yet, this is when some investors might consider getting back in with their long-term investing capital (or perhaps 1/3 or 1/2 thereof).
- I plan to return to short positions in junior mining stocks after a rebound – and the rebound could take gold from about $1,450 to about $1,550, and it could take the GDXJ from about $20 to about $24. In other words, I’m currently planning to go long when GDXJ is close to $20 (which might take place when gold is close to $1,450), and I’m planning to exit this long position and re-enter the short position once we see a corrective rally to $24 in the GDXJ (which might take place when gold is close to $1,550).
- I plan to exit all remaining short positions once gold shows substantial strength relative to the USD Index while the latter is still rallying. This may be the case with gold prices close to $1,400 and GDXJ close to $15 . This moment (when gold performs very strongly against the rallying USD and miners are strong relative to gold after its substantial decline) is likely to be the best entry point for long-term investments, in my view. This can also happen with gold close to $1,400, but at the moment it’s too early to say with certainty.
- The above is based on the information available today, and it might change in the following days/weeks.
You will find my general overview of the outlook for gold on the chart below:
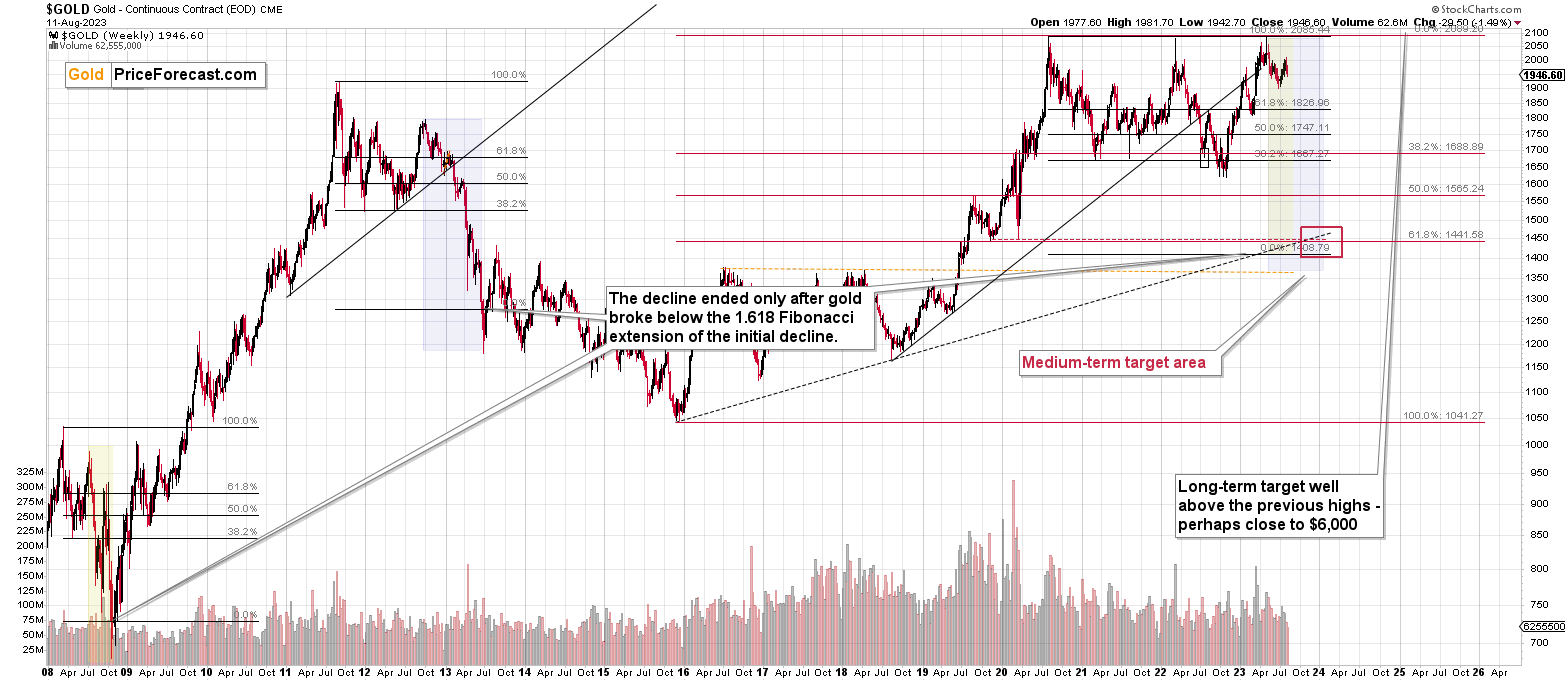
Please note that the above timing details are relatively broad and “for general overview only” – so that you know more or less what I think and how volatile I think the moves are likely to be – on an approximate basis. These time targets are not binding nor clear enough for me to think that they should be used for purchasing options, warrants, or similar instruments.
Letters to the Editor
Please post your questions in the comments feed below the articles, if they are about issues raised within the article (or in the recent issues). If they are about other, more universal matters, I encourage you to use the Ask the Community space (I’m also part of the community), so that more people can contribute to the reply and enjoy the answers. Of course, let’s keep the target-related discussions in the premium space (where you’re reading this).
Summary
To summarize, the medium-term outlook for the precious metals sector (and for the FCX) remains to be extremely bearish and the profit potential for short positions in junior miners and FCX remains enormous.
While I can’t promise any kind of return (nobody can), in my opinion, the recent profitable position in the FCX will soon be joined by even more profits, and the winning streak of trades that started in early 2022, will continue.
If I didn’t have a short position in junior mining stocks, I would be entering it now.
As always, we'll keep you – our subscribers – informed.
To summarize:
Short-term outlook for the precious metals sector (our opinion on the next 1-6 weeks): Bearish
Medium-term outlook for the precious metals sector (our opinion for the period between 1.5 and 6 months): Bearish initially, then possibly Bullish
Long-term outlook for the precious metals sector (our opinion for the period between 6 and 24 months from now): Bullish
Very long-term outlook for the precious metals sector (our opinion for the period starting 2 years from now): Bullish
As a reminder, Gold Investment Updates are posted approximately once per week. We are usually posting them on Monday, but we can’t promise that it will be the case each week.
Our preferred ways to invest in and to trade gold along with the reasoning can be found in the how to buy gold section. Additionally, our preferred ETFs and ETNs can be found in our Gold & Silver ETF Ranking.
Moreover, Gold & Silver Trading Alerts are posted before or on each trading day (we usually post them before the opening bell, but we don’t promise doing that each day). If there’s anything urgent, we will send you an additional small alert before posting the main one.
Thank you.
Przemyslaw K. Radomski, CFA
Founder, Editor-in-chief

