

Briefly: gold and the rest of the precious metals market are likely to decline in the next several weeks/months and then start another powerful rally. Gold’s strong bullish reversal/rally despite the USD Index’s continuous strength will likely be the signal confirming that the bottom is in
Welcome to this week's Gold Investment Update.
Predicated on last week’s price moves, our most recently featured medium-term outlook remains the same as the price moves align with our expectations (and we not only took profits from two previous short positions, but we profited on the rebound and currently have unrealized gains on our current GDXJ ETF short). On that account, there are parts of the previous analysis that didn’t change at all in the earlier days and are written in italics.
The rapid rise in U.S. Treasury yields took somewhat of a breather this week as recession fears have whipsawed interest rates. Despite that, the USD Index showcased continued strength, and more upside should materialize over the medium term. Conversely, while gold has benefited from the Israel-Hamas war, mining stocks have underperformed, and their relative weakness should continue in the weeks ahead.
We’ll begin today’s alert by dissecting the fundamentals and then dive into the technical aspects that have proven so prescient over the last several months.
Gold Should Heed Miners’ Warning
While risk assets attempt to break free of their bearish corrections, gold’s relative outperformance has the yellow metal shining bright. Despite that, we’ve booked 11-straight profitable trades, and our 12th (currently open) remains in the green. As a result, our success highlights why mining stocks are often better trading instruments than the yellow metal.
Furthermore, while gold has largely sidestepped the recent risk rout, a recession is bearish for nearly all assets, and gold should suffer mightily if (when) the economic pain unfolds.
For example, S&P Global released its U.S. Composite PMI on Oct. 25. And while the headline results were decent and it outperformed expectations, weakness was present beneath the surface. An excerpt read:
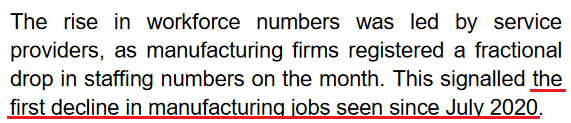
“Although some service providers highlighted a pick-up in customer numbers, many continued to note that high interest rates and challenging economic conditions weighed on client demand. Some mentioned smaller and less frequent orders being placed by customers. As such, service sector new business fell for a third month running.”
In addition:
“The rate of charge inflation eased to the weakest since June 2020 and was slower than the long-run series average. Firms were reportedly keen to pass through any cost savings made to customers in a bid to drive sales.”
Thus, while 2021 and 2022 (to a lesser extent) were filled with demand-driven inflation, those days are long gone. With firms increasing discounts to move inventory, consumer demand has suffered, and the weakness should continue in the months ahead.
More importantly, the “rate of employment growth was only marginal overall,” as firms remain concerned about costs and future demand conditions. Therefore, the economic backdrop is heading in the wrong direction, and silver could be a major casualty if the trend continues.
Please see below:
Car Trouble
With the crowd ignoring the ominous implications of rising long-term interest rates, the consensus assumes a recession is highly unlikely. For context, we wrote on Sep. 29:
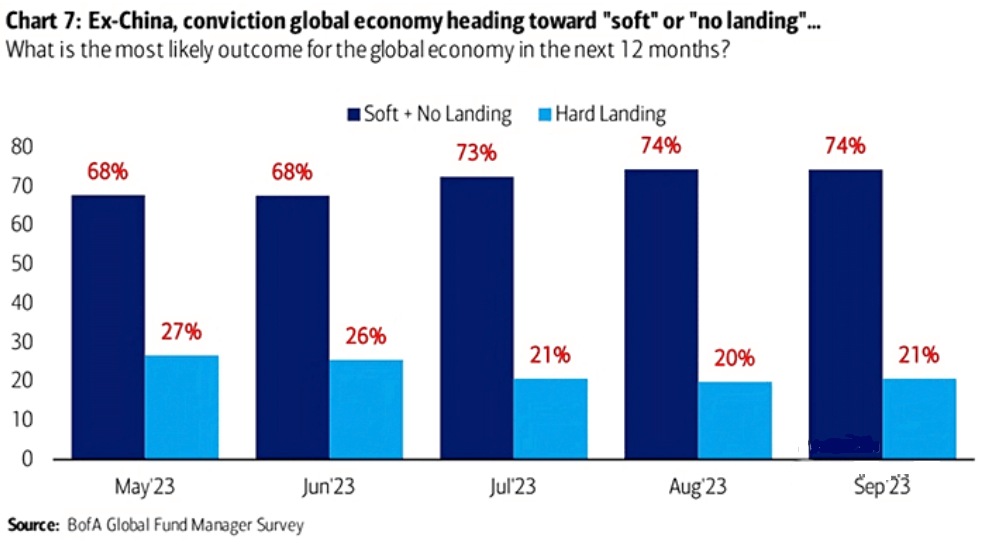
To explain, Bank of America’s latest Global Fund Manager Survey shows that only 21% of respondents expect a “hard landing” (the light blue bar) for developed markets over the next 12 months. Conversely, the majority expect a “soft” or “no landing” scenario to occur, which is a fairytale, in our opinion.
To that point, with auto-loan delinquencies hitting an all-time high, the problems should only intensify the longer rates remain elevated, and this is bad news for oil and the PMs. Bloomberg noted:
“The percent of subprime auto borrowers at least 60 days past due on their loans rose to 6.11% in September, the highest in data going back to 1994, according to Fitch Ratings.”
Please see below:
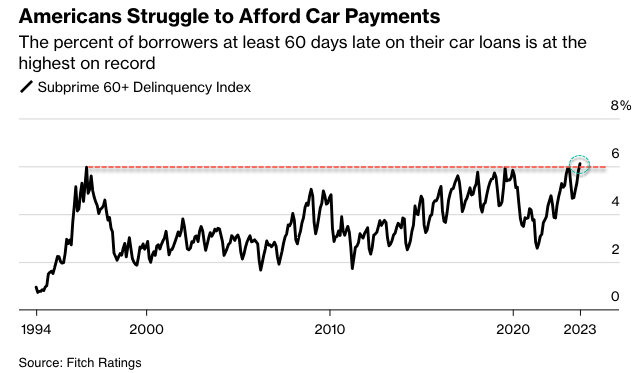
To explain, the black line above tracks the delinquency rate for subprime auto loans. If you analyze the right side of the chart, you can see that higher long-term interest rates impact the real economy.
Remember, the average auto loan length is 72 months, which means that financing rates are highly sensitive to the movements of the U.S. 5-year and 7-year Treasury yields. And with both rising substantially over the last few months, the scars should continue to show.
As another ominous sign, we warned the resumption of student loan repayments would further suppress consumers’ wallets. And with this occurring alongside higher borrowing costs and lower wage inflation, Americans have less disposable income.
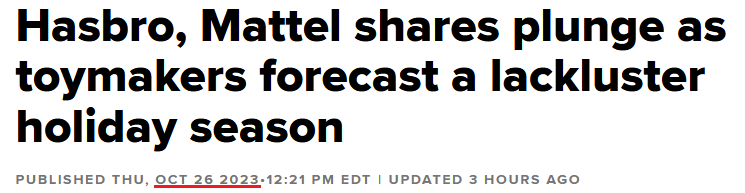
So, with U.S. toymakers sounding the alarm on Oct. 26, shares of Hasbro and Mattel sunk as consumers shunned holiday spending.
Please see below:
Moreover, we warned that darker days were on the horizon, and heightened volatility is bullish for the USD Index. We added on Sep. 29:
With less money to allocate to discretionary items, the current backdrop is much different than 2021/2022, in our opinion.
Please see below:
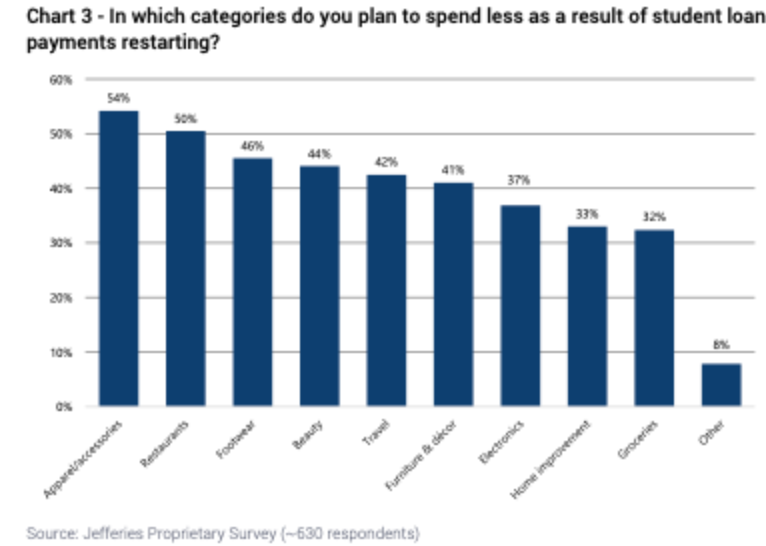
To explain, Jefferies surveyed student loan borrowers and found that roughly 40% to 50% plan to cut their spending on things like electronics, travel and apparel. As such, a confluence of factors has collided, making the economic outlook extremely unfriendly, and a Minsky Moment should help push the USD Index to new highs.
Overall, the S&P 500 has suffered, and the rout has not helped the GDXJ ETF. And with both assets declining alongside lower interest rates on Oct. 26, the results highlight how economic uncertainty often leads to liquidations across several risk assets. In contrast, Treasury bonds and the USD Index are the primary safe-havens. Consequently, more of the same should occur before the miners’ bear market ends.
Is Silver’s Sun Setting?
While a pause in central bank hawkishness was supposed to help silver, we warned that liquidations and lower interest rates are not reasons to celebrate. In contrast, when economic suffering elicits deflation (where we’re likely headed), silver, mining stocks, and the S&P 500 often decline in unison.
To that point, with the Bank of Canada (BoC) pausing on Oct. 25, the recent long-term rate surge has not painted a pretty portrait. The official release stated:
“In Canada, there is growing evidence that past interest rate increases are dampening economic activity and relieving price pressures. Consumption has been subdued, with softer demand for housing, durable goods, and many services. Weaker demand and higher borrowing costs are weighing on business investment…
“After averaging 1% over the past year, economic growth is expected to continue to be weak for the next year before increasing in late 2024 and through 2025. The near-term weakness in growth reflects both the broadening impact of past increases in interest rates and slower foreign demand.”
Remember, Canada sends nearly 80% of its exports to the U.S., so a slowdown in one region is bearish for the other.
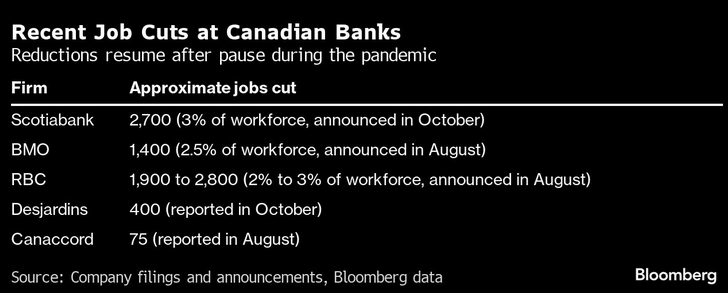
Speaking of which, banks are considered a bellwether of economic growth. A prosperous economy leads to business investment and consumer purchases, which are financed by the largest banks. But, with job cuts dominating the headlines, Canadian behemoths are shedding employees, which is bearish for economically sensitive assets like oil.
Please see below:
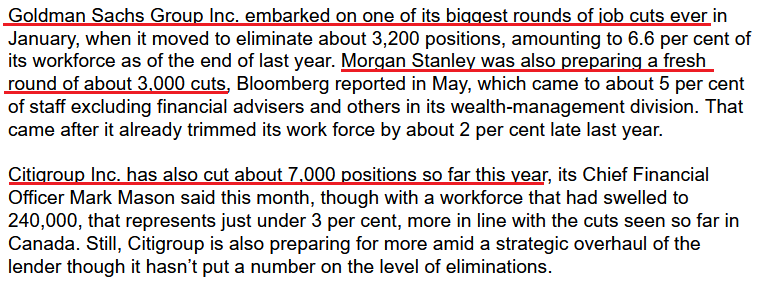
Likewise, U.S. institutions are also reducing their headcount, and “as credit conditions deteriorate, with housing and commercial real estate under pressure, the banks are expected to take significant loan-loss provisions in the fiscal fourth quarter.”
Please see below:
So, while we were economic bulls throughout 2021 and 2022, despite the recession hysteria, the outlook has completely flipped. Now, we see a recession as highly likely, while the crowd assumes central banks have the situation under control. In other words, we view the current misguided narrative as transitory 2.0.
And if (when) the optimism turns to pessimism, the USD Index should soar, while mining stocks and silver should be the hardest hit.
European Struggles
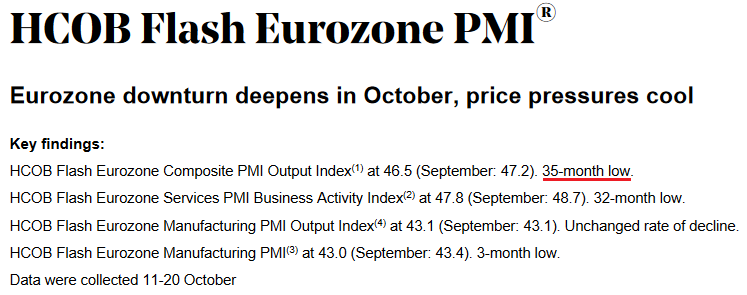
It’s not only Canada that confronts an ominous economic backdrop. In fact, Europe may be worse off, and the U.S. is unlikely to sidestep a slowdown in both or one of these regions. For example, S&P Global released its HCOB Eurozone Composite PMI on Oct. 24. The report stated:
“The Eurozone economic downturn accelerated at the start of the fourth quarter, with private sector output declining at the steepest rate for over a decade if pandemic affected months are excluded.
“New orders also fell at an accelerating rate, pointing to a worsening demand environment for both goods and services. Companies cut employment as a result, representing the first drop in headcounts since the lockdowns of early 2021, and remained focused on cost-cutting inventory management.”
Please see below:
Thus, while we warned that European economic suffering would stifle the EUR/USD and uplift the USD Index, the fundamentals have performed as expected. Likewise, the euro’s weakness has been a bad development for gold.
Overall, the fundamentals remain aligned with our thesis. The first stage of hawkish central banks and higher interest rates has passed, and now the second stage of a recession that sinks the PMs to their final lows is in progress. As such, mining stocks and the S&P 500’s next major sell-off should occur alongside lower interest rates.
The Bottom Line
While lower interest rates should be bullish for the PMs and bearish for the USD Index, that was not the case on Oct. 26. With recession fears popping up once again, the real safe-haven trade made a comeback. And with more of the same poised to materialize over the medium term, the PMs likely have a tough road ahead.
In conclusion, the PMs were mixed on Oct. 26, as gold ended the day in the green. However, mining stocks continue to underperform, and their weakness is a bearish sign for the yellow metal.
Technically Speaking
They say timing is everything, and our decision to re-enter our GDXJ ETF short position occurred at nearly the perfect moment. Mining stocks have remained under pressure, and the technicals have provided a reliable roadmap for how to capture profits and still manage risk. As a result, I continue to see more downside ahead, and please read my analysis from Oct. 26 for more information on how the weeks ahead should unfold.
In yesterday’s analysis, I wrote that the very recent corrective upswing was normal in this part of the decline and that lower mining stock prices were to be expected.
Indeed, that’s exactly what happened. Let’s start today’s analysis with a quote from [Oct. 25]:
Miners moved higher yesterday, and while they didn’t move up as much as they had moved down on Monday, some might say that this was bullish.
I disagree. It was normal. And I have a chart to back it up.
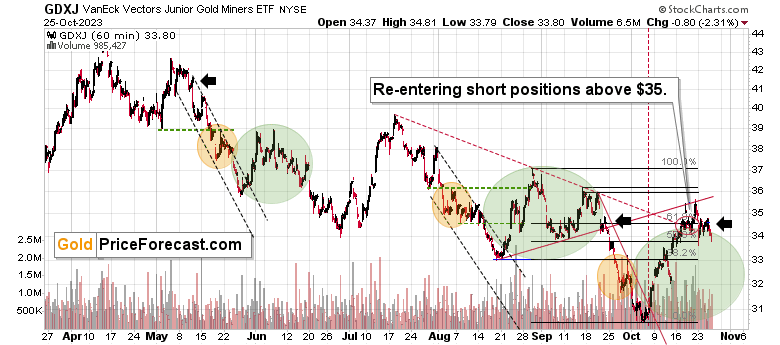
The above chart features the GDXJ from the hourly point of view – each candlestick represent 1 hour. This perspective can be misleading while trying to project long-term price moves, but it does a great job at discovering very short-term similarities and applying the technical analysis in this way. For example, it can shed some light on what type of intraday behavior is normal after a top, and what type of behavior is not normal, suggesting some kind of change in the pattern/trend.
Thanks to this perspective, we know that seeing a small upswing right after the initial post-top decline is something normal. I marked the current situation as well as the analogous (mid-September and mid-May) situations with black arrows.
Since this kind of performance took place after tops and before the vast majority of the short-term move lower, it’s actually a bearish confirmation – not a bullish invalidation.
Looking at the GDXJ from a broader point of view, we see just how well the recent triangle-vertex-based reversal worked.
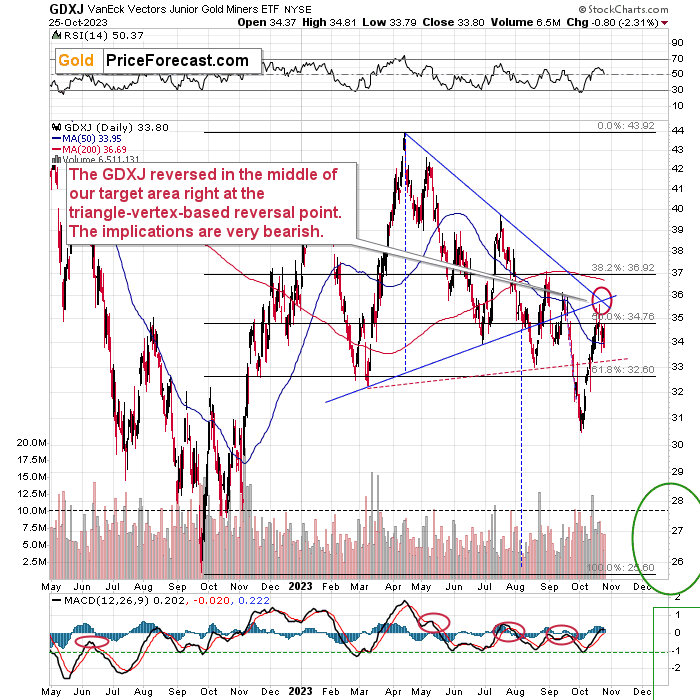
As of yesterday’s close, the GDXJ is about $1.40 below the entry level for the current short positions. And given how junior miners underperformed gold once again, it seems that the decline has just begun.
My previous comments on the TSXV remain up-to-date as well:
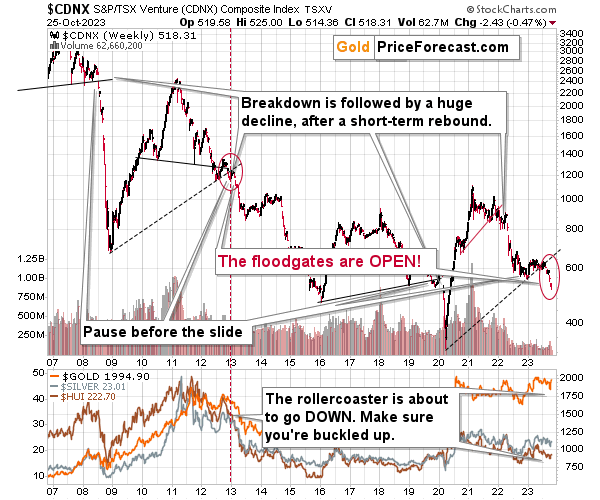
The above chart features the Toronto Stock Exchange Venture Index, which serves as a long-term proxy for junior miners, as so many of them are listed in that index. The TSXV is not something covered frequently by most gold experts, and in my view – incorrectly so.
The thing is that this index not only broke below its long-term support line, but that it also moved visibly lower and that we saw something very similar in 2008 and 2013 in early parts of the massive declines in the mining stocks (and in the rest of the precious metals sector). That’s the key piece of news.
So, while the very short-term chart suggests that the mining stocks are about to move lower shortly, the long-term chart shows just how dire the situation really is.
Also, did you see that the USD Index just reversed after (almost) touching its 50-day moving average?
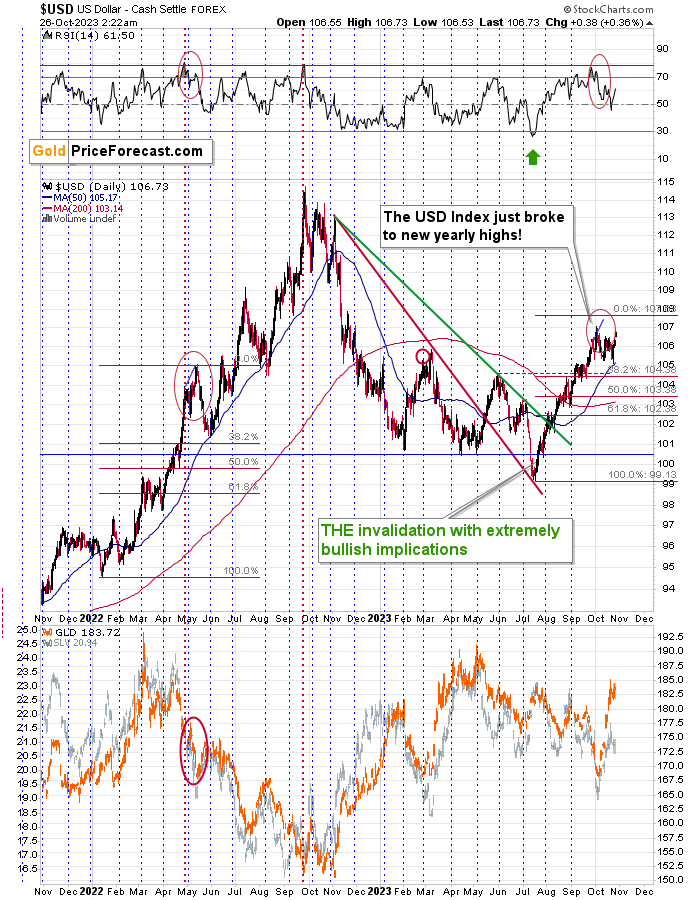
Back in June 2022, after a similarly big rally, the USD Index finished its pullback very close to that moving average. Consequently, seeing a similar move and then a sharp rebound, might indicate that the correction is already over and that another big move higher in the USDX is about to start.
This, of course, is likely to have negative implications for the precious metals sector. After all, the price of gold can’t really disconnect from the value of the currency it’s being priced in.
After I had written the above, the USD Index rallied, confirming the bullish scenario. But can the USD Index really rally significantly now, given that it rallied already so much this year?
Yes!
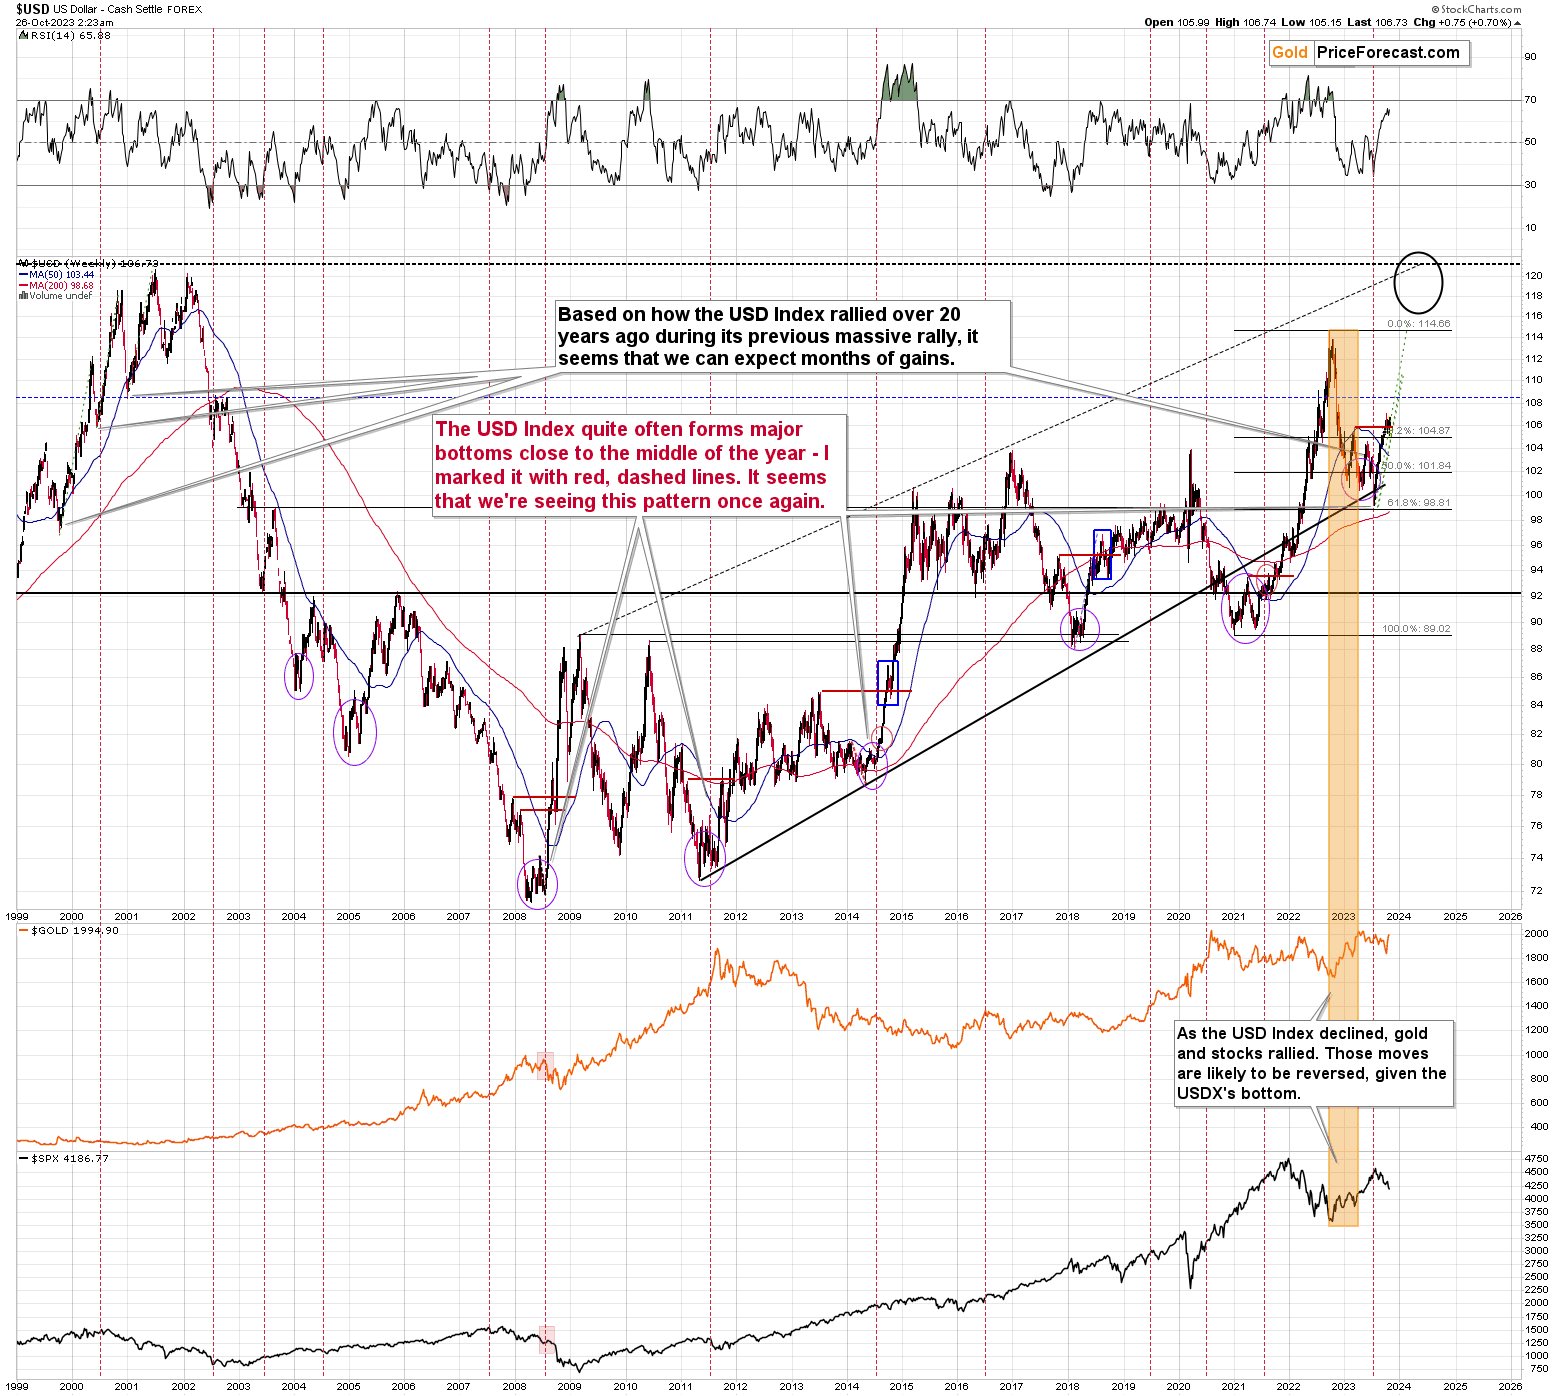
Zooming out allows us to clearly see that when the USD Index was previously soaring from similar levels (over 20 years ago), the sizes of rallies were much bigger than what we saw so far this year.
This analogy suggests that the USD Index has plenty of space to rally, and since the history tends to rhyme, the implications are bullish.
Gold price moved higher on Wednesday, and this move might be confusing. Is the pullback over? Or is this a broader top?
Let’s take a look at the charts to find out.
In short, the current situation is similar to what we saw in May, and it’s also like something that we used to see earlier this year. The March, April, and May tops were close to each other. That didn’t prevent gold from declining, and neither will it prevent gold from declining right now.
How do we know that gold is likely to decline from here and not rally, just like the USD Index? For example, because mining stocks declined recently, underperforming gold – and that’s what tends to happen before bigger declines in the precious metals sector.
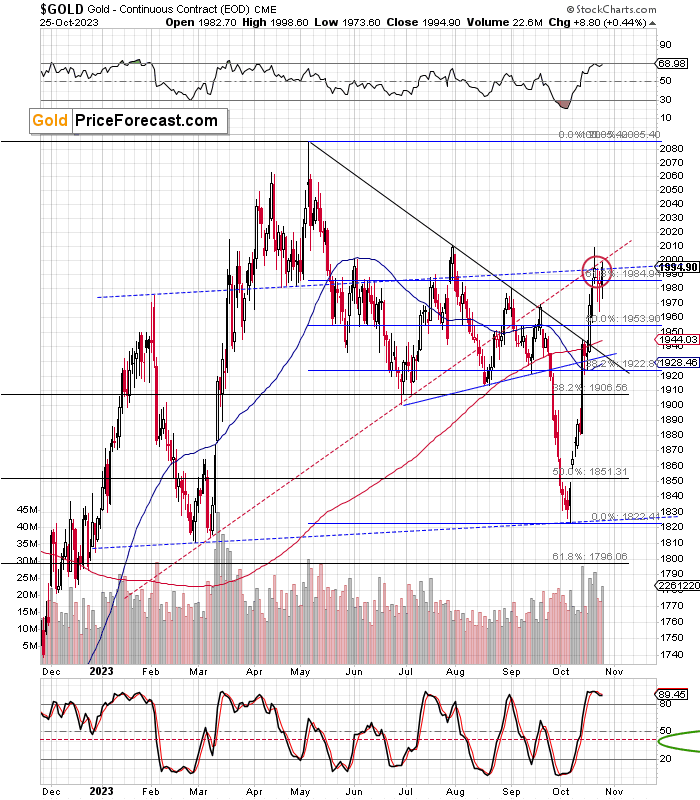
Besides, the RSI based on the price of gold continues to point to an extremely overbought situation, as it’s very close to 70.
The price of gold reversed after reaching a combination of resistance levels and it declined in tune with gold’s triangle-vertex-based reversal point.
The rising and declining resistance/support line crossed last week, and that’s when the top formed.
Moreover, please note that in the last several years, gold was rather weak in November, and it was rather strong in December. This does not bode well for the gold price forecast for the next several weeks. As for December – we’ll see. Depending on how fast the gold price will slide in November and how low it will go, the December rally might turn out to be just a December correction. We’ll know more when we get closer to December.
All in all, we have quite a lot of confirmations that gold is about to move lower.
Additionally, points that I made last week about the current concern with war remain up-to-date:
The current action in the precious metal sector continues to be determined by the increasing concern/interest in war, so that’s what I’m going to start today’s chart analysis with.
The below chart features the interest in war in Google News in the U.S.
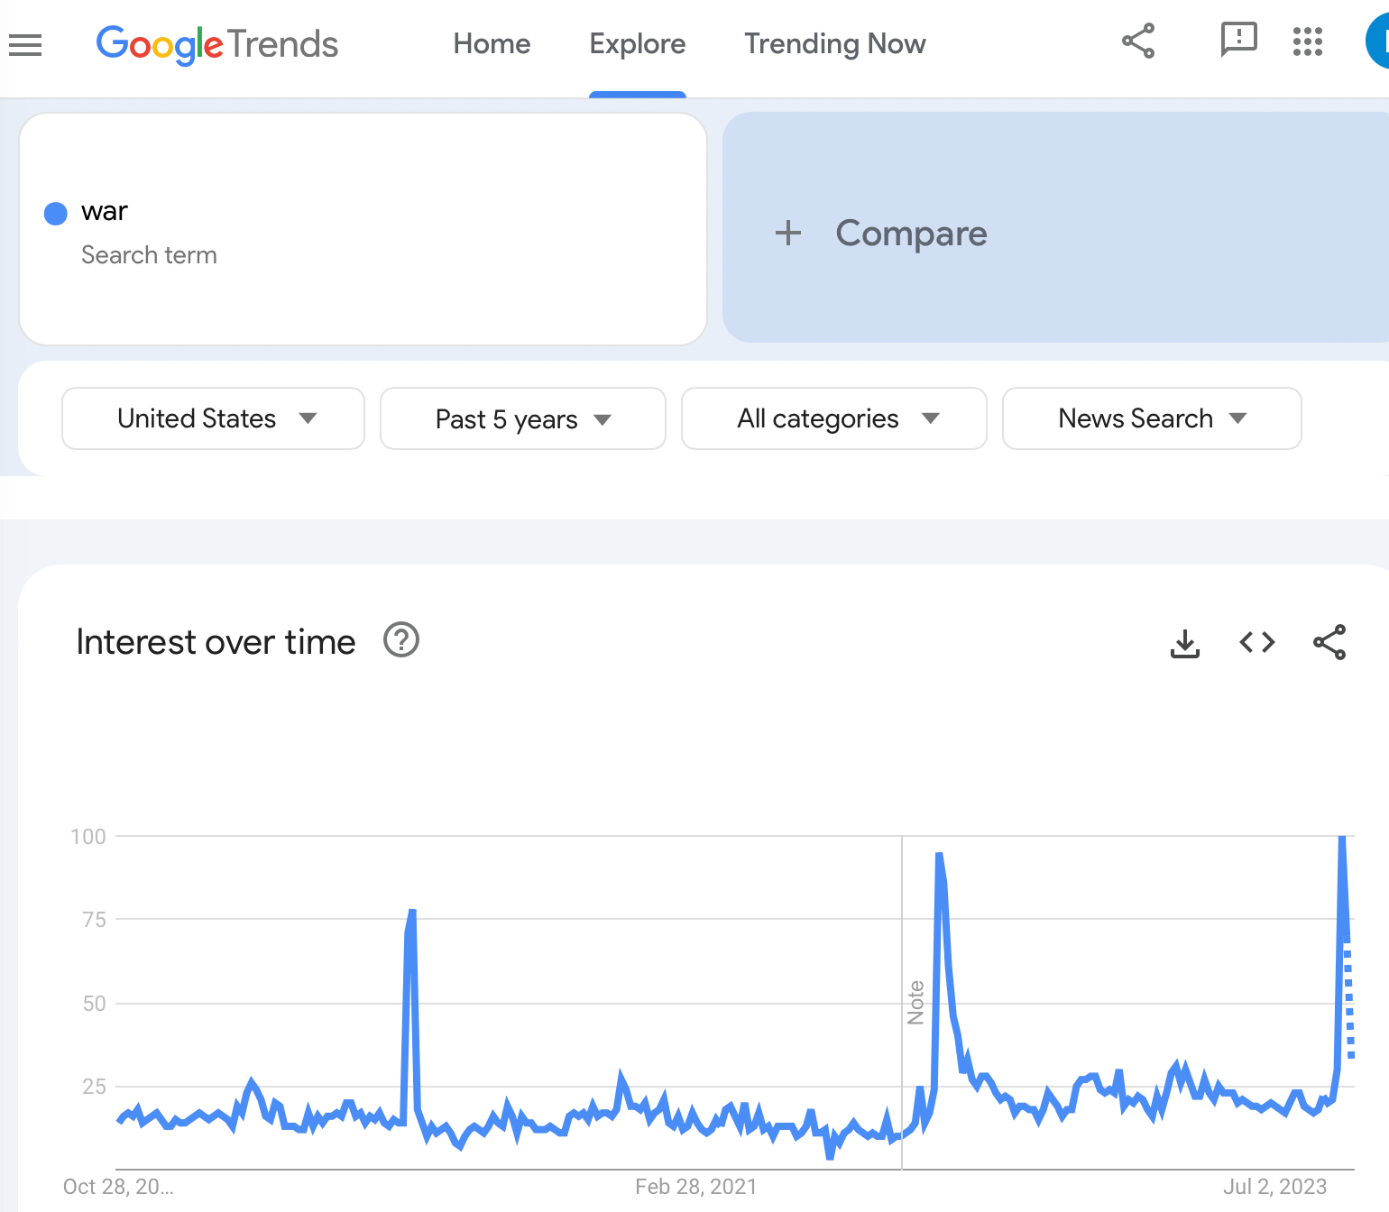
The current situation is analogous to what we saw right before and right after the Russian invasion in 2022.
Now, since the market generally “buys the rumor and sells the fact”, gold is rallying primarily based on increasing fear or uncertainty, which is connected to, but no the same thing as actual events.
This concern can be measured by how frequently the term “war” is being searched in Google (in particular, in Google News – this part of Google’s service is used to get… well, news, which helps to isolate the concern with the current conflict).
The key thing that is happening this week is that after last week’s peak, it seems that this week’s interest is about to decline a bit. We still have just partial data as the week is not over yet, but it’s enough to see how analogous the situation is to the Feb 27 – Mar 5, 2022 week.
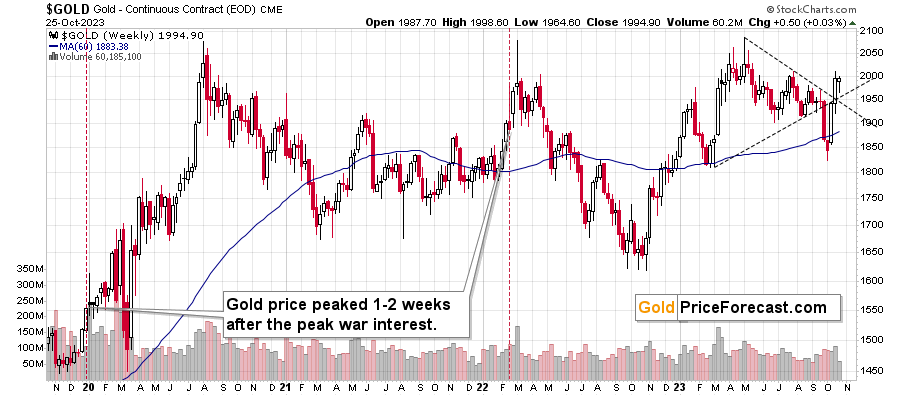
And guess what happened in gold at that time…
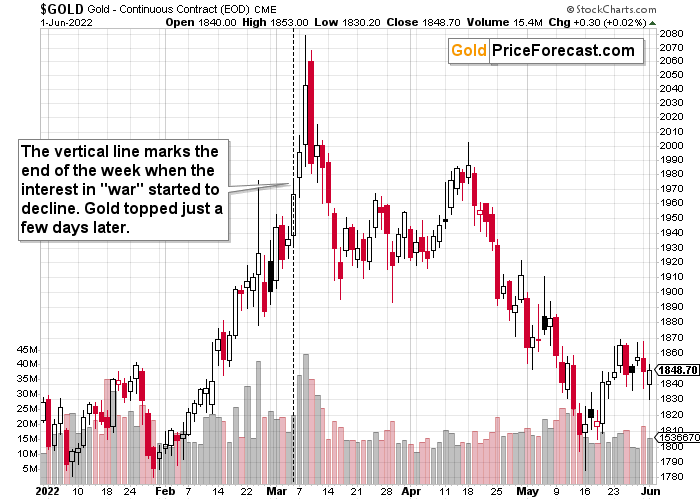
Just a brief gold price analysis reveals that it peaked but not exactly when the concerns did. Gold price continued to move higher after that lower-interest week for a few more days and then it topped.
That’s exactly what we saw last week.
And what’s likely to happen after an important top? A big decline in prices.
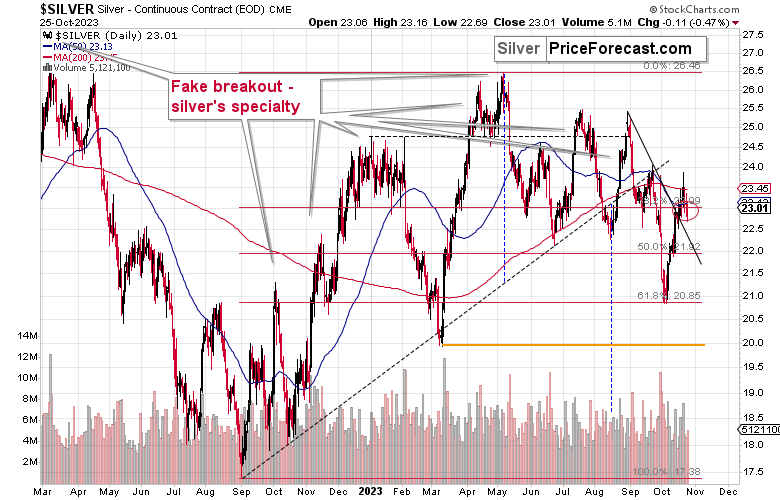
Silver price broke above its declining resistance line recently, but it wasn’t really a bullish factor because silver is known for its fake breakouts. Indeed, given the recent move lower, it seems that the rally in the white metal is over.
As the stock market slides and the demand for goods declines, the demand for silver (real and/or forecasted) would be likely to decline as well. This, in turn, means that silver prices are likely to decline. This is not just theory – silver tends to follow the stock market more than gold does. Remember how silver plunged in 2008 and 2020 when stock prices fell? The same is likely to happen in the following months.
This is true also for junior mining stocks (even more so), for different reasons.
The situation on the world stock markets is very bearish because it looks exactly like it did in 2008, with the only important exception being that this time the initial decline was actually bigger.
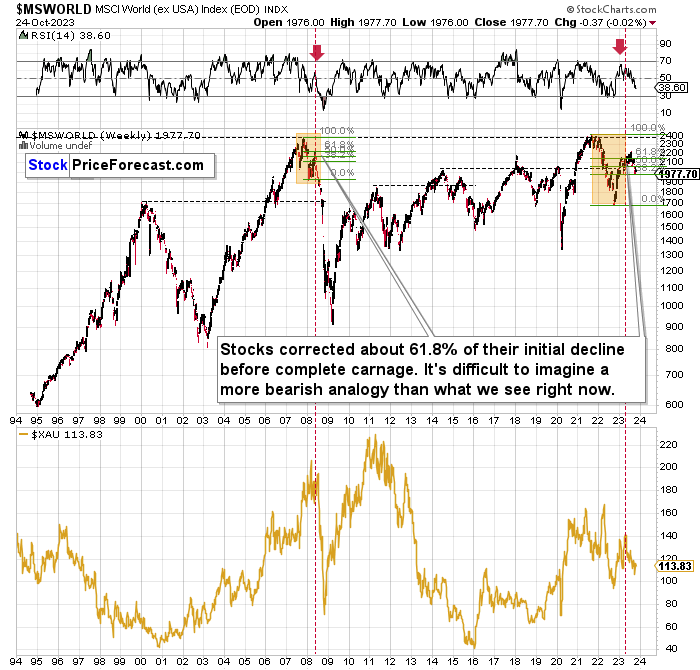
It seems that the big slide is about to start. Well, it’s already taking place in the Toronto Stock Exchange Venture Index, so other indices might indeed follow.
Why is this so important for us?
Because of what happened in 2008 to the prices of precious metals.
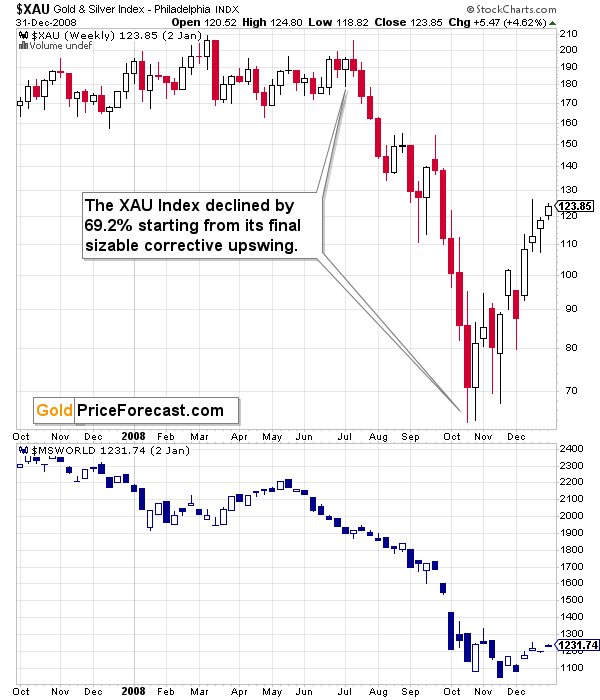
The above chart features the world stocks as well as the XAU index, a proxy for gold stocks and silver stocks.
And back in 2008 – during the period that’s analogous to the current situation – the XAU Index plunged from above 200 to below 70. Over two-thirds of its value was erased over the course of several months. Can it happen again? Yes. It might take a bit longer, though.
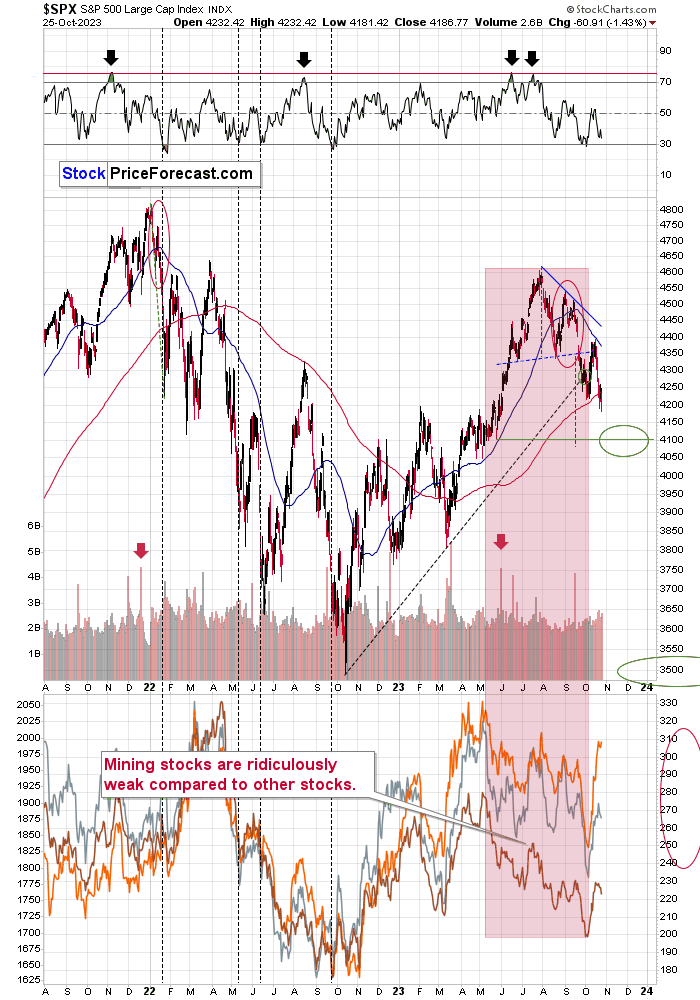
The U.S. stock market is declining, too – in tune with my previous expectations. A week ago, I commented on the above chart in the following way:
The latter is moving back and forth, and yesterday’s session took the S&P 500 Index 1.34% lower. This movement is around two rising support lines, which makes those moves particularly important.
If stocks break lower from this consolidation, the breakdowns will be confirmed, and the road to new lows will be open.
That’s quite likely to happen within the next days and if not then weeks.
If stocks decline but gold rallies, we might see some erratic performance in mining stocks – similar to what we saw on Wednesday. In this case, miners could rally on the intraday basis once again, and then decline before the closing bell.
The important thing is that all this is short-term smoke and mirrors. The medium-term trend remains extremely bearish, and even a brief look at world stocks confirms that.
That’s pretty much what happened. Stocks are likely to move to 4,100 or a bit below this level, and they might take a breather there – before sliding to new lows.
The implications for the precious metals market are very bearish – especially for junior mining stocks.
Before summarizing, here’s a quick update on copper and FCX, where some of you might also have profitable short positions.
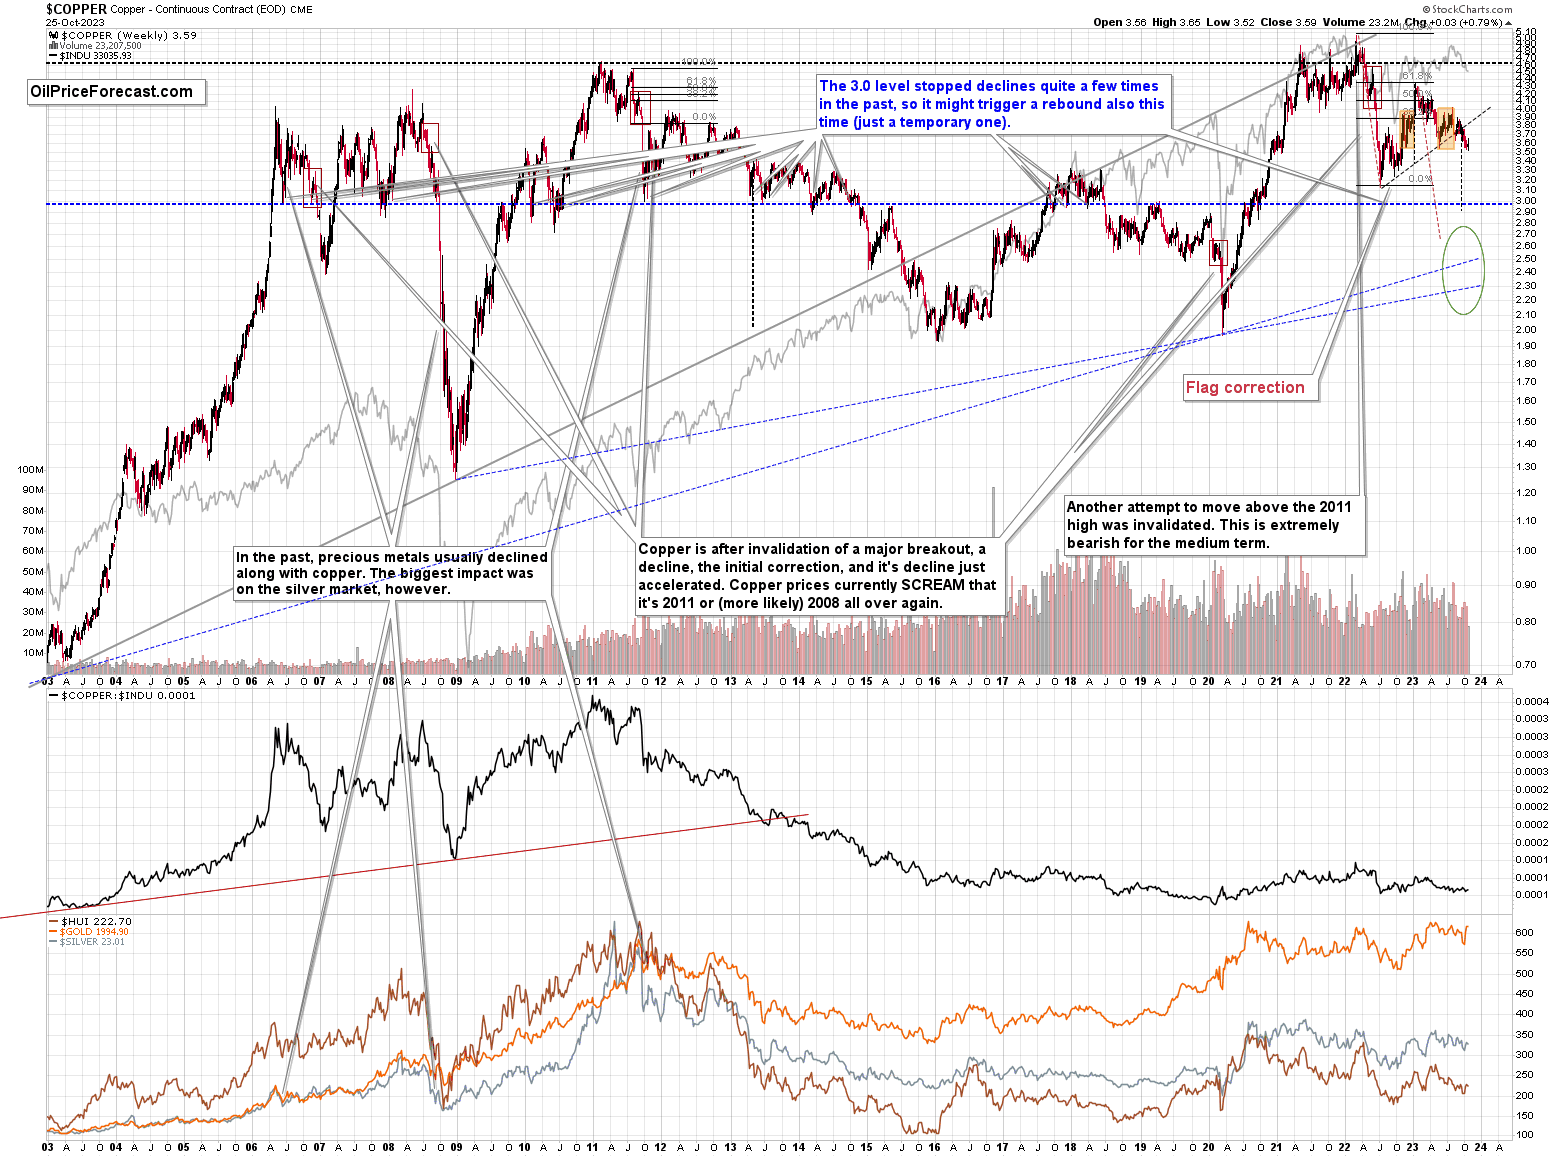
Copper is rather flat this week, but since it remains below its rising resistance line and since the breakdown below it was already confirmed, the outlook remains bearish.
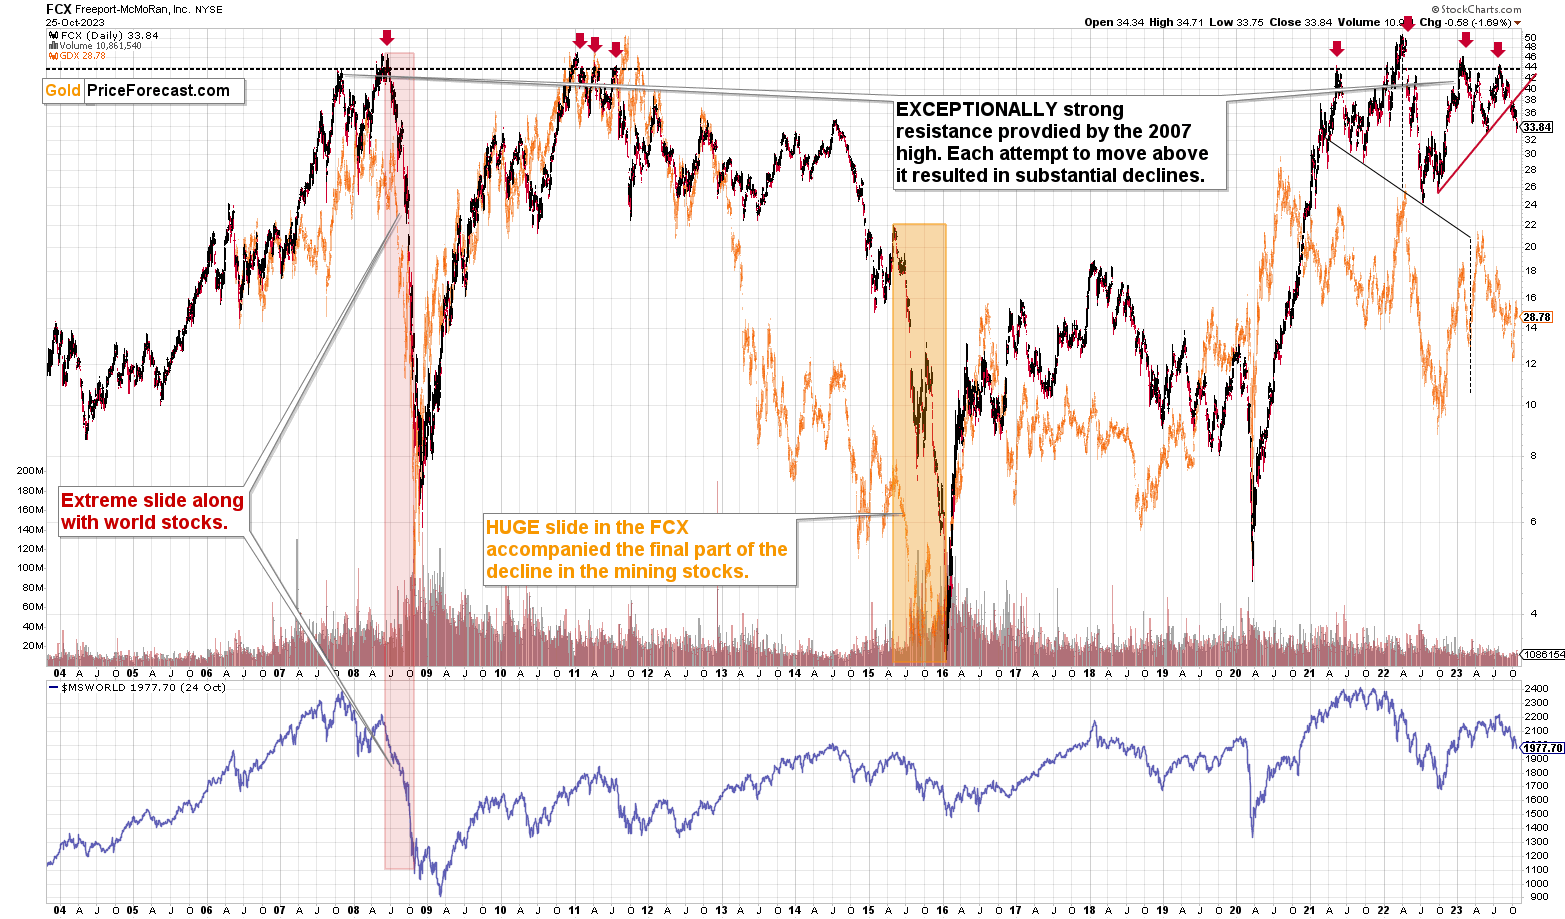
FCX moved lower this week, just like the general stock market did. And just like copper, it remains below the rising support line, which means that it’s likely to move even lower.
Please note that if we see a repeat of 2008 and a big decline in stocks (and a decrease in global industrial demand), then the value of copper stocks (including FCX) is likely to decrease significantly as well.
All in all, it seems that the profits on the short position that we entered in GDXJ on Friday above $35 are going to increase soon, and the same goes for the profits from the short position in the FCX.
As always, we’ll keep you – our subscribers – informed.
===
If you’d like to become a partner/investor in Golden Meadow, you’ll find more details in the above link.
Overview of the Upcoming Part of the Decline
- It seems that the recent – and probably final – corrective upswing in the precious metals sector is over.
- If we see a situation where miners slide in a meaningful and volatile way while silver doesn’t (it just declines moderately), I plan to – once again – switch from short positions in miners to short positions in silver. At this time, it’s too early to say at what price levels this could take place and if we get this kind of opportunity at all.
- I plan to switch from the short positions in junior mining stocks or silver (whichever I’ll have at that moment) to long positions in junior mining stocks when gold / mining stocks move to their 2020 lows (approximately). While I’m probably not going to write about it at this stage yet, this is when some investors might consider getting back in with their long-term investing capital (or perhaps 1/3 or 1/2 thereof).
- I plan to return to short positions in junior mining stocks after a rebound – and the rebound could take gold from about $1,450 to about $1,550, and it could take the GDXJ from about $20 to about $24. In other words, I’m currently planning to go long when GDXJ is close to $20 (which might take place when gold is close to $1,450), and I’m planning to exit this long position and re-enter the short position once we see a corrective rally to $24 in the GDXJ (which might take place when gold is close to $1,550).
- I plan to exit all remaining short positions once gold shows substantial strength relative to the USD Index while the latter is still rallying. This may be the case with gold prices close to $1,400 and GDXJ close to $15 . This moment (when gold performs very strongly against the rallying USD and miners are strong relative to gold after its substantial decline) is likely to be the best entry point for long-term investments, in my view. This can also happen with gold close to $1,400, but at the moment it’s too early to say with certainty.
- The above is based on the information available today, and it might change in the following days/weeks.
You will find my general overview of the outlook for gold on the chart below:
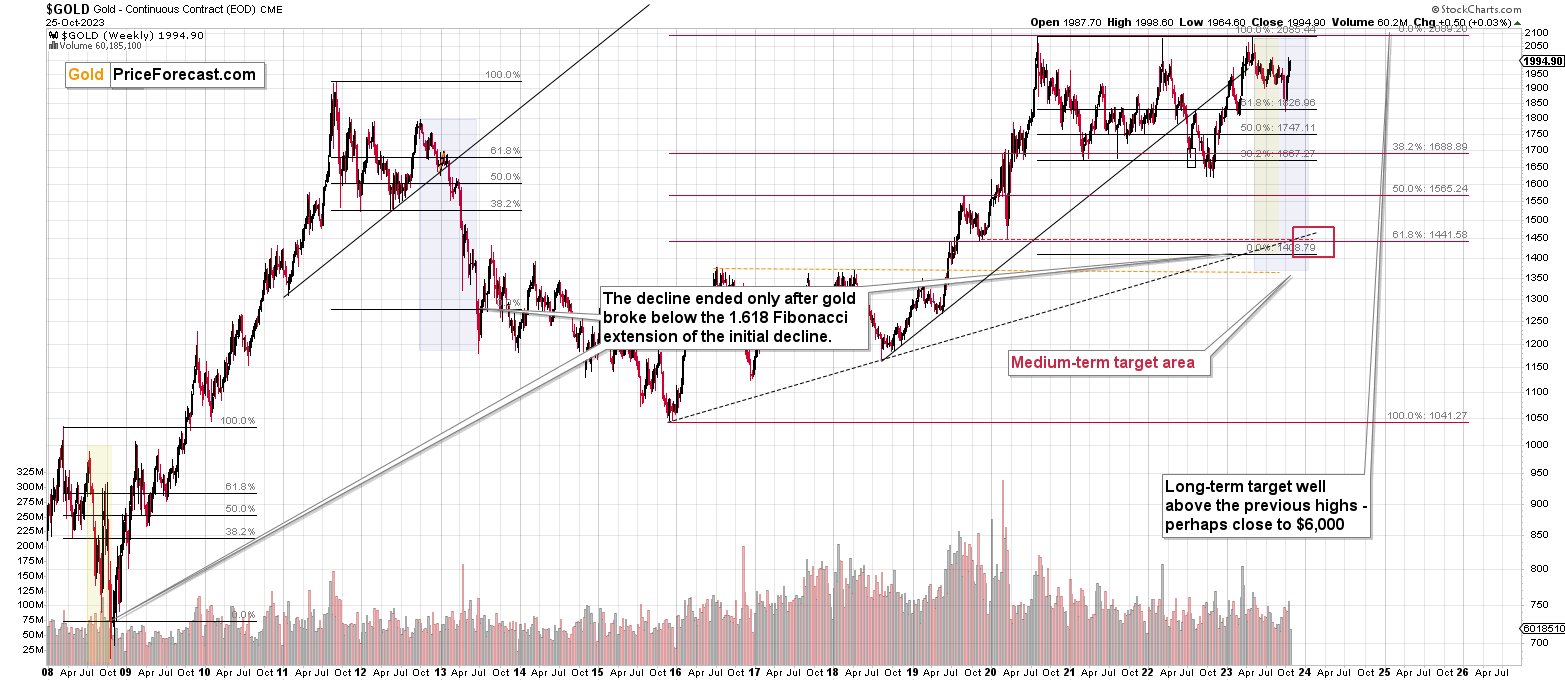
Please note that the above timing details are relatively broad and “for general overview only” – so that you know more or less what I think and how volatile I think the moves are likely to be – on an approximate basis. These time targets are not binding nor clear enough for me to think that they should be used for purchasing options, warrants, or similar instruments.
Letters to the Editor
Please post your questions in the comments feed below the articles if they are about issues raised within the article (or in the recent issues). If they are about other, more universal matters, I encourage you to use the Ask the Community space (I’m also part of the community) so that more people can contribute to the reply and enjoy the answers. Of course, let’s keep the target-related discussions in the premium space (where you’re reading this).
Summary
To summarize, the medium-term trend in the precious metals sector remains clearly down, and it seems that the corrective upswing is already over and the profits on our current short position are going to increase. We just caught the 11th profitable trade in a row – congratulations. The outlook for the short positions in junior miners and in the FCX remains very favorable.
===
Finally, since 11th profitable trade in a row is such a great piece of news (and the same goes for the fact that the current short position is already profitable), here’s… Even more great news! The possibility to extend your subscription for up to three years (at least by one year) with a 20% discount from the current prices is still open.
Locking in those is a great idea not only because it’s perfect time to be ready for what’s next in the precious metals market, but also because the inflation might persist longer than expected and prices of everything (including our subscriptions) are going to go up in the future as well. Please reach out to our support – they will be happy to assist you and make sure that your subscription days are properly extended at those promotional terms. So, for how many years would you like to lock-in your subscription?
To summarize:
Short-term outlook for the precious metals sector (our opinion on the next 1-6 weeks): Bearish
Medium-term outlook for the precious metals sector (our opinion for the period between 1.5 and 6 months): Bearish initially, then possibly Bullish
Long-term outlook for the precious metals sector (our opinion for the period between 6 and 24 months from now): Bullish
Very long-term outlook for the precious metals sector (our opinion for the period starting 2 years from now): Bullish
As a reminder, Gold Investment Updates are posted approximately once per week. We are usually posting them on Monday, but we can’t promise that it will be the case each week.
Our preferred ways to invest in and to trade gold along with the reasoning can be found in the how to buy gold section. Additionally, our preferred ETFs and ETNs can be found in our Gold & Silver ETF Ranking.
Moreover, Gold & Silver Trading Alerts are posted before or on each trading day (we usually post them before the opening bell, but we don’t promise doing that each day). If there’s anything urgent, we will send you an additional small alert before posting the main one.
Thank you.
Przemyslaw K. Radomski, CFA
Founder, Editor-in-chief

