

Briefly: gold and the rest of the precious metals market are likely to decline in the next several weeks/months and then start another powerful rally. Gold’s strong bullish reversal/rally despite the USD Index’s continuous strength will likely be the signal confirming that the bottom is in.
Introduction
The PMs continued their descents on Aug. 15, as higher interest rates and a stock market sell-off helped depress the outlook for risk assets. Gold declined by 0.46%, silver by 0.23%, the GDX ETF by 2.56%, and the GDXJ ETF by 2.46%. With this kind of decline, we had good reasons to be shorting mining stocks, not the metals.
As a result, the technicals (e.g., the breakdown below the head-and-shoulders pattern in the GDXJ!) and fundamentals continue to unfold as expected, we believe the PMs will suffer more downside before a tactical buying opportunity arises.
No Fun for the Gold Bugs
Despite calls for gold to hit $2,500 or even $3,000, we warned that the precious metals bear markets would continue until inflation, interest rates, and the U.S. dollar become tailwinds rather than headwinds. And with that fundamental environment still a ways off, it’s no surprise the PMs have suffered, especially silver and mining stocks.
For example, the GDXJ ETF ended the Aug. 15 session at its lowest level since March, and the fall continues to increase the profits from our short position. Similarly, with the iShares 20+ Year Treasury Bond (TLT) ETF closing at a new 2023 low, the movement of interest rates continues to align with our thesis.
Please see below:
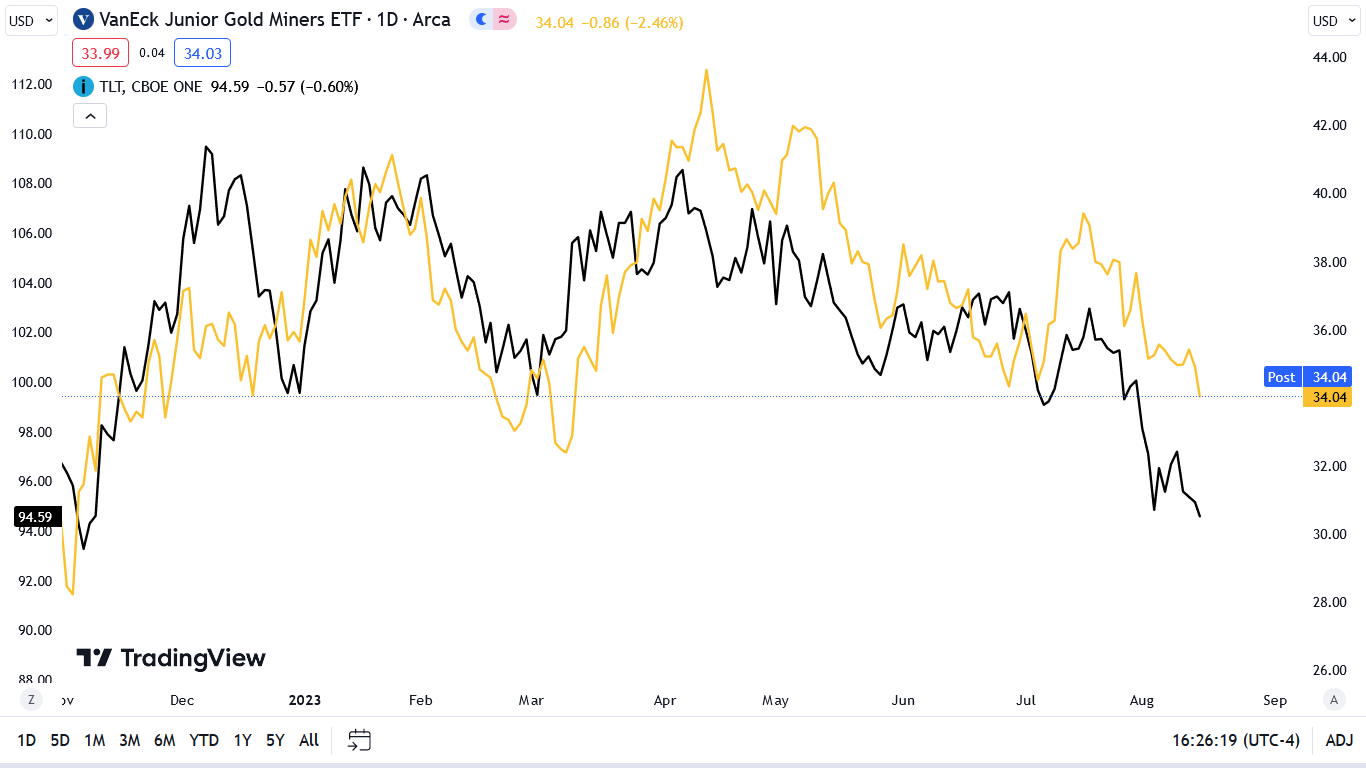
To explain, the gold line above tracks the GDXJ ETF, while the black line above tracks the TLT ETF. As you can see, lower TLT prices (higher long-term interest rates) have helped stifle the junior miners, and we expect further downside for the latter before an opportunity to flip long arises.
For context, we warned months ago that the bond bulls were overplaying their hand and that mining stocks and silver would suffer alongside a reversal. We wrote on Apr. 6:
While sentiment often rules the short term, the medium-term technicals and fundamentals have demonstrated their might time and time again. Consequently, while the USD Index has suffered and the PMs have benefitted, the developments have only loosened financial conditions and made inflation more problematic.
To win the war, long-term interest rates need to rise to suppress borrowing and consumption, and a realization supports higher real yields and a stronger USD Index. So, while the crowd believes QE is only a few months away, another disappointment should confront the pivot bulls in the months ahead.
Hawkish Fuel
U.S. retail sales came in hot on Aug. 15, and once again, supports the notion that higher interest rates are needed to normalize the U.S. economy. As a result, the Fed should remain hawkish, which is bullish for the USD Index.
Please see below:
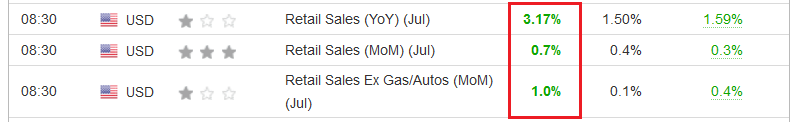
To explain, retail sales’ outperformance highlights how consumption remains resilient, and these figures do not support rate cuts or QE anytime soon. In fact, retail sales are well above trend and indicate that the Fed needs to do more to return the U.S. economy to its pre-pandemic state.
Please see below:
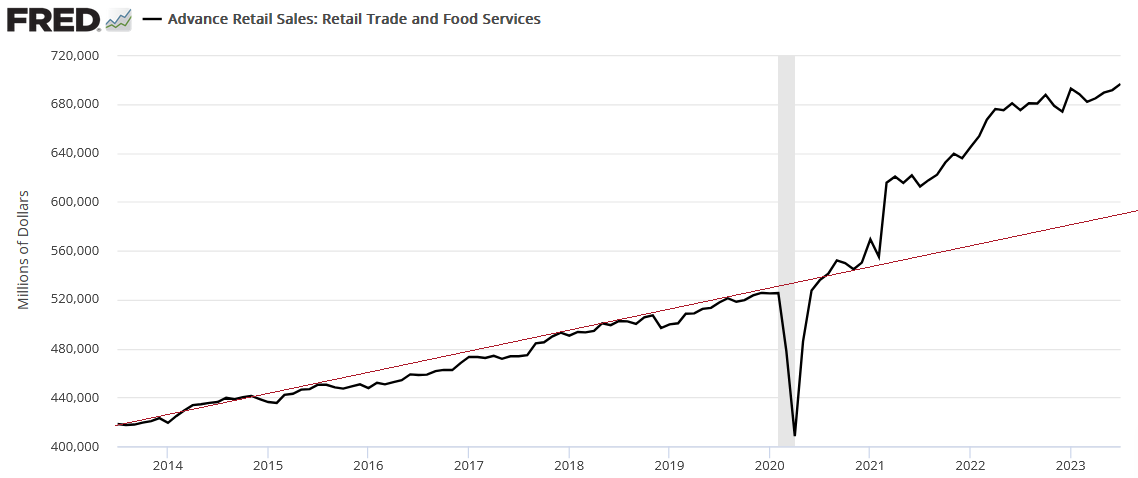
To explain, the black line above tracks U.S. retail sales, while the red line above approximates the 10-year trend. As you can see, the metric hit a new all-time high on Aug. 15 and has not slowed in a manner that supports 2% inflation. Thus, consumers remain in relatively strong shape, and we cautioned that this would occur. We wrote on Jun. 16:
We warned on Mar. 31, 2022, that consumer spending would cause problems for the central bank. We wrote:
U.S. households have nearly $3.89 trillion in their checking accounts. For context, this is 288% more than Q4 2019 (pre-COVID-19). As a result, investors misunderstand the amount of demand that’s driving inflation.
To that point, the Fed updated the metric again on Jun. 8. And with household checkable deposits still highly elevated, Americans have more money now than they did then.
Please see below:

To explain, the figure is north of $4 trillion as of Q1 2023, and only a mild drawdown from the all-time high has been realized. Consequently, there is still too much cash out there to suppress demand enough to normalize inflation.
So, with our thesis unfolding as expected, little has changed. The Fed has yet to create the demand destruction necessary to eradicate inflation, and the rise in oil prices only worsens the situation. Yes, the recent rise in long-term interest rates should have a major economic impact in the months ahead. But, when the fundamental data weakens, it should create stock market anxiety, which is bullish for the USD Index.
Finally, with the gold bugs in denial about the U.S.’ economic resiliency, their ‘fed is trapped’ thesis has not performed well over the last few years. And with gold still extremely overvalued relative to real interest rates and the USD Index, the medium-term risk-reward is not skewed in the bulls’ favor.
Please see below:
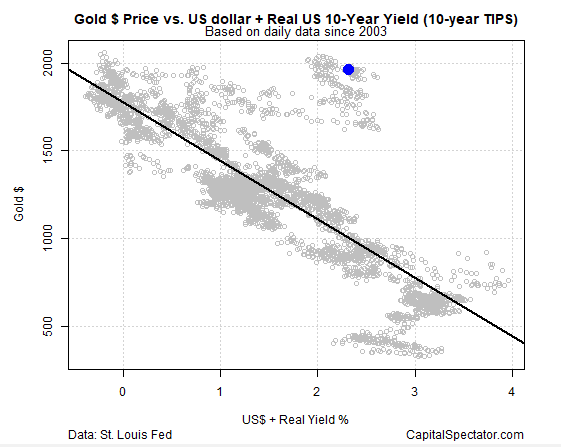
To explain, the gray dots above represent historical gold prices (since 2003) when the USD Index and the U.S. 10-Year real yield were at different levels. In a nutshell: the downward-sloping black line (linear trend) shows how a stronger USD Index and a higher U.S. 10-Year real yield are associated with a lower gold price.
Conversely, the blue dot near the top highlights where gold is now. A reading near $2,000 is materially overvalued, considering $1,000 is more common, given the strength of the dollar and real interest rates.
For context, this chart was created on Jul. 25; and while gold is lower now, the USD Index and the U.S. 10-Year real yield have increased, likely only worsening the relationship. So, while we don’t expect gold to fall to $1,000, the point is that even $1,500 is rich in this environment.
Overall, the S&P 500 sold off on Aug. 15, as overvalued stocks confront their own issues when interest rates rise. However, the weakness is bearish for the GDXJ ETF, and we expect our short position to generate even more profits in the near term. The same for the upcoming long position.
Silver’s Crash Continues
It was another red candle for silver on Aug. 15, as the white metal declined materially in August. Moreover, with gold suffering a similar descent and the GDXJ ETF closing at a more than four-month low, our short position continues to print profits.
Furthermore, with the economic data still hot, the fundamental pressures plaguing silver this month should continue over the medium term. For example, the Atlanta Fed increased its Q3 GDPNow forecast to 5% on Aug. 15, increasing investors’ hawkish anxiety.
Please see below:
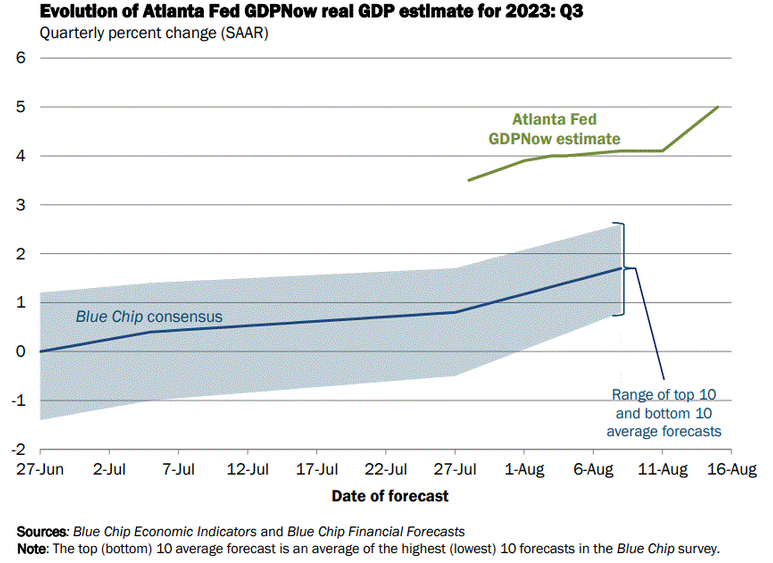
To explain, the green line above tracks the Atlanta Fed’s estimate, while the blue line above tracks the Blue Chip (investment banks) consensus estimate. If you analyze the performance of the former, you can see that it rose from 4.1% on Aug. 8. As such, it’s another indicator that does not support rate cuts or QE in the near future.
Similarly, the Atlanta Fed updated its Wage Growth Tracker on Aug. 9. And with the metric increasing from 5.6% in June to 5.7% in July, resilient wage inflation should keep the Fed hawkish and suppress the silver price in the months ahead.
Please see below:
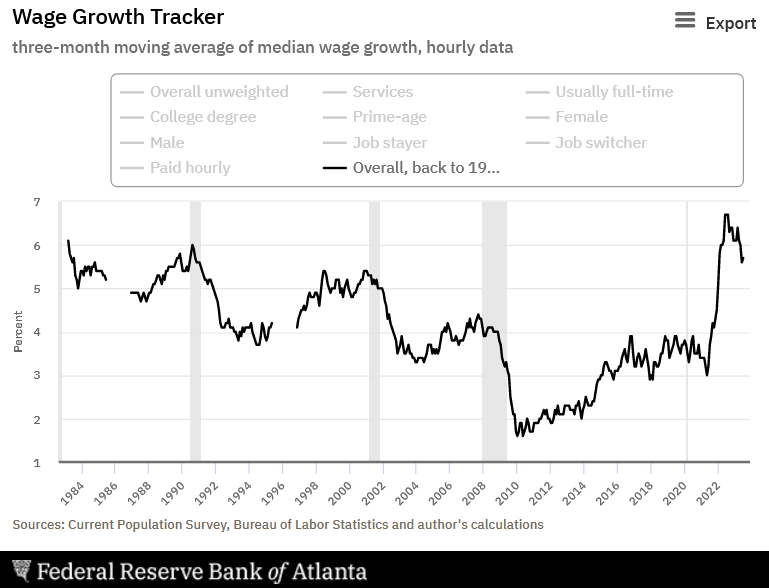
To explain, wage inflation has come down from its 2022 high, but the rise in July highlights how it remains sticky. In other words, returning it to its pre-pandemic state requires more demand destruction; and that means higher-for-longer interest rates, or a recession, both of which are bad for the PMs.
Struggling Stocks
While the S&P 500 suffered a daily sell-off, the index remains overvalued, and the damage was largely immaterial given the 2023 rally. However, with positioning somewhat stretched, a recalibration could sink stocks and put downward pressure on silver and the GDXJ ETF.
Please see below:
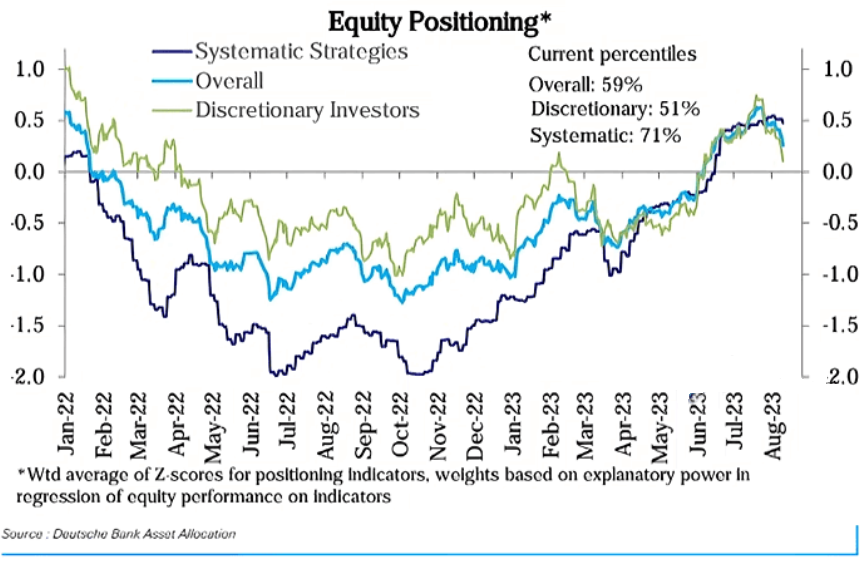
To explain, the dark blue and green lines above track the equity exposure of systematic (quants) and discretionary (typically fundamental) fund managers. Analyzing the large drop in 2022 shows that consolidated exposure (the light blue line) declined dramatically as fund managers were underweight stocks.
Yet, the sharp rise on the right side of the chart shows how consolidated exposure went from roughly 1 standard deviation below the average to 0.5 standard deviations above the average. More importantly, systematic funds were in the 71st percentile, and they often buy and sell based on realized volatility. Essentially, they increase/decrease their exposure based on the VIX.
And with an abnormally low VIX poised to rise alongside higher inflation and interest rates, a stock market sell-off could be another catalyst that helps push the PMs lower.
As further evidence, the chart below highlights CTAs’ (systematics/quants) equity exposure from a long-term perspective.
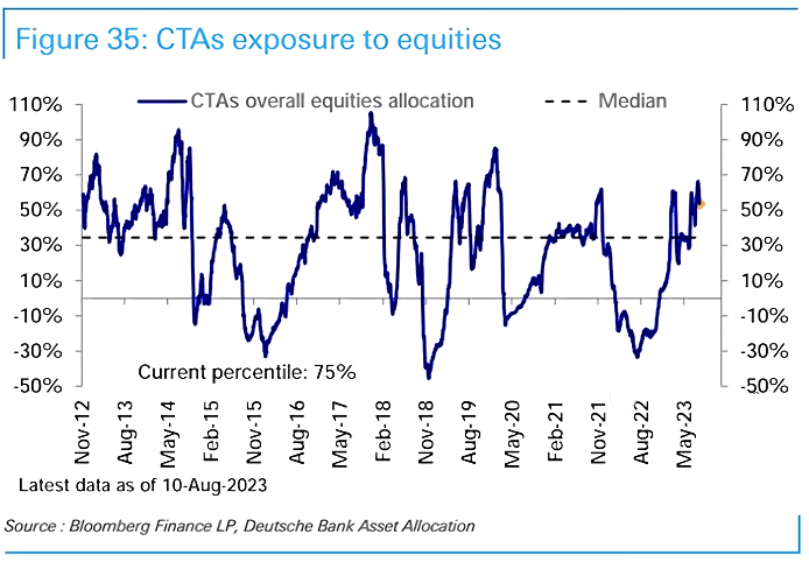
To explain, the blue line on the right side of the chart shows how CTAs equity exposure remains above their decade-plus median. In fact, it recently peaked at the highest level since before the pandemic. As a result, a fall to the median would result in more S&P 500 selling, while negative levels could coincide with a major correction.
Overall, the combination of higher interest rates and higher oil prices is bearish for consumption because both reduce Americans’ disposable income. And with those scars poised to show in the months ahead, stock market weakness could help the USD Index and hurt silver and mining stocks. Consequently, we expect our GDXJ ETF short position to produce more profits before we flip long.
The Bottom Line
Hawkish realities continue to plague risk assets, and we warned for many months that economic destruction would not occur on its own. In reality, you need higher long-term interest rates to suffocate the real economy, and only that reduces consumption and eliminates inflation.
So, with those forces now in play, economic outperformance should turn to underperformance over the medium term. And while this may help reduce nominal interest rates, higher volatility, stock market weakness, higher real yields (lower inflation expectations), and a safe-haven bid for the USD Index should weigh heavily on the PMs.
In conclusion, the PMs declined on Aug. 15, as interest rates again dominated the headlines. And with inflationary history showing that long-term interest rates rise and rise until something bad happens, we still think this cycle ends with a recession.
Overview of the Upcoming Part of the Decline
- It seems that the recent – and probably final – corrective upswing in the precious metals sector is over.
- If we see a situation where miners slide in a meaningful and volatile way while silver doesn’t (it just declines moderately), I plan to – once again – switch from short positions in miners to short positions in silver. At this time, it’s too early to say at what price levels this could take place and if we get this kind of opportunity at all.
- I plan to switch from the short positions in junior mining stocks or silver (whichever I’ll have at that moment) to long positions in junior mining stocks when gold / mining stocks move to their 2020 lows (approximately). While I’m probably not going to write about it at this stage yet, this is when some investors might consider getting back in with their long-term investing capital (or perhaps 1/3 or 1/2 thereof).
- I plan to return to short positions in junior mining stocks after a rebound – and the rebound could take gold from about $1,450 to about $1,550, and it could take the GDXJ from about $20 to about $24. In other words, I’m currently planning to go long when GDXJ is close to $20 (which might take place when gold is close to $1,450), and I’m planning to exit this long position and re-enter the short position once we see a corrective rally to $24 in the GDXJ (which might take place when gold is close to $1,550).
- I plan to exit all remaining short positions once gold shows substantial strength relative to the USD Index while the latter is still rallying. This may be the case with gold prices close to $1,400 and GDXJ close to $15 . This moment (when gold performs very strongly against the rallying USD and miners are strong relative to gold after its substantial decline) is likely to be the best entry point for long-term investments, in my view. This can also happen with gold close to $1,400, but at the moment it’s too early to say with certainty.
- The above is based on the information available today, and it might change in the following days/weeks.
You will find my general overview of the outlook for gold on the chart below:
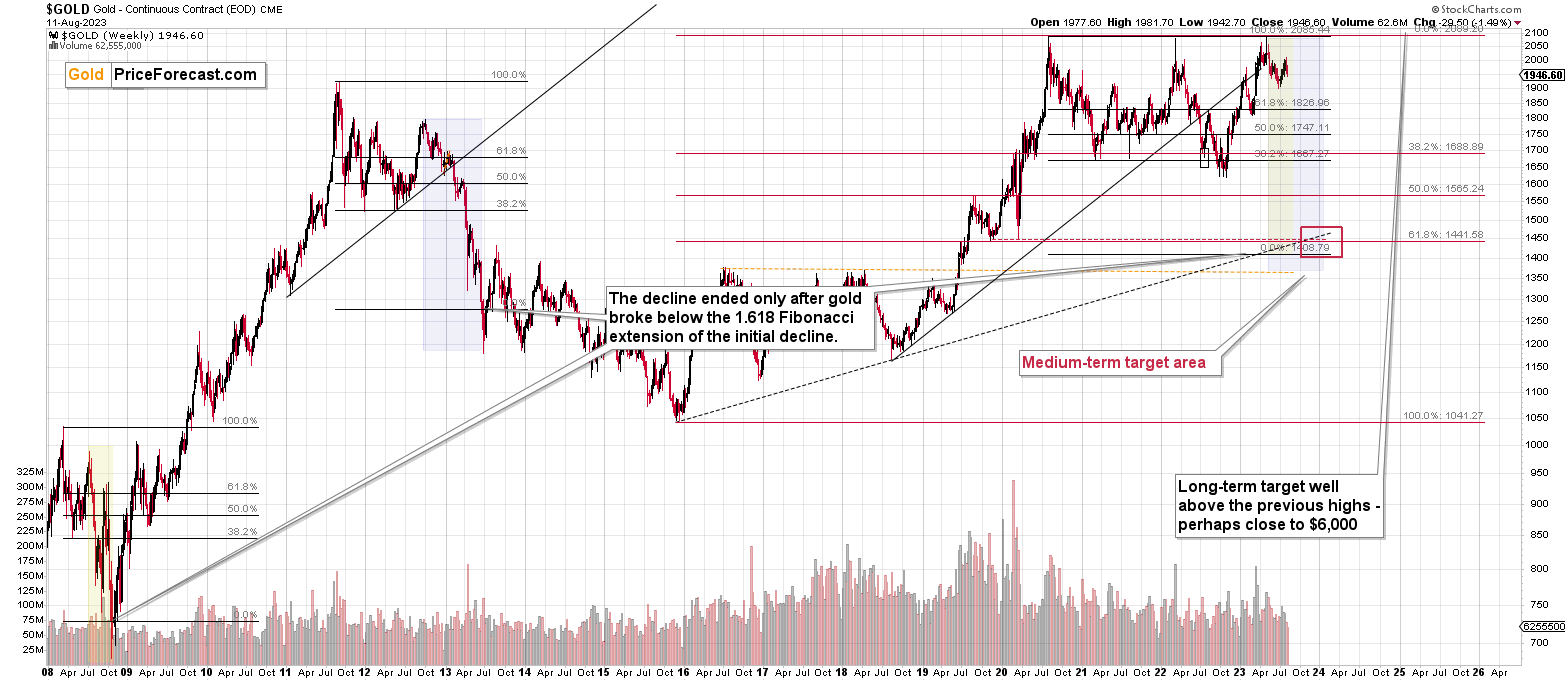
Please note that the above timing details are relatively broad and “for general overview only” – so that you know more or less what I think and how volatile I think the moves are likely to be – on an approximate basis. These time targets are not binding nor clear enough for me to think that they should be used for purchasing options, warrants, or similar instruments.
Letters to the Editor
Please post your questions in the comments feed below the articles if they are about issues raised within the article (or in recent issues). If they are about other, more universal matters, I encourage you to use the Ask the Community space (I’m also part of the community) so that more people can contribute to the reply and enjoy the answers. Of course, let’s keep the target-related discussions in the premium space (where you’re reading this).
Summary
To summarize, the medium-term outlook for the precious metals sector (and for the FCX) remains to be extremely bearish and the profit potential for short positions in junior miners and FCX remains enormous.
While I can’t promise any kind of return (nobody can), in my opinion, the recent profitable position in the FCX will soon be joined by even more profits, and the winning streak of trades that started in early 2022, will continue.
If I didn’t have a short position in junior mining stocks, I would be entering it now.
As always, we'll keep you – our subscribers – informed.
To summarize:
Short-term outlook for the precious metals sector (our opinion on the next 1-6 weeks): Bearish
Medium-term outlook for the precious metals sector (our opinion for the period between 1.5 and 6 months): Bearish initially, then possibly Bullish
Long-term outlook for the precious metals sector (our opinion for the period between 6 and 24 months from now): Bullish
Very long-term outlook for the precious metals sector (our opinion for the period starting 2 years from now): Bullish
As a reminder, Gold Investment Updates are posted approximately once per week. We are usually posting them on Monday, but we can’t promise that it will be the case each week.
Our preferred ways to invest in and to trade gold along with the reasoning can be found in the how to buy gold section. Additionally, our preferred ETFs and ETNs can be found in our Gold & Silver ETF Ranking.
Moreover, Gold & Silver Trading Alerts are posted before or on each trading day (we usually post them before the opening bell, but we don’t promise doing that each day). If there’s anything urgent, we will send you an additional small alert before posting the main one.
Thank you.
Przemyslaw K. Radomski, CFA
Founder, Editor-in-chief

