

Briefly: gold and the rest of the precious metals market are likely to decline in the next several weeks/months and then start another powerful rally. Gold’s strong bullish reversal/rally despite the USD Index’s continuous strength will likely be the signal confirming that the bottom is in.
Welcome to this week's Gold Investment Update.
Predicated on last week’s price moves, our most recently featured medium-term outlook remains the same as the price moves align with our expectations. On that account, there are parts of the previous analysis that didn’t change at all in the earlier days and are written in italics.
This week was all about bad data, as the bond bulls enjoyed a reprieve from the recent sell-off. Yet, the GDXJ ETF struggled to gain any material traction (except for today’s early-hour trading, but we’ll get to that later), even as gold remains in investors’ good graces. Thus, while the day to day is always volatile, our investment thesis continues to unfold as expected, and the GDXJ ETF should break below its October lows before a short-term buying opportunity potentially arises.
We’ll begin today’s alert by dissecting the fundamentals, and then dive into the technical aspects that have proven so prescient over the last several months.
Gold Stands Tall Despite Its Shortcomings
Gold has basked in the glory, as geopolitical conflict increases its appeal. However, silver and mining stocks have not been as fortunate, and the latter’s underperformance continues to support our short position. Moreover, with the domestic fundamental outlook continuing to deteriorate, mining stocks should remain under pressure, and gold should follow them lower over the medium term.
For example, we’ve warned on numerous occasions that this cycle should end with a recession. And with lousy economic data poised to sink sentiment, several assets should suffer in the months ahead.
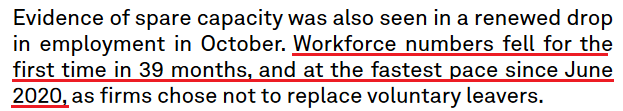
S&P Global released its U.S. Manufacturing PMI on Nov. 1, and while the headline index “stabilized during October, thereby ending a five-month sequence of decline,” job losses occurred for the first time since July 2020.
Please see below:
Likewise, while we warned that inflation was old news, the report added:
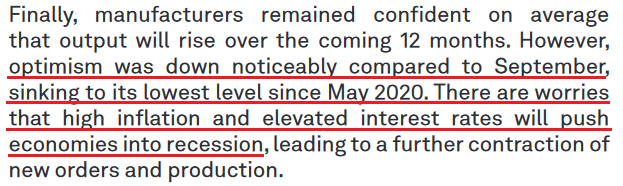
“Efforts to remain competitive and drive sales reportedly constrained pricing power. Although output charges rose at the quickest pace in six months, the rate of increase was much slower than the peaks seen in the last two years.”
As further evidence, the ISM also released its Manufacturing PMI on Nov. 1. And with the results bearish for economically-sensitive metals like silver, an excerpt read:
“ISM’s Employment Index registered 46.8 percent in October, 4.4 percentage points lower than the September reading of 51.2 percent…. Attrition, freezes and layoffs to reduce head counts increased during the period, with layoffs the primary tool, indicating a more urgent need to reduce staffing.”
Timothy R. Fiore, Chair of the ISM’s Manufacturing Business Survey Committee, added:
“The past relationship between the Manufacturing PMI and the overall economy indicates that the October reading (46.7 percent) corresponds to a change of minus-0.7 percent in real gross domestic product (GDP) on an annualized basis.”
So, while the crowd will celebrate the economic deceleration initially due to the prospect of a more dovish Fed, the medium-term ramifications are material. History shows that inflation rarely subsides without a recession, and soft-landing hopes always emerge as the economy slows down.
However, while the consensus believes growth will settle back to a normalized range, the reality is that too-hot economies (2021/2022) often turn too cold when long-term interest rates rise. And with another iteration poised to unfold in 2024, pivot optimism should turn to pessimism, which is bullish for the USD Index.
Don’t Look Down
While we’ve been rightfully bearish on the Eurozone economy and the EUR/USD, the latter’s plight has been a boon for the USD Index. And with the U.S. continuing to outperform Europe, the Oct. 31 data further supports our thesis.
Please see below:

To explain, Eurozone GDP growth underperformed expectations and went negative on a quarter-over-quarter (QoQ) basis. As such, crude oil remains in the crosshairs, and a continuation of the trend is also bad news for silver. Moreover, while the crowd may think the U.S. is invincible, the weakness should eventually spread to America.
To that point, the U.S.’ neighbor to the north also has a sputtering economic backdrop.
Please see below:

To explain, Canadian GDP growth also underperformed expectations on Oct. 31, with flat activity present in the region. Similarly, S&P Global released its Canada Manufacturing PMI on Nov. 1. Paul Smith, Economics Director at S&P Global Market Intelligence, said
“It was another disappointing month for the Canadian manufacturing sector, with output and new orders continuing to fall amid reports of underwhelming market demand. Sales to both domestic and international customers were again lower, and firms remain engaged in a cycle of destocking, seeking to cut any excess inventory that built up during the pandemic.”
Thus, while the mood music on Wall Street may seem sanguine, the troublesome macro outlook should bite in the months ahead.
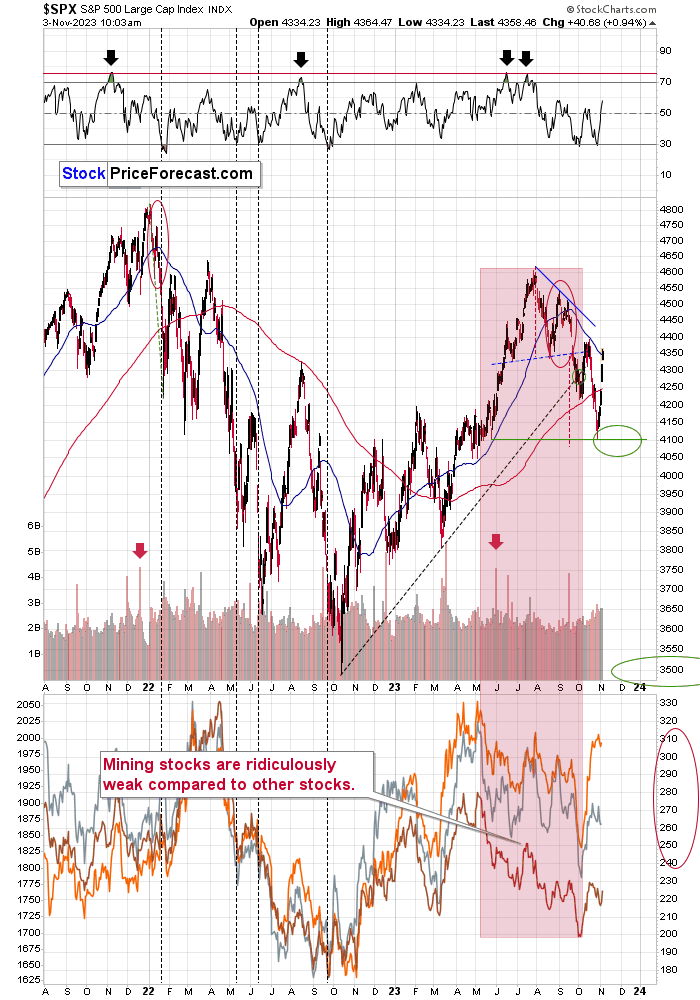
Overall, the S&P 500 rallied on Nov. 2, as bad news is good news right now (dovish pivot). But, when bad news becomes bad news, risk assets should suffer as volatility spikes and Treasury bonds and the U.S. dollar become the primary safe-havens. In contrast, silver and mining stocks should experience the largest drawdowns.
Sad Silver Lags Gold
While silver has bounced off its recent lows, the white metal continues to underperform gold. And when volatile areas of the precious metals market showcase weakness (silver and mining stocks) it’s often an ominous sign for the entire sector.
In addition, with recession winds likely to push silver off a cliff, lower interest rates are unlikely to help when the dust settles. For example, The Conference Board released its Consumer Confidence Index on Oct. 31. Dana Peterson, Chief Economist at The Conference Board, said:
“Consumer confidence fell again in October 2023, marking three consecutive months of decline. October’s retreat reflected pullbacks in both the Present Situation and Expectations Index. Write-in responses showed that consumers continued to be preoccupied with rising prices in general, and for grocery and gasoline prices in particular. Consumers also expressed concerns about the political situation and higher interest rates.”
Please see below:
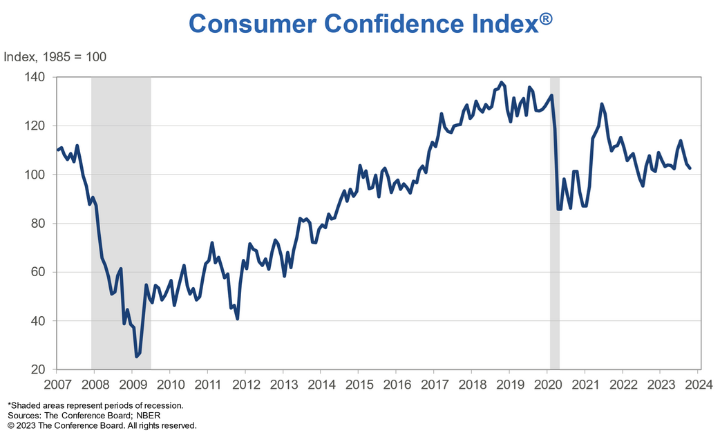
To explain, the blue line’s pullback on the right side of the chart highlights how consumers are increasingly pessimistic about the economic outlook. And while we warned that higher long-term interest rates were much different than a higher FFR, it’s no coincidence the recent slide occurred alongside the rapid rise in Treasury yields.
In reality, higher long-term rates make consumers’ financing vehicles more expensive, and big-ticket items become unaffordable the longer the gambit persists. As a result, while gold remains the belle of the ball for now, it should mirror silver and mining stocks’ poor performances in the months ahead.
U.S. Growth Concerns
While we remain confident the Eurozone and Canada’s economic woes will eventually spread to the U.S., some scars emerged on Nov. 1. The Atlanta Fed cut its Q4 real GDP growth estimate from 2.3% to 1.2%, as recent data signals a much weaker outlook going forward.
Please see below:
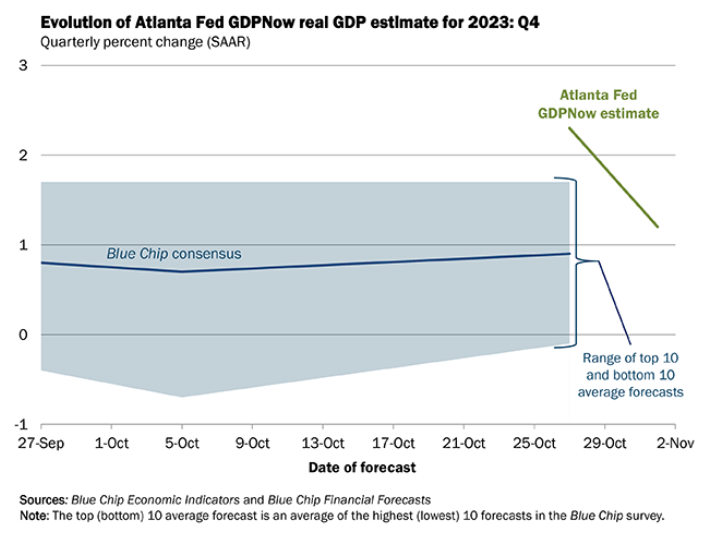
To explain, the green line above tracks the Atlanta Fed’s Q4 real GDP growth estimate, while the blue line above tracks the Blue Chip (investment banks) consensus estimate. If you analyze the trajectory of the former, you can see a meaningful drop. And again, we’re not surprised the weakness occurred alongside higher long-term interest rates. Consequently, more pain should emerge as the Fed attempts to normalize the U.S. economy.
On top of that, continued jobless claims have risen for the last six weeks. For context, the metric tallies the number of Americans who file for unemployment more than once. The more this persists, the more trouble it spells for oil and the PMs.
Please see below:
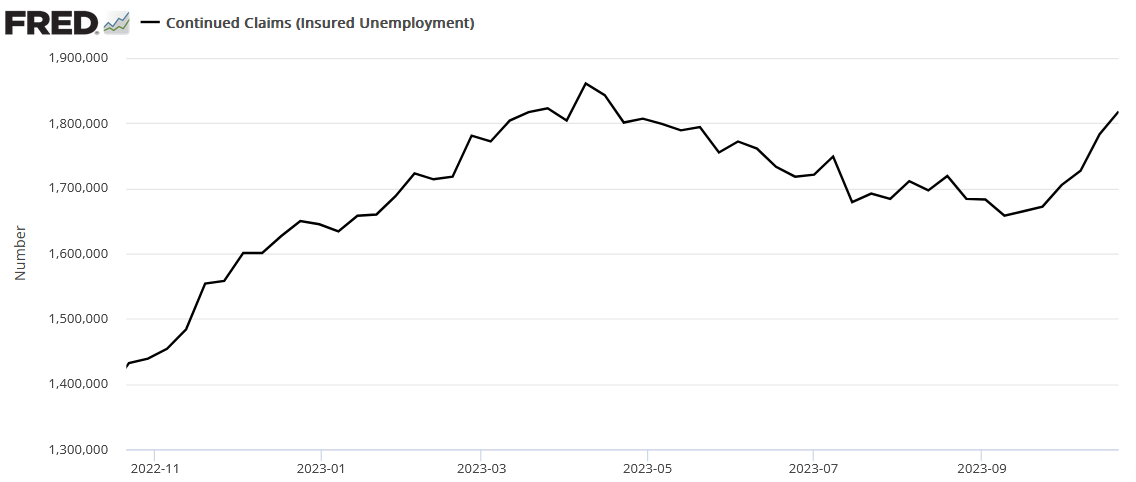
To explain, while the metric had been in a downtrend since peaking in April 2023, the sharp spike on the right side of the chart has also occurred alongside higher long-term interest rates. Therefore, several metrics highlight the forming economic wounds, and the bearish trend should hurt consumer spending and the S&P 500.
Finally, the Dallas Fed released its Texas Manufacturing Outlook Survey on Oct. 30. The report stated:
“Labor market measures suggest slower employment growth and shorter workweeks in October. The employment index declined seven points to 6.7, a reading just below the series average of 7.9. Nineteen percent of firms noted net hiring, while 13 percent noted net layoffs. The hours worked index slipped back into negative territory, coming in at -2.3.”
So, while the crowd will celebrate the news as a soft landing in process, we see it more as a boom-and-bust cycle. During the pandemic, lawmakers overstimulated, and the U.S. economy roared much louder than expected.
But now, with higher long-term interest rates and quantitative tightening (QT) taking effect, the U.S. economy should cool much more than the consensus expects. As a result, several assets, including the PMs, should experience profound drawdowns before the next bull market arrives.
Overall, our fundamental thesis continues to unfold as expected. Inflation, a hawkish Fed, and higher interest rates helped boost the USD Index in 2021/2022. Next, a recession and heightened volatility should be the fundamental catalyst that pushes the dollar basket substantially higher in 2024. And if that occurs, the PMs are unlikely to sidestep the carnage.
The Bottom Line
Despite the material decline in interest rates over the last two days, the GDXJ ETF has done very little. The relative weakness is profoundly bearish, as bond rallies were typically celebrated by the junior miners. Moreover, not only does the asset lack technical and fundamental strength, but sentiment is also lacking. Thus, we still expect more downside before an interim buying opportunity emerges.
In conclusion, the PMs rallied on Nov. 2, as interest rates and the USD Index retreated. But, the upswings were rather dull, and little has changed to alter our medium-term outlook.
Technically Speaking
Gold continues to struggle with $2,000, and the GDXJ ETF barely rallied (except for today’s early-session rally) despite major S&P 500 and bond upswings, and silver sold off at its 50-day moving average. Add it all together, and the precious metals sector remains weak, which is in tune with my technical predictions.
Moreover, with little changing on Nov. 2, my comments from yesterday remain up to date, and highlight why we should expect lower prices in the weeks ahead.
Gold didn’t just invalidate the move above $2,000. It moved even lower – that’s how we know the invalidation is real. And so are its consequences.
After gold’s suspicious rally, we see a very real decline. And the decline in silver and mining stocks is even bigger. Still, let’s start today’s analysis with the yellow precious metal.
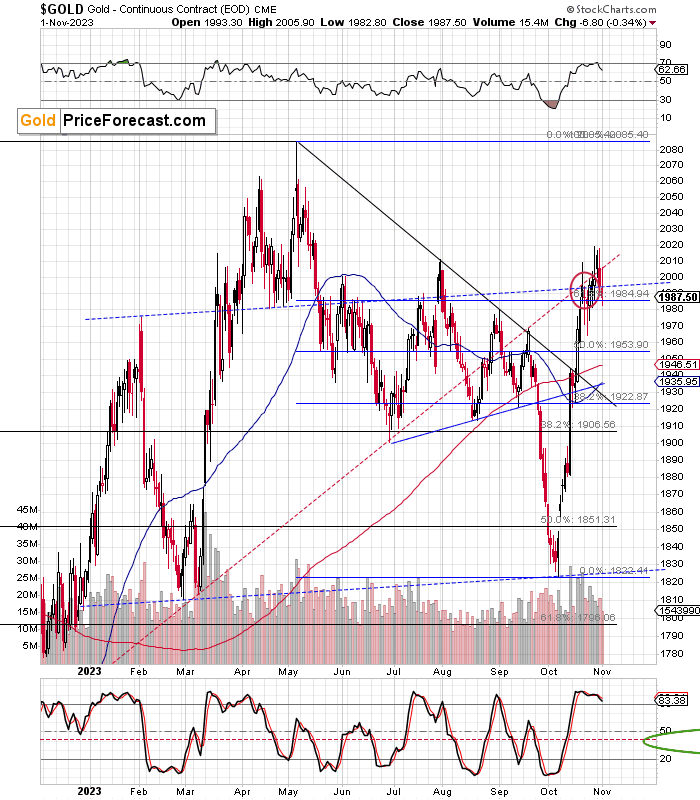
[The Nov. 1] move lower by $6.80 might not seem significant but given the fact that the gold price tried to move above $2,000, this is really important. It’s simply not happening even though the situation in the Middle East is escalating.
Gold was likely to top with RSI close to 70 and about 1-2 weeks after the peak interest in “war” in Google News. That’s exactly where we are right now.
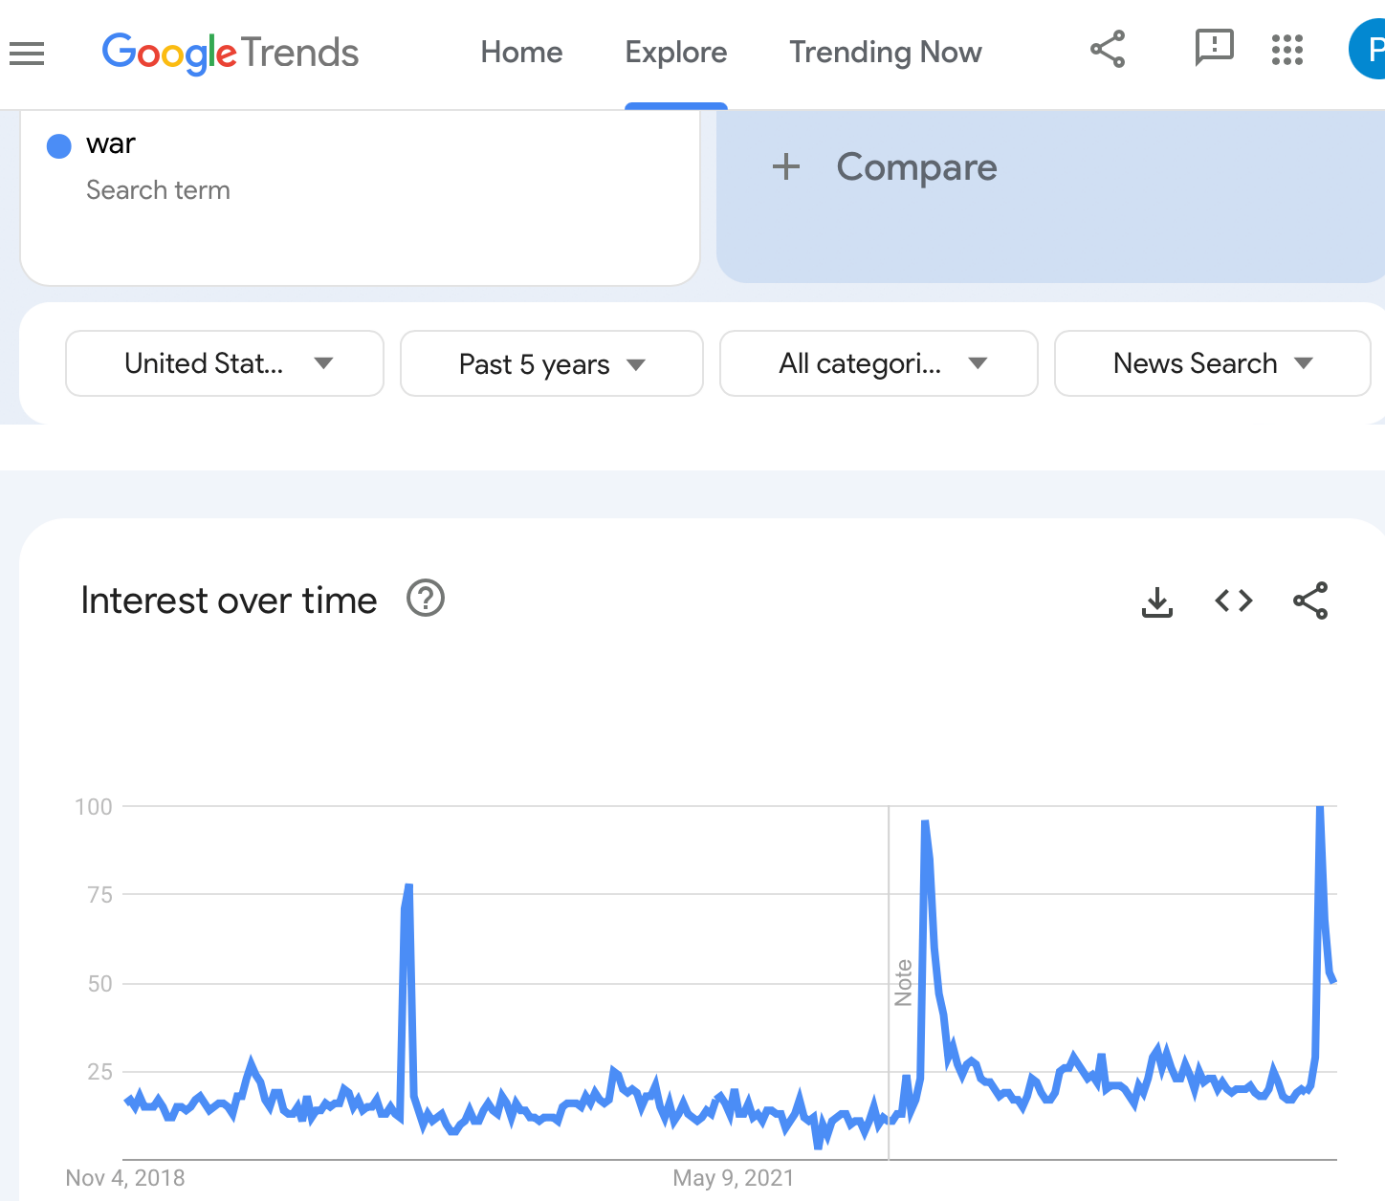
The interest peaked, gold made another attempt to move higher, and this is in perfect tune with what happened after the Russian invasion back in 2022.
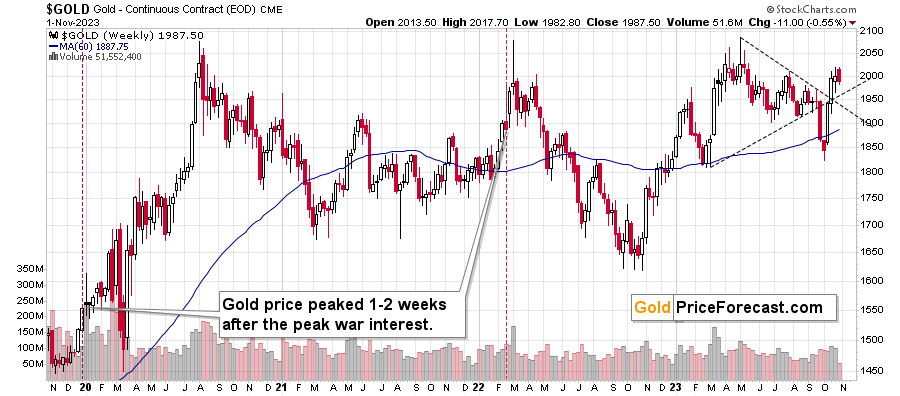
Back then, that was the final top for the year, even though the conflict got uglier and uglier.
The same appears to be happening right now. The situation in the world might be getting worse, but markets move much more on emotions and sentiment than they do on real events, news, and logic. Of course, the latter influences the former, but it is the former – the emotional part is the key.
All in all, the current prediction for gold prices is bearish.
Also, while on the above chart, you can see that gold moved relatively close to its all-time highs and well above its early-2020 highs, we can’t say the same thing about silver or mining stocks.
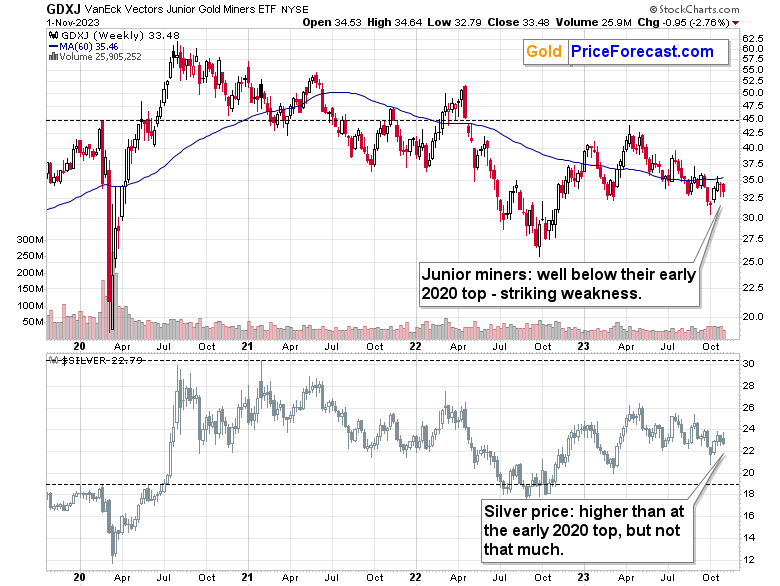
To be clear, what you see on the above chart are not even all-time highs for silver or junior miners, but the dramatic underperformance and weakness of both is crystal-clear.
Silver is somewhat above its early-2020 high but well below its mid-2020 high, and closer to the latter.
The GDXJ ETF is well below both above-mentioned highs – it’s actually trading close to the early-2023 lows… Making our current positions in it profitable.
Yes, this is extreme underperformance. And you know when we saw this kind of weakness? In 2013 and 2008, right before and during the early parts of the huge price declines.
THIS is the moment to be prepared – after the precious metals market declines significantly, a lot of gains on this move lower will already be over. Being prepared now is what your future self will likely thank you.
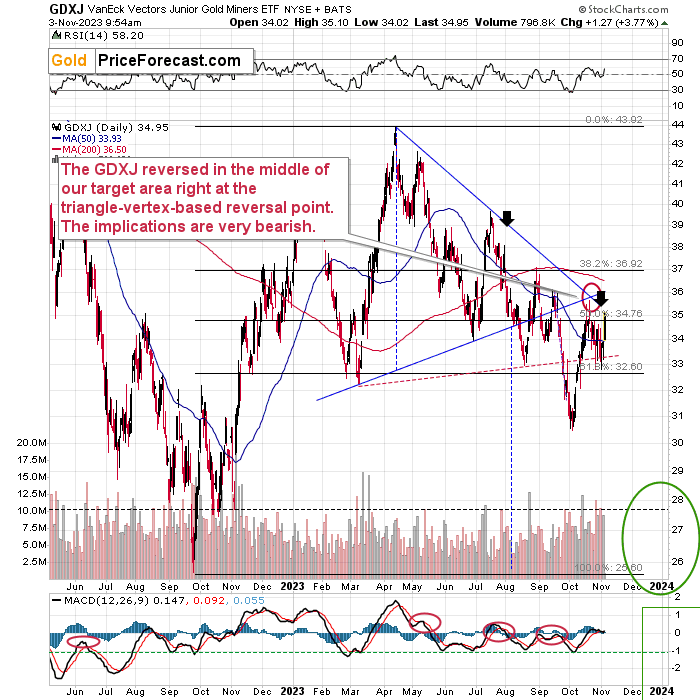
Please note that the above chart includes a tiny part of Friday’s session – I saved that chart on Friday at 9:54 AM Eastern Time – less than 30 minutes after the opening bell.
The GDXJ moved to $35.10 before moving back below $35, and while this might seem bullish, well, it’s not.
I realize that this might be confusing, but there are some intricacies to each market, and there are some general rules. One of the latter is that the weakest sectors perform best in the final moments of a rally, as the investment public buys whatever is relatively cheap without considering that it might be cheap for a reason.
Junior miners were one of the weakest sectors recently, barely participating in stocks’ rally.
Consequently, seeing a move higher today is actually an indication that stocks are probably topping or are very close to top.
And speaking of intricacies, it’s true that mining stocks are relatively weak compared to gold around the tops, but it’s also true that they might have a fake move in the opposite direction right before the biggest part of the move starts.
We saw something opposite at the beginning of the big 2016 rally. At first, miners were weak relative to gold, only to launch a powerful move higher shortly thereafter. It seems that we’re seeing the opposite to that today.
After bottoming at my previous target price, and with RSI at about 30, stocks launched a rally. Is the rally over? That’s quite possible, especially given the rally that junior miners launched today.
It doesn’t really matter, though. Gold is likely to slide, and since stocks are likely to turn south any day now (please note how stocks already topped three times when they tried to move above their 50-day moving average – that’s their fourth attempt, which is also likely to be unsuccessful), the implications for the precious metals market remain bearish. In other words, the profits from our short positions in the GDXJ are likely to increase further.
The USD Index continues to support lower precious metals prices as well, as it’s likely to rally in the near future.
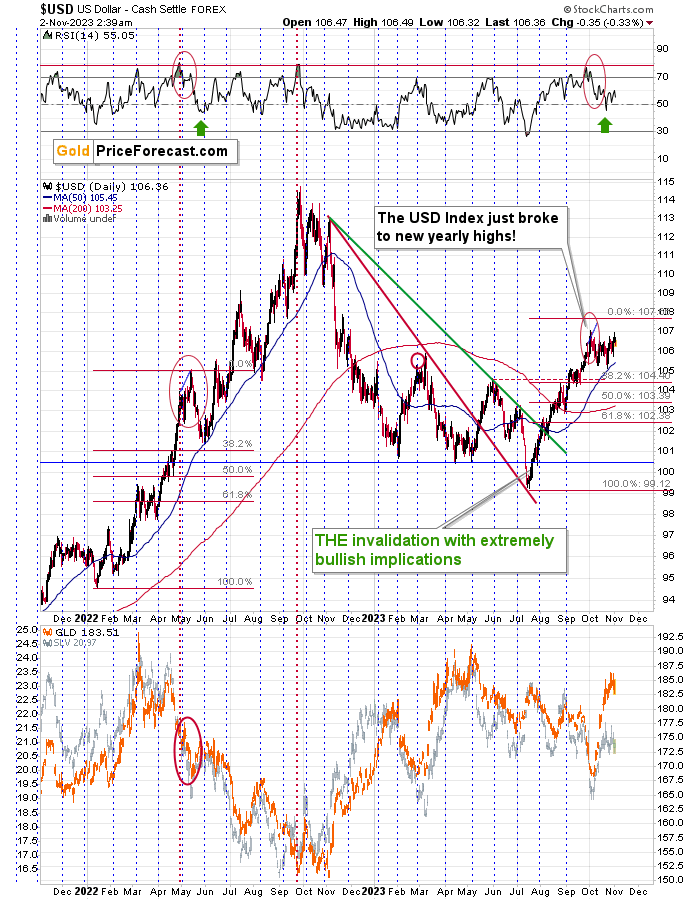
The U.S. currency is behaving similarly to what it did in mid-2022, right before it moved to its 50-day moving average when the RSI moved temporarily below 50 (marked with green arrows).
Back then, there was some back-and-forth trading before the USDX soared once again, and we just saw the same thing recently. As the similarity remains intact, the implications remain bullish. And as the correlation between the USDX and the precious metals sector is negative, the above has bearish implications for gold, silver, and mining stocks.
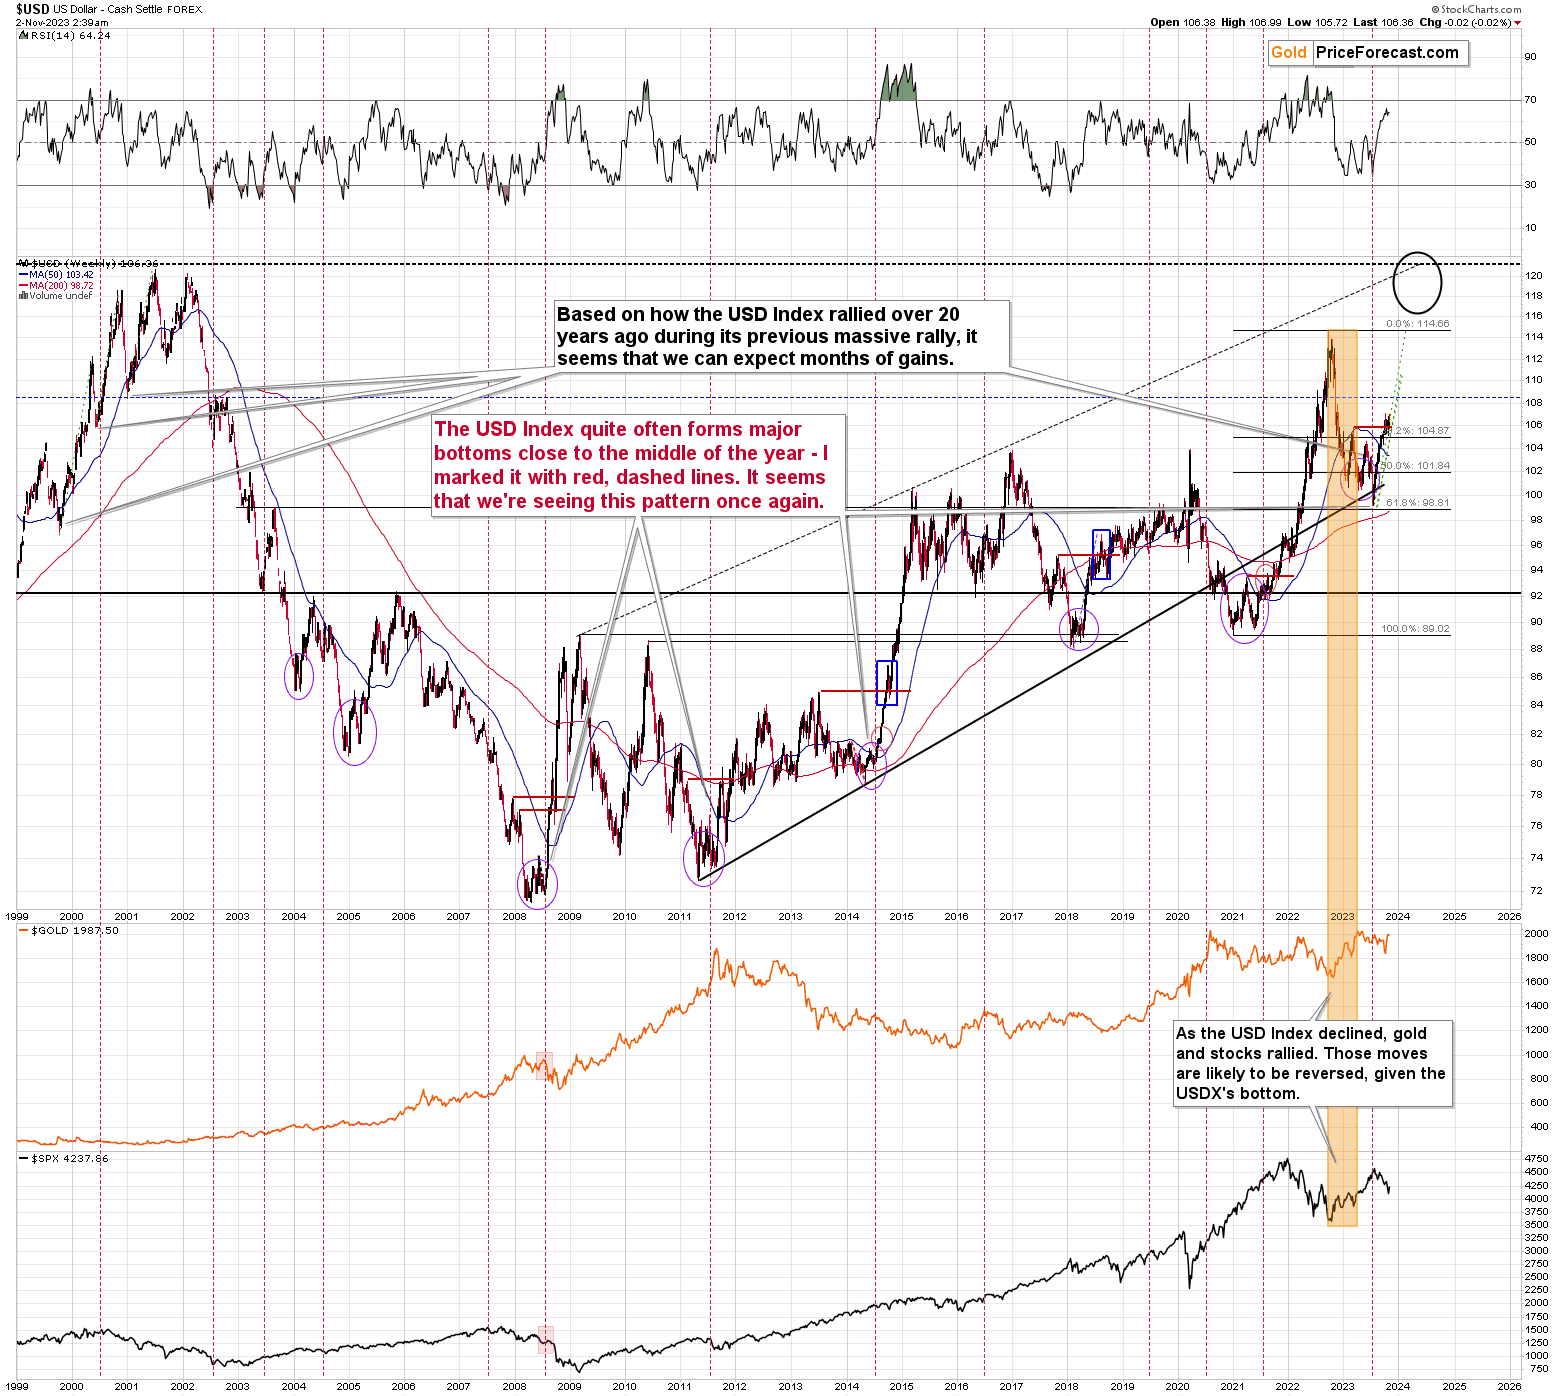
Let’s not forget that even though the recent rally in the USDX might seem “too big”, the reality is that when the U.S. currency moved higher from similar levels about 20 years ago, it rallied much more during the short-term upswings. So, the potential for growth in the near term is still here.
Also, let’s not lose sight of the forest while looking at the trees.
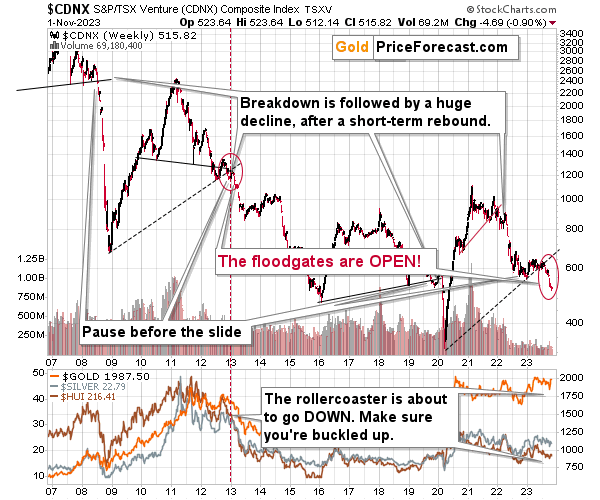
The above chart features the Toronto Stock Exchange Venture Index, which serves as a long-term proxy for junior miners, as so many of them are listed in that index. The TSXV is not something covered frequently by most gold experts, and in my view – incorrectly so.
The thing is that this index not only broke below its long-term support line but also moved visibly lower, and we saw something very similar in 2008 and 2013 in the early parts of the massive declines in the mining stocks (and in the rest of the precious metals sector).
So, while the very short-term chart suggests that the mining stocks are about to move lower shortly, the long-term chart shows just how dire the situation really is.
Before summarizing, let’s take a look at the situation in copper.
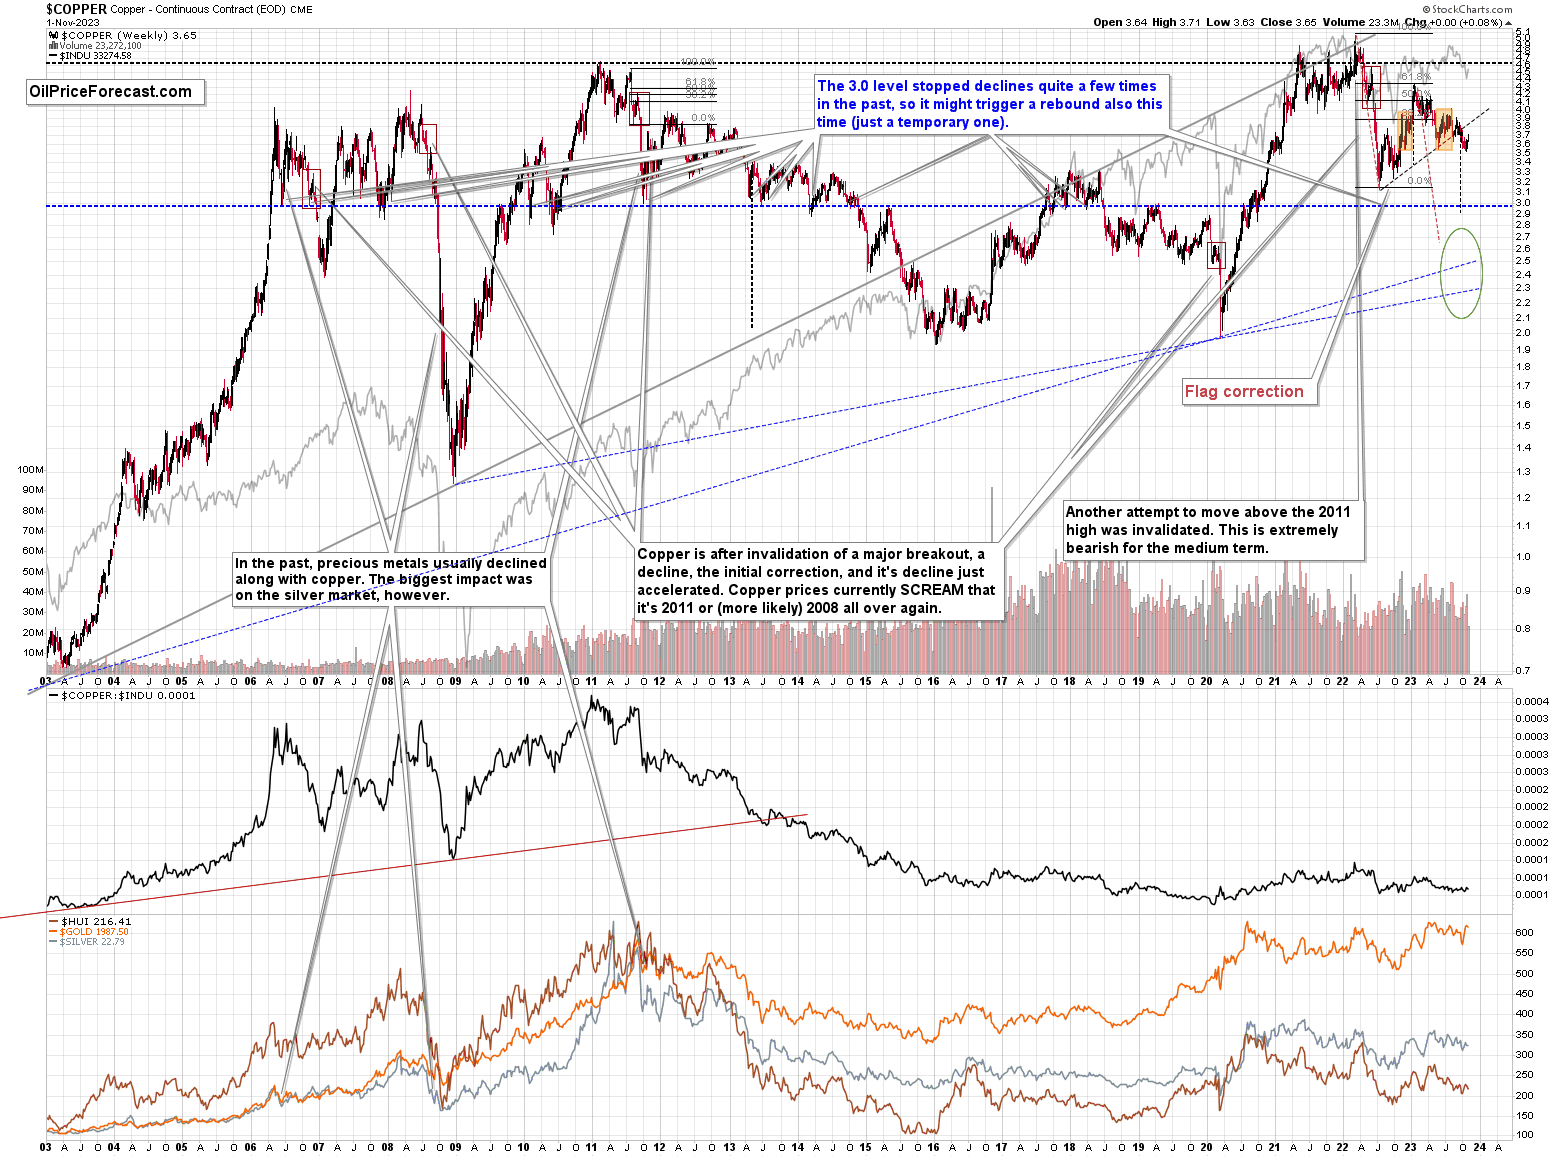
In short, copper corrected a bit this week, but it didn’t change anything from the medium-term point of view.
The price of copper is after a confirmed breakdown below the head-and-shoulders pattern, which makes a move to about $3.0, very likely here.
And the fact that the FCX – a flagship copper and gold stock didn’t rally recently only adds to the bearish picture.
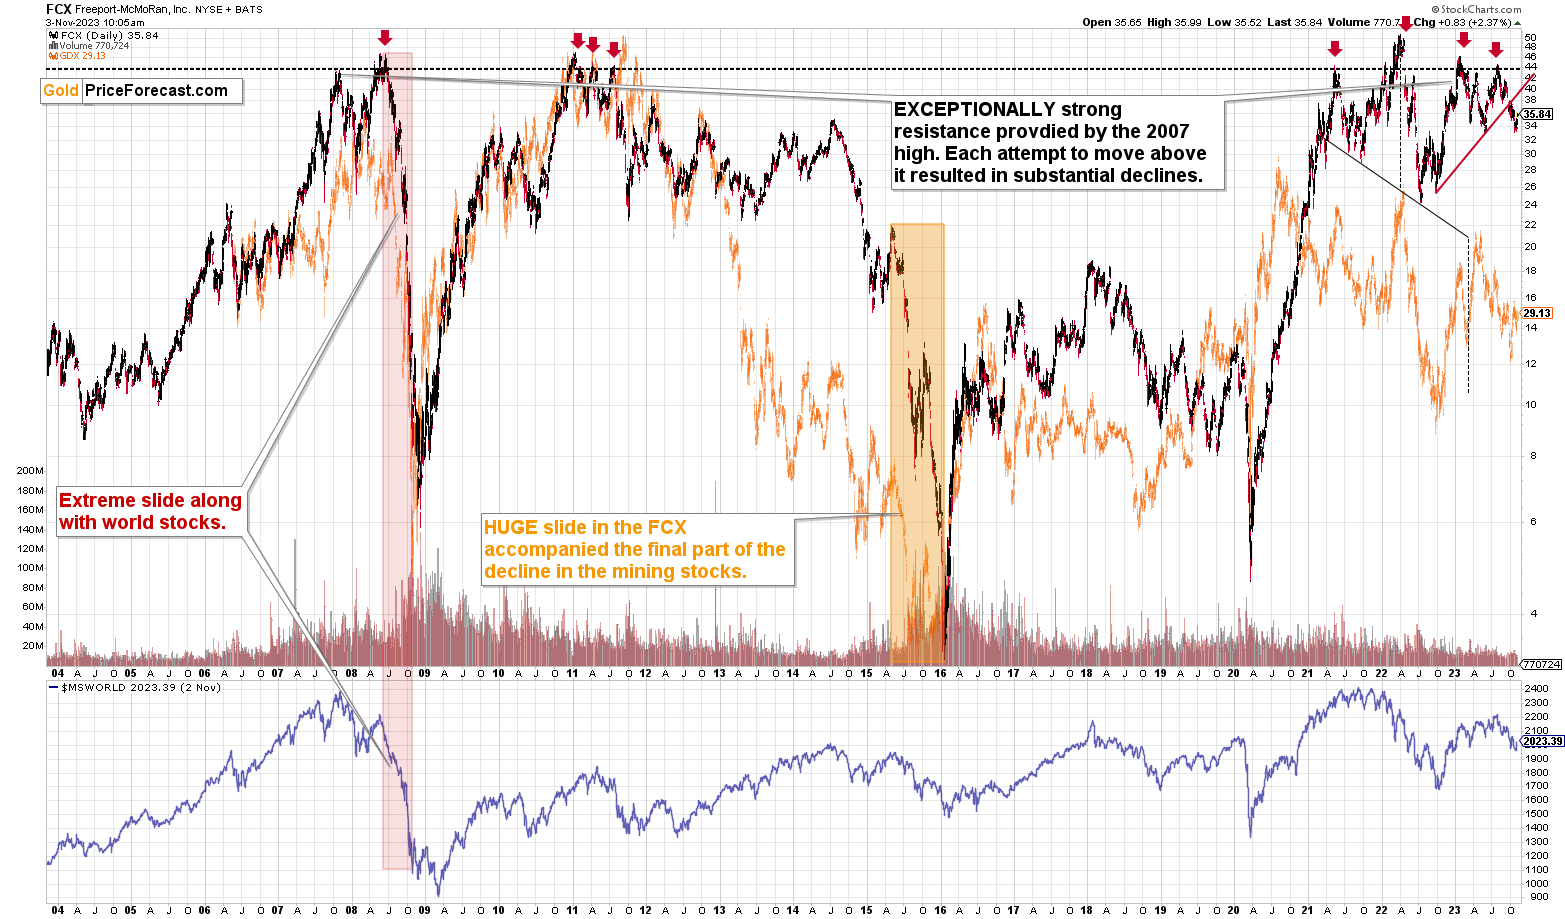
The FCX price is not only after a confirmed breakdown – it’s actually testing its yearly lows. Once those are taken out, FCX will be on its way to slide to the previous yearly lows (and then lower).
Yes, it’s true that FCX rallied in today’s early trading, but – just like junior miners – it was particularly weak recently, so the same bearish implications apply to FCX as the ones that I discussed below the GDXJ chart. It’s likely yet another sign that the stock market is topping.
As always, we’ll keep you – our subscribers – informed.
= = =
On a different note, I would like to invite you to the online event that summarizes my (PR here) studies at Stanford.
It’s on Saturday at 8 p.m. CET (noon Pacific Time)
The Applied Compassion Training lasted 11 months and many wonderful people carried out their projects as part of it. And so did I :)
The “Investor Resilience Program”, or rather its initial part entitled “Regain Inner Strength Experience”, took place on our social media channels and some of you participated in it.
The entire event summarizing the program lasts 3 hours - I will talk about RISE for about 15 minutes (and what’s going to happen next). And no, I don’t know what time, but I definitely won’t be doing the intro, so I’m guessing this part will start around 9 p.m. CET (1 PM PT). However, the rest of the event may also be interesting for you - practically all the projects were interesting, and a general discussion of the program will show why the Dalai Lama decided to invest (including capital!) in its creation (ACT, not RISE :) ).
Participation is free, but registration is required, and you can register using the following link
https://www.appliedcompassionacademy.com/public-events

= = =
If you’d like to become a partner/investor in Golden Meadow, you’ll find more details in the above link.
Overview of the Upcoming Part of the Decline
- It seems that the recent – and probably final – corrective upswing in the precious metals sector is over.
- If we see a situation where miners slide in a meaningful and volatile way while silver doesn’t (it just declines moderately), I plan to – once again – switch from short positions in miners to short positions in silver. At this time, it’s too early to say at what price levels this could take place and if we get this kind of opportunity at all.
- I plan to switch from the short positions in junior mining stocks or silver (whichever I’ll have at that moment) to long positions in junior mining stocks when gold / mining stocks move to their 2020 lows (approximately). While I’m probably not going to write about it at this stage yet, this is when some investors might consider getting back in with their long-term investing capital (or perhaps 1/3 or 1/2 thereof).
- I plan to return to short positions in junior mining stocks after a rebound – and the rebound could take gold from about $1,450 to about $1,550, and it could take the GDXJ from about $20 to about $24. In other words, I’m currently planning to go long when GDXJ is close to $20 (which might take place when gold is close to $1,450), and I’m planning to exit this long position and re-enter the short position once we see a corrective rally to $24 in the GDXJ (which might take place when gold is close to $1,550).
- I plan to exit all remaining short positions once gold shows substantial strength relative to the USD Index while the latter is still rallying. This may be the case with gold prices close to $1,400 and GDXJ close to $15 . This moment (when gold performs very strongly against the rallying USD and miners are strong relative to gold after its substantial decline) is likely to be the best entry point for long-term investments, in my view. This can also happen with gold close to $1,400, but at the moment it’s too early to say with certainty.
- The above is based on the information available today, and it might change in the following days/weeks.
You will find my general overview of the outlook for gold on the chart below:
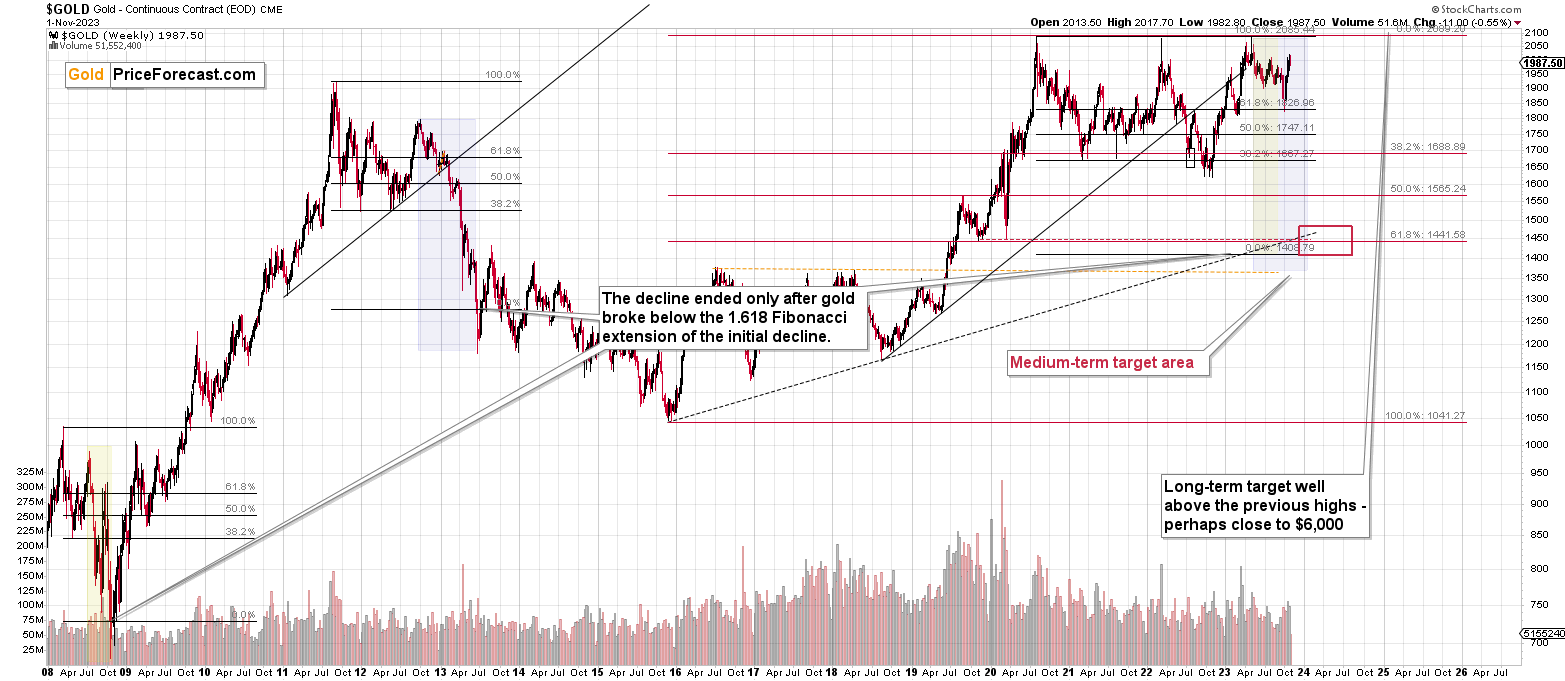
Please note that the above timing details are relatively broad and “for general overview only” – so that you know more or less what I think and how volatile I think the moves are likely to be – on an approximate basis. These time targets are not binding nor clear enough for me to think that they should be used for purchasing options, warrants, or similar instruments.
Letters to the Editor
Please post your questions in the comments feed below the articles if they are about issues raised within the article (or in the recent issues). If they are about other, more universal matters, I encourage you to use the Ask the Community space (I’m also part of the community) so that more people can contribute to the reply and enjoy the answers. Of course, let’s keep the target-related discussions in the premium space (where you’re reading this).
Summary
To summarize, the medium-term trend in the precious metals sector remains clearly down, and it seems that the corrective upswing is already over and the profits on our current short position are going to increase. We just caught the 11th profitable trade in a row – congratulations. The outlook for the short positions in junior miners and in the FCX remains very favorable.
===
Finally, since 11th profitable trade in a row is such a great piece of news (and the same goes for the fact that the current short position is already profitable), here’s… Even more great news! The possibility to extend your subscription for up to three years (at least by one year) with a 20% discount from the current prices is still open.
Locking in those is a great idea not only because it’s perfect time to be ready for what’s next in the precious metals market, but also because the inflation might persist longer than expected and prices of everything (including our subscriptions) are going to go up in the future as well. Please reach out to our support – they will be happy to assist you and make sure that your subscription days are properly extended at those promotional terms. So, for how many years would you like to lock-in your subscription?
To summarize:
Short-term outlook for the precious metals sector (our opinion on the next 1-6 weeks): Bearish
Medium-term outlook for the precious metals sector (our opinion for the period between 1.5 and 6 months): Bearish initially, then possibly Bullish
Long-term outlook for the precious metals sector (our opinion for the period between 6 and 24 months from now): Bullish
Very long-term outlook for the precious metals sector (our opinion for the period starting 2 years from now): Bullish
As a reminder, Gold Investment Updates are posted approximately once per week. We are usually posting them on Monday, but we can’t promise that it will be the case each week.
Our preferred ways to invest in and to trade gold along with the reasoning can be found in the how to buy gold section. Additionally, our preferred ETFs and ETNs can be found in our Gold & Silver ETF Ranking.
Moreover, Gold & Silver Trading Alerts are posted before or on each trading day (we usually post them before the opening bell, but we don’t promise doing that each day). If there’s anything urgent, we will send you an additional small alert before posting the main one.
Thank you.
Przemyslaw K. Radomski, CFA
Founder, Editor-in-chief

