

Briefly: gold and the rest of the precious metals market are likely to decline in the next several weeks/months and then start another powerful rally. Gold’s strong bullish reversal/rally despite the USD Index’s continuous strength will likely be the signal confirming that the bottom is in.
Welcome to this week's Gold Investment Update.
Predicated on last week’s price moves, our most recently featured medium-term outlook remains the same as the price moves align with our expectations (and we not only took profits from two previous short positions, but we profited on the rebound and currently have unrealized gains on our current GDXJ ETF short). On that account, there are parts of the previous analysis that didn’t change at all in the earlier days and are written in italics.
Risk assets have been all over the place, as rallying bonds helped boost the S&P 500 while oil and mining stocks remained under pressure. Consequently, anxiety is elevated, as traders aren’t sure how to price in the weakening economic backdrop. Luckily, the technicals paint clear portraits and allow us to block out the noise and focus on the primary trends.
We’ll begin today’s alert by dissecting the fundamentals and then dive into the technical aspects that have proven so prescient over the last several months.
Gold Clings to Its War Premiums
With our GDXJ ETF short position continuing to produce profits, miners’ weakness alongside gold’s strength highlights how bears and bulls can make money in this market. However, with the yellow metal poised to follow the junior miners lower over the medium term, the poor domestic fundamental outlook should outweigh gold’s geopolitical optimism.
For example, S&P Global released its U.S. Services PMI on Nov. 3. And since output prices “cooled to the softest since October 2020,” growth has overtaken inflation as the main problem confronting the U.S. economy. Chris Williamson, Chief Business Economist at S&P Global Market Intelligence, said:
“The PMI survey paints a far more subdued picture of U.S. economic health than the latest bumper GDP numbers, with October seeing very muted growth of business activity for a third successive month.
“A summer-surge in service sector activity, fueled by rising consumer spending, has stalled. Manufacturing is meanwhile also struggling to regain momentum amid weak global demand. As such, the survey data are broadly consistent with GDP rising at an annual rate of around 1.5%.”
Please see below:
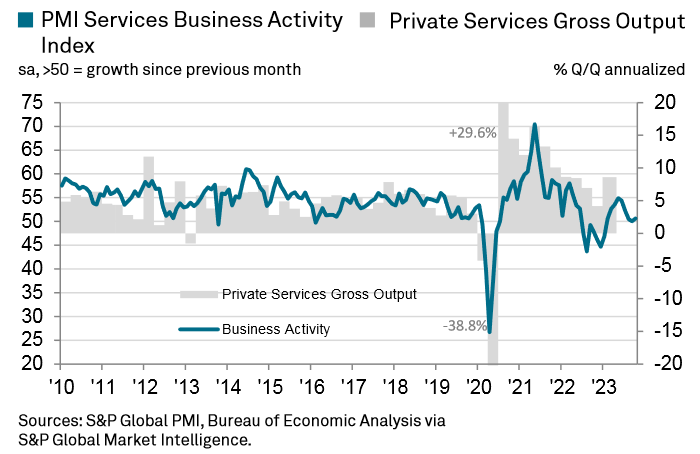
To explain, the blue line above tracks S&P Global’s U.S. Services PMI, while the gray bars above track private services gross output. If you analyze the former’s decline on the right side of the chart, you can see why the firm expects GDP growth to come in below potential (2%). Consequently, silver is firmly in the crosshairs, as economic-induced volatility should hit the white metal and the miners the hardest.
As further evidence, the ISM also released its Services PMI on Nov. 3. Anthony Nieves, Chair of the ISM Services Business Survey Committee, said:
“The services sector continues to slow, with decreases in the Business Activity and Employment indexes. Sentiment among Business Survey Committee respondents' comments is mixed, with some optimistic about the current steady and stable business conditions and others concerned about such economic factors as inflation, interest rates, and geopolitical events.”
So, while the crowd remains fixated on inflation, their growth over-optimism should lead to a Minsky Moment over the medium term.
Powell’s Mistake
While we warned throughout 2021 that inflation would not be transitory, Powell and the crowd were happy to follow that narrative. Now, they remain inflation hawks, which should only worsen the outlook for assets like oil and the PMs.
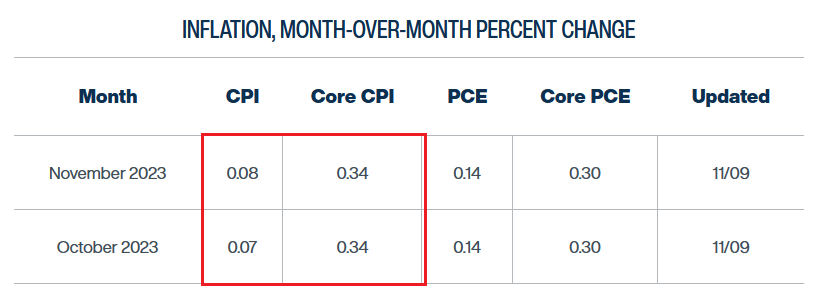
The Cleveland Fed has the headline Consumer Price Index (CPI) coming in roughly flat month-over-month (MoM) in October and November, which means little to no inflation. And while the core CPI is expected to hit 0.34% MoM, which is still too high, it should weaken alongside the U.S. labor market.
Please see below:
Similarly, while surging used car prices were all the rage in 2021, the tide has turned.
Please see below:
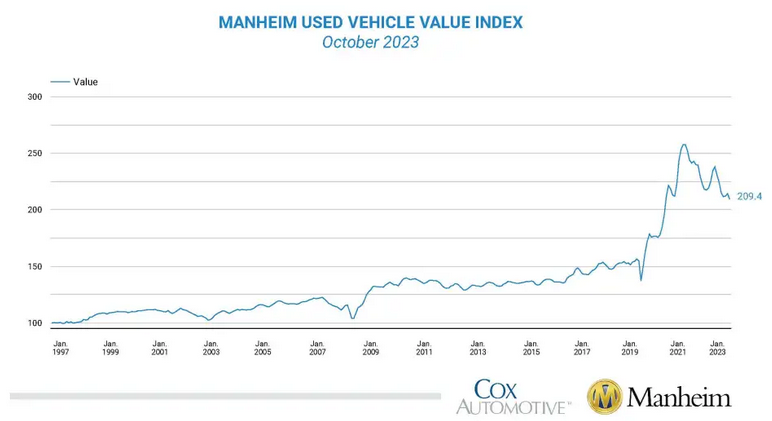
To explain, the Manheim Used Vehicle Value Index (MUVVI) decreased by 2.3% MoM, “a reversal of the gains that were seen during the prior two months.” As a result, a downtrend is firmly in place, and higher long-term interest rates should only intensify the slide in the months ahead.
Likewise, it’s important to note that the Shelter CPI accounts for more than 30% of the headline CPI’s movement. And with Apartment List noting that the median rent dropped by 0.7% MoM in October, it’s “the third consecutive month of negative rent growth, and declines are likely to persist in the coming months as we head into the winter.”
The report added:
“This is the second steepest October rent decline that we’ve seen in the history of our index (going back to 2017). The only time that October brought a sharper decline was last year, when rents fell by 0.8 percent as the market shifted into the period of sluggishness that still persists. For comparison, from 2017 to 2020, October declines ranged from -0.4 to -0.6 percent.”
Please see below:
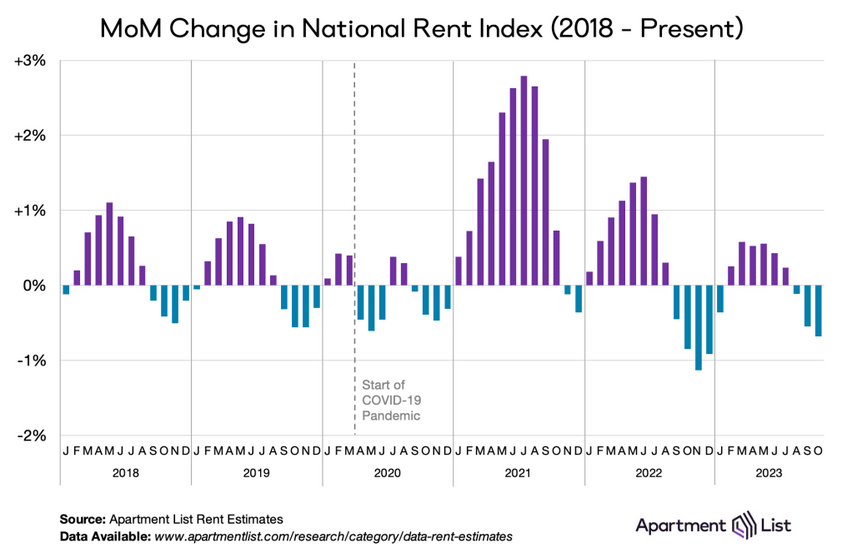
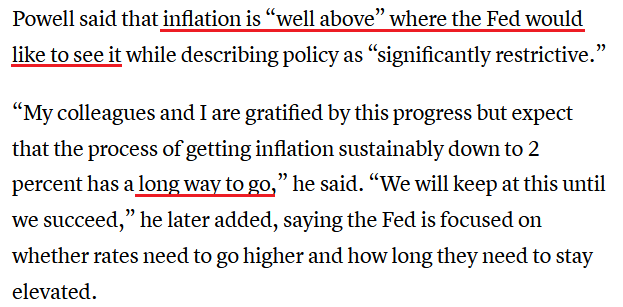
To explain, the weakness on the right side of the chart highlights how rent inflation is nothing like 2021. Yet, with Powell remaining hawkish on Nov. 9, his disposition should lead to more economic carnage, which is bullish for the USD Index. He said:
“The Federal Open Market Committee is committed to achieving a stance of monetary policy that is sufficiently restrictive to bring inflation down to 2% over time; we are not confident that we have achieved such a stance.”
Thus, when Powell realizes the severity of the economic weakness, it will likely be too late to stop financial assets’ sell-offs.
Overall, we believe Powell is making another policy mistake. He misread inflation in 2021, and now he’s misreading growth. And with assets like mining stocks, oil, and the S&P 500 poised to suffer the consequences, Treasury bonds and the U.S. dollar should be the best-performing assets if (when) volatility erupts.
Bad Data Is Bad News for Silver
The crowd continues to celebrate weak data as a less hawkish Fed cools Treasury yields and lets risk assets breathe. However, that narrative did not work on Nov. 9, as another bond market sell-off sapped sentiment.
Yet, while the prospect of lower rates may seem bullish for silver, an economic shock should lead to a profound drawdown over the medium term.
For example, continued unemployment claims rose for their seventh consecutive week on Nov. 9. For context, the metric measures the number of Americans who file for unemployment insurance more than once.
Please see below:
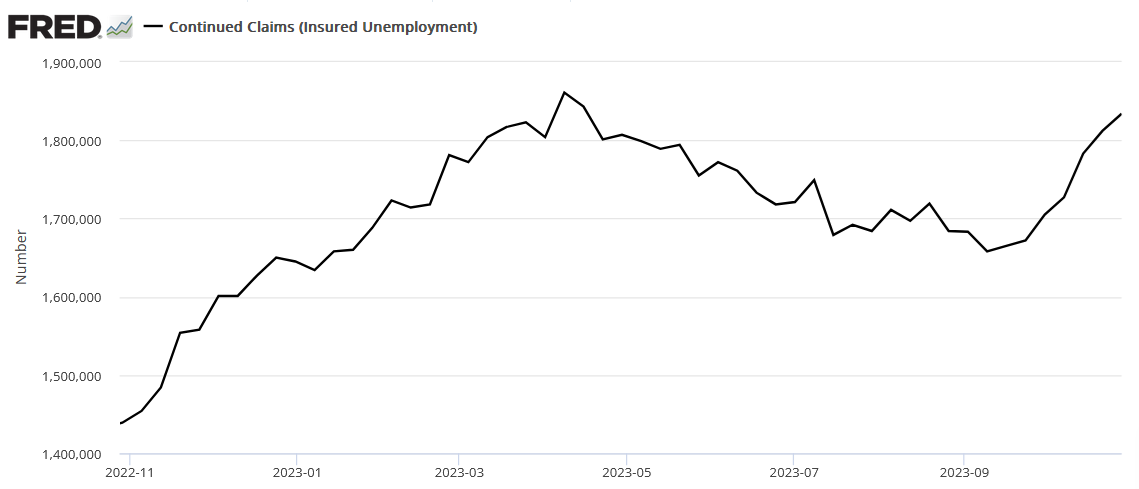
To explain, the sharp jump on the right side of the chart highlights how long-term interest rates have made their presence felt in the real economy. And with oil noticing the destruction, it’s no surprise crude has declined materially from its September and October highs.
In addition, Challenger, Gray, and Christmas Inc. released its job cuts report on Nov. 2. And while the data was decent MoM, an excerpt read:
“So far this year, employers have announced plans to cut 641,350 jobs, a 164% increase from the 243,338 cuts announced in the first ten months of 2022. This is the highest January-October total since 2020 when 2,162,928 cuts were announced. It is the second-highest total since 2009 when companies announced 1,192,187 job cuts.”
Furthermore, the retail outlook was highly ominous. The report added:
“Retailers have announced 72,182 cuts through October the sector, a 258% increase from the 20,191 through the same period last year. It is the highest total since 179,520 cuts were announced through October in 2020.”
And as for the holidays:
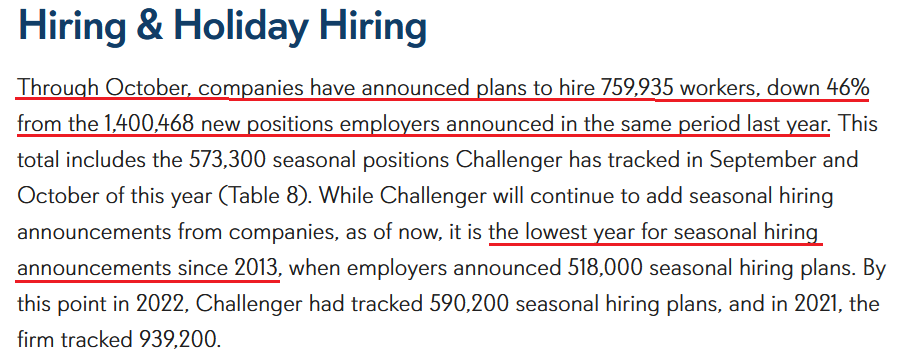
On top of that, Apollo Chief Economist Torsten Sløk wrote on Nov. 7:
“Hiring for the holiday season is generally done in October, and adding up new jobs created in the BLS-defined holiday season retail sectors in the latest employment report shows that retailers expect a weaker holiday season. This soft outlook is consistent with growing inventories at many retailers.”
Please see below:
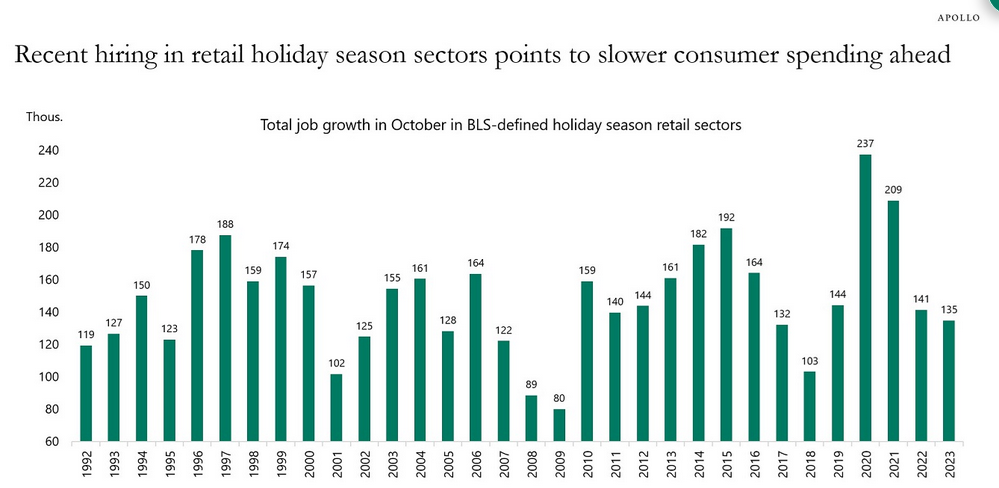
To explain, the relatively short green bar on the right side of the chart highlights how retail hiring in 2023 has been weaker than prior years, especially in 2020 and 2021. As a result, while gold should suffer too when economic-induced volatility strikes, silver and mining stocks will likely bear the brunt of investors’ wrath.
More Employment Concerns
Amid mounting evidence, A.P. Moller-Maersk, the largest shipping company in the world, blamed overcapacity, rising costs, and weaker prices for its disastrous third quarter. CEO Vincent Clerc said:
“The new normal we are now headed into is one of more subdued macroeconomic outlook, and thus soft volume demands for the coming years, prices back in line with historical levels, inflationary pressures on our cost base, especially from energy cost, and also increased geopolitical uncertainty.”
Also, say goodbye to ~10,000 jobs:
Finally, The Conference Board released its Employment Trends Index (ETI) on Nov. 6. The index “decreased in October to 114.16, from a downwardly revised 114.63 in September,” and a continuation of the trend should only enhance the USD Index’s attractiveness.
Please see below:
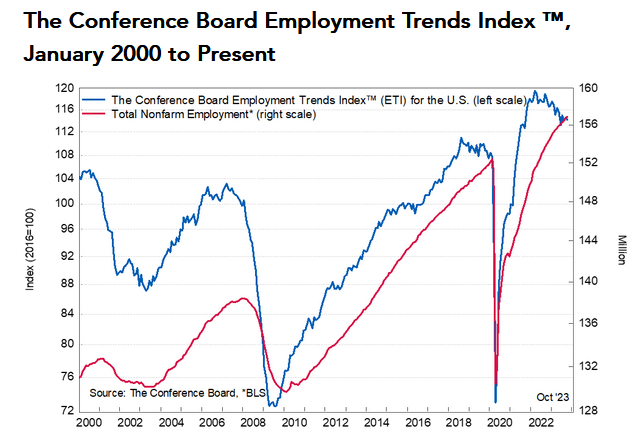
To explain, the blue line above tracks The Conference Board’s ETI, while the red line above tracks total U.S. nonfarm employment. If you analyze the relationship, you can see that when the blue line drops, the red line isn’t far behind. As such, with more pain poised to materialize in the months ahead, we remain recession bulls in 2024.
Overall, the S&P 500 is on thin ice as pivot hopes fuel dreams of a soft landing. However, history does not support this optimism, and the unfolding economic damage should result in more scars than rate cuts can cure. In other words, when the pivot finally arrives, a major sell-off should already be underway.
The Bottom Line
Our fundamental thesis continues to unfold as expected, as a hawkish Fed and higher interest rates were the main stories in 2021 and 2022. Yet, now, these developments are weighing on the real economy, and it should culminate with a recession that eliminates inflation. Therefore, we see more downside for several assets, including the PMs, in 2024.
Overall, the PMs were mixed on Nov. 9, as mining stocks endured bearish intraday reversals. And with the USD Index recouping its 50-day moving average, we expect a continuation of the divergence in the months ahead.
Technically Speaking
Miners sunk like a stone during the afternoon trade, and the bearish price action continues to align with my technical thesis. Likewise, after warning the USD Index may have bottomed, the dollar basket outperformed on Nov. 9, which makes the PMs’ medium-term backdrops even more ominous.
As it stands, we continue to profit from our GDXJ ETF short position, and my comments from yesterday explain why I believe there is still more room for the downside.
Miners’ rally failed, gold’s upward momentum is broken, and the USDX appears to have bottomed. Very interesting times ahead!
Let’s start today’s discussion with the GDXJ’s short-term charts as that’s where we see the most interesting action.
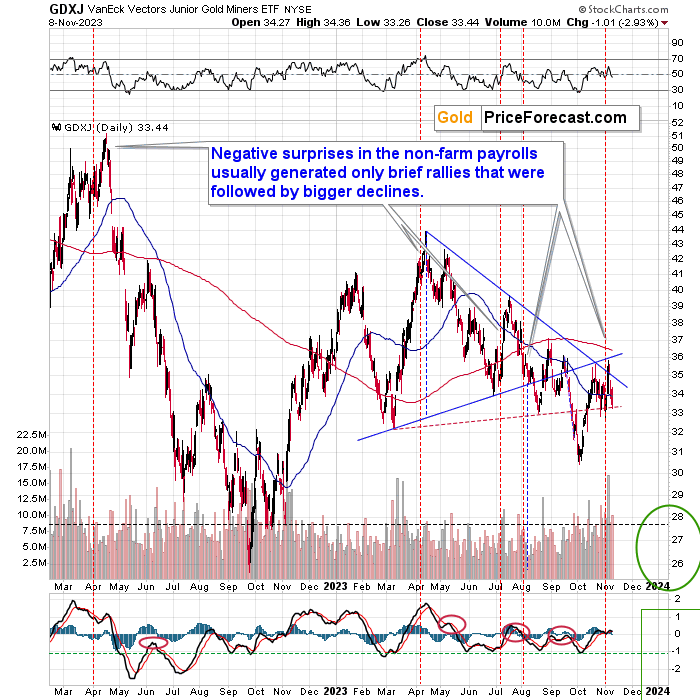
While the recent rally might have seemed like a big deal, in reality…
Junior mining stocks simply verified their breakdown below the rising, black resistance line. And it happened in perfect tune with the sizes of rallies that we saw after the previous negative surprises from the nonfarm payrolls (marked with vertical, dashed lines). This means that the top is very likely in.
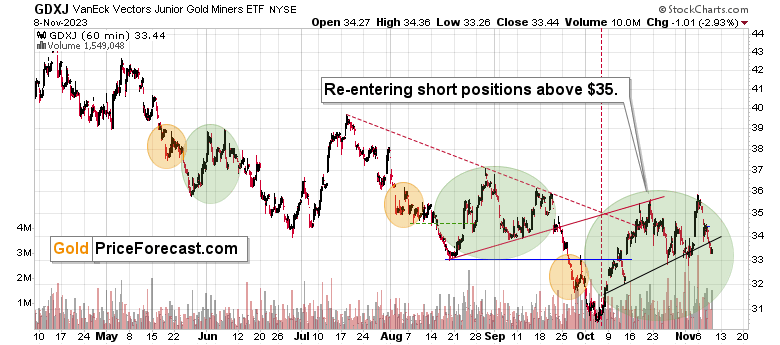
Zooming in allows us to see that the GDXJ actually broke below its very short-term support line, which is yet another bearish confirmation. After all, when that happened after the August-September double-top, it was followed by a sizable decline.
The next (temporary) stop is the previous 2023 lows.
Speaking of those lows, the price of the FCX is already testing its yearly lows.
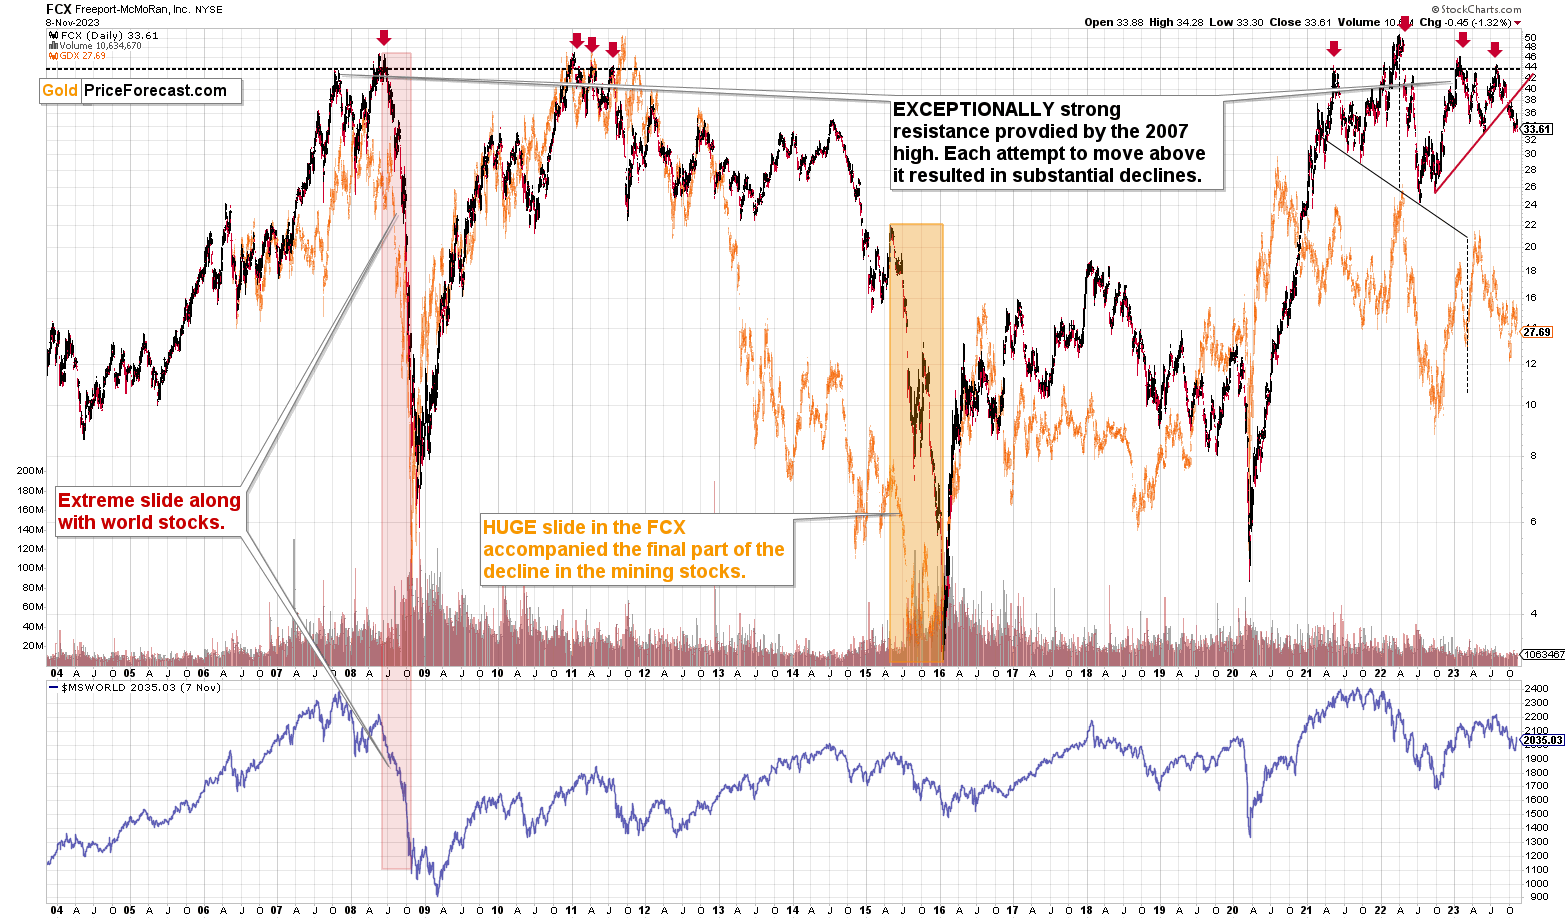
I described the technical weakness of this company multiple times in the past and indeed, it’s been moving lower recently. This year’s lows are the final short-term stop before this company’s shares tumble to its 2022 lows, and then – quite likely – much lower, similarly to what they did in 2008. In other words, it’s not only that profits from our short positions in the GDXJ are likely to increase in the future – the same goes for the profits from our short position in the FCX.
Let’s switch gears and zoom out significantly.
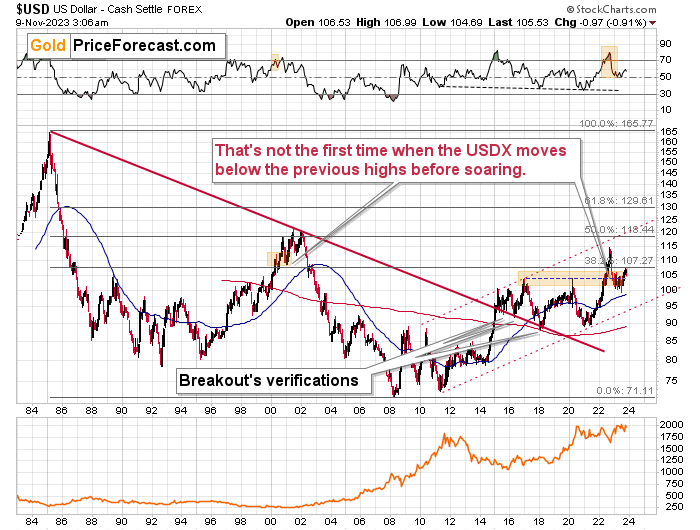
Enter the very long-term USD Index chart.
This day this, the other day that – it’s easy to get sucked into the “short-termism” while ignoring what’s really going on.
And what IS really going on in the USD Index is this:
The USDX is after a very long-term breakout and its verification. It was likely to soar based on this breakout, and when I was warning about it in the previous years, almost nobody listened. Once the USDX soared through 110 like a hot knife through butter, people paid attention, but since it corrected, people are questioning the rally once again.
Let me tell you this: Corrections. Are. Normal.
The fact that the USDX declined to its 2017 high (ok, it moved a bit below it) and then rallied back up, means that the breakout above this level was verified, and that the USDX gathered strength for another massive upswing.
This is exceptionally bullish for the following weeks and months – for the USDX that is. And since the latter and precious metals tend to move in the opposite directions, this has profoundly bearish implications for gold, silver, and mining stocks. And it has profoundly optimistic implications for those positioned to take advantage of those moves.
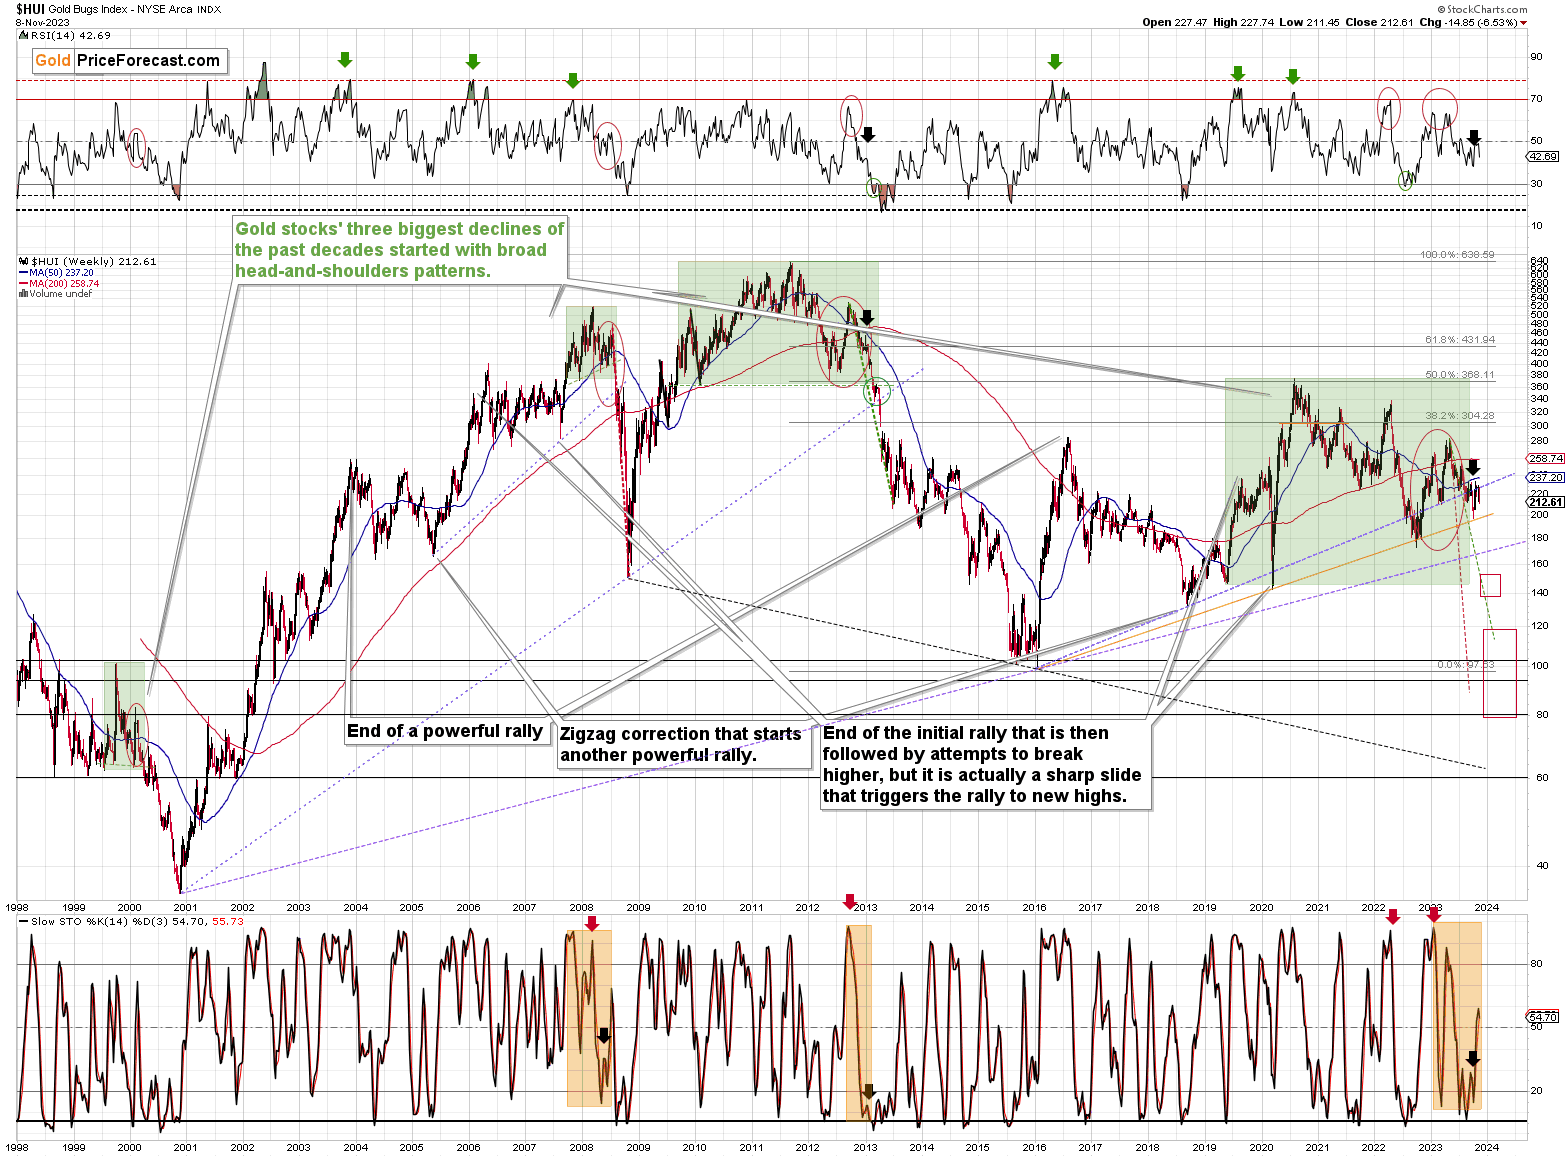
Staying with the big picture for now, we see that the gold stocks’ proxy – the HUI Index – verified its breakdown below the rising dashed resistance line. As the move was verified, the medium-term decline is now ready to continue. The implications are profoundly bearish.
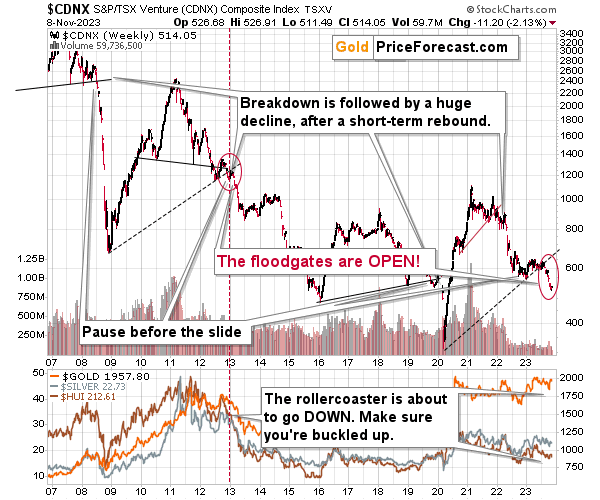
The other important proxy for mining stocks (in particular junior mining stocks) – the Toronto Stock Exchange Venture Index continues to point to much lower prices in the following weeks. The current situation is very similar to what we saw in 2008 and 2013 right before the enormous declines in the precious metals sector – and especially in mining stocks.
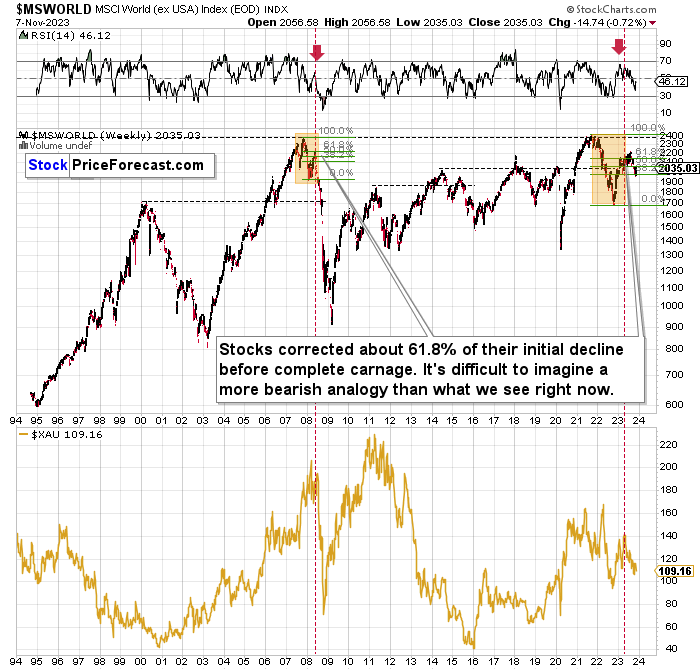
The very long-term chart featuring world stocks has just as bearish implications.
The current situation is very similar to what we saw in 2008 right before the biggest part of the decline. Stocks started their decline from pretty much the same price levels, then they declined, then they corrected about 61.8% of the initial decline, and now they are moving lower once again.
The lower part of the chart shows how extremely bearish the implications were for the mining stocks – the same is the case right now.
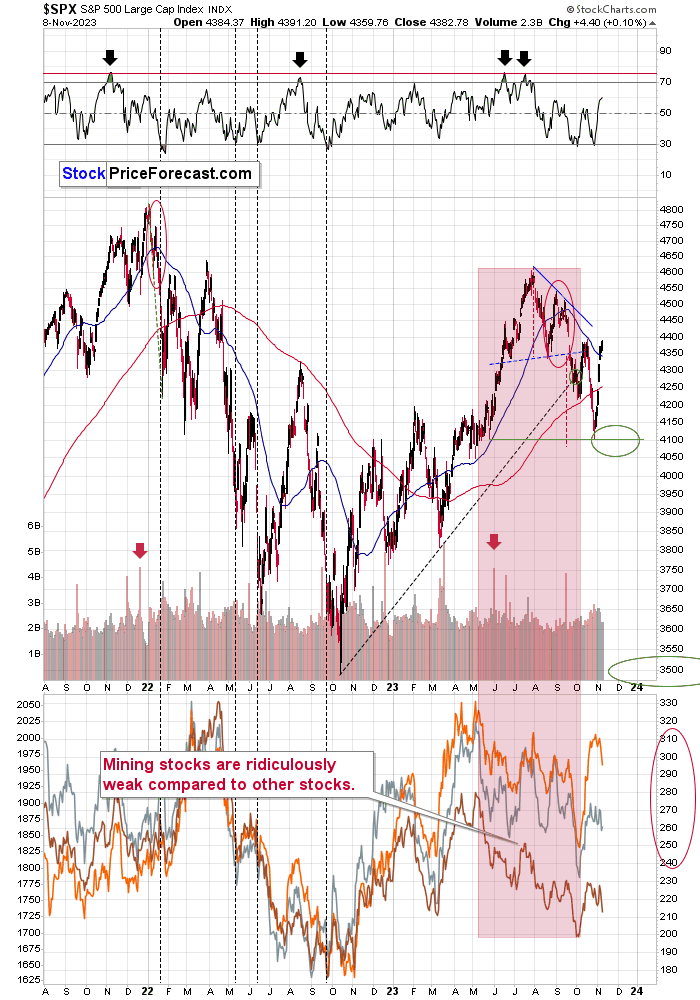
On a short-term basis, and focusing on the U.S. stock market, we saw a corrective upswing, but I wouldn’t make too much of it. The interest rates are still very high, and the economic situation becomes more difficult. Stocks are likely to reflect that.
Technically, what we’re looking at right now seems similar to the March 2022 rally. It was sharp, but it was very temporary. The decline returned with vengeance back then, and the same thing is likely also this time.
Zooming in on the USD Index, we see that it just verified its breakout above the June 2023 top by moving back to it and then rallying once again.
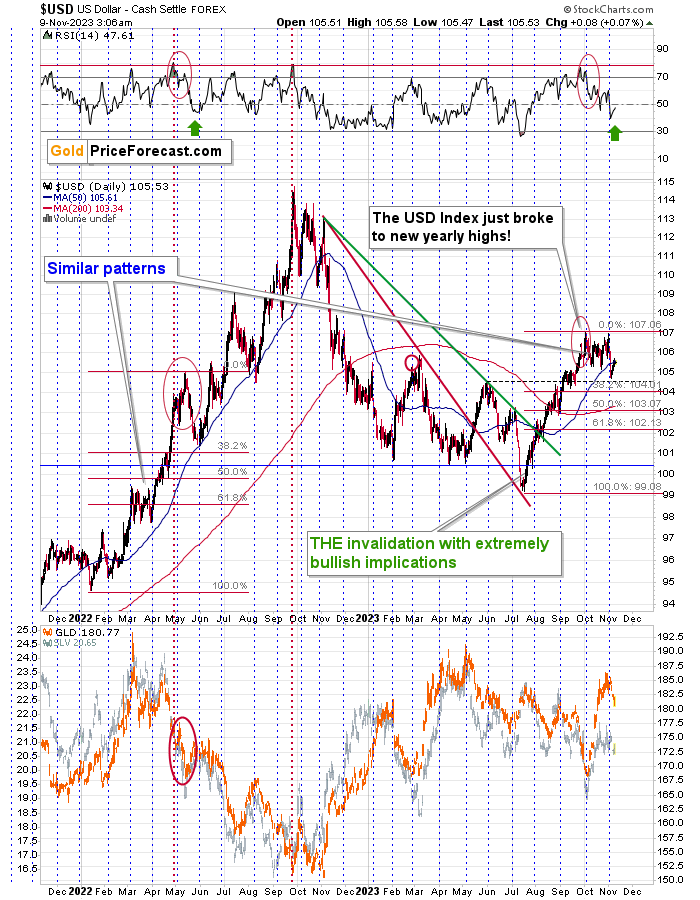
This, plus the fact that the recent pullback was similar (directly and through the RSI) to what we saw in May and June 2022, makes it likely that the USD Index is ready for another big upswing. And as I wrote earlier today, the implications for the precious metals sector are bearish.
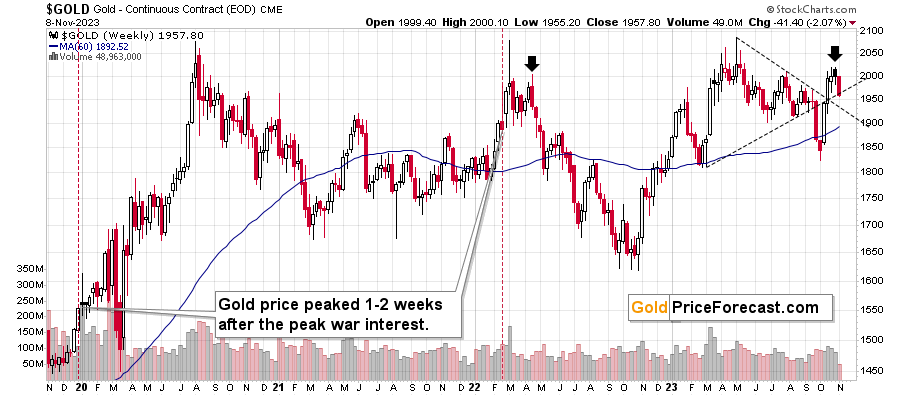
Gold itself seems ready to post the weakest weekly result since September. This is taking place after the concern with war (as measured by Google Trends’ data) peaked, and after gold topped very close to its triangle-vertex-based reversal point.
All this makes it very likely that the medium-term top in gold is indeed in.
Please note that gold just invalidated its attempt to move above $2,000. When that happened after the war concern peaked in 2022 (marked with black arrows), that meant that a big decline was about to follow. The same is likely now.
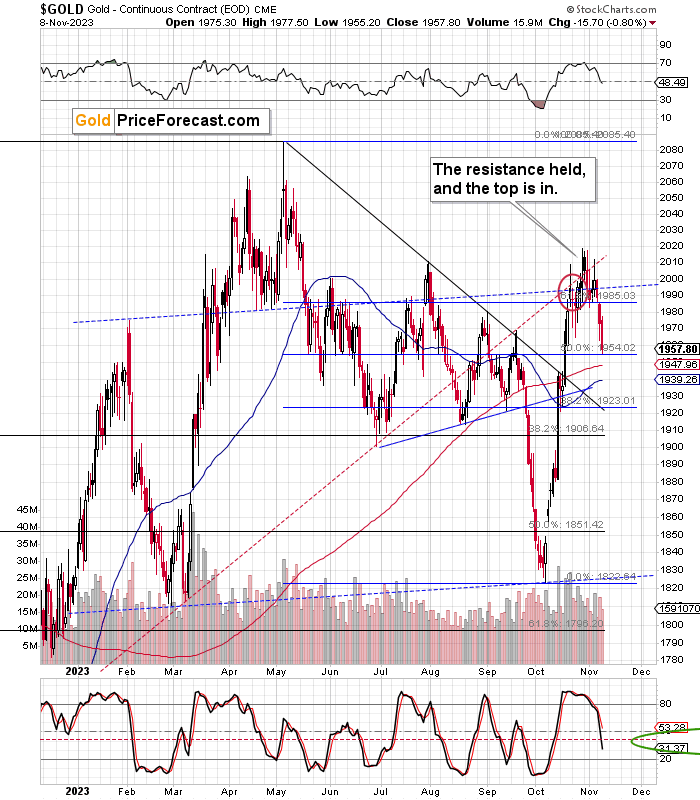
Gold’s daily chart shows that it topped in tune with its past patterns – with RSI close to 70. The combination of resistance levels close to $2,000 held. Both factors support the scenario in which gold moves lower from here.
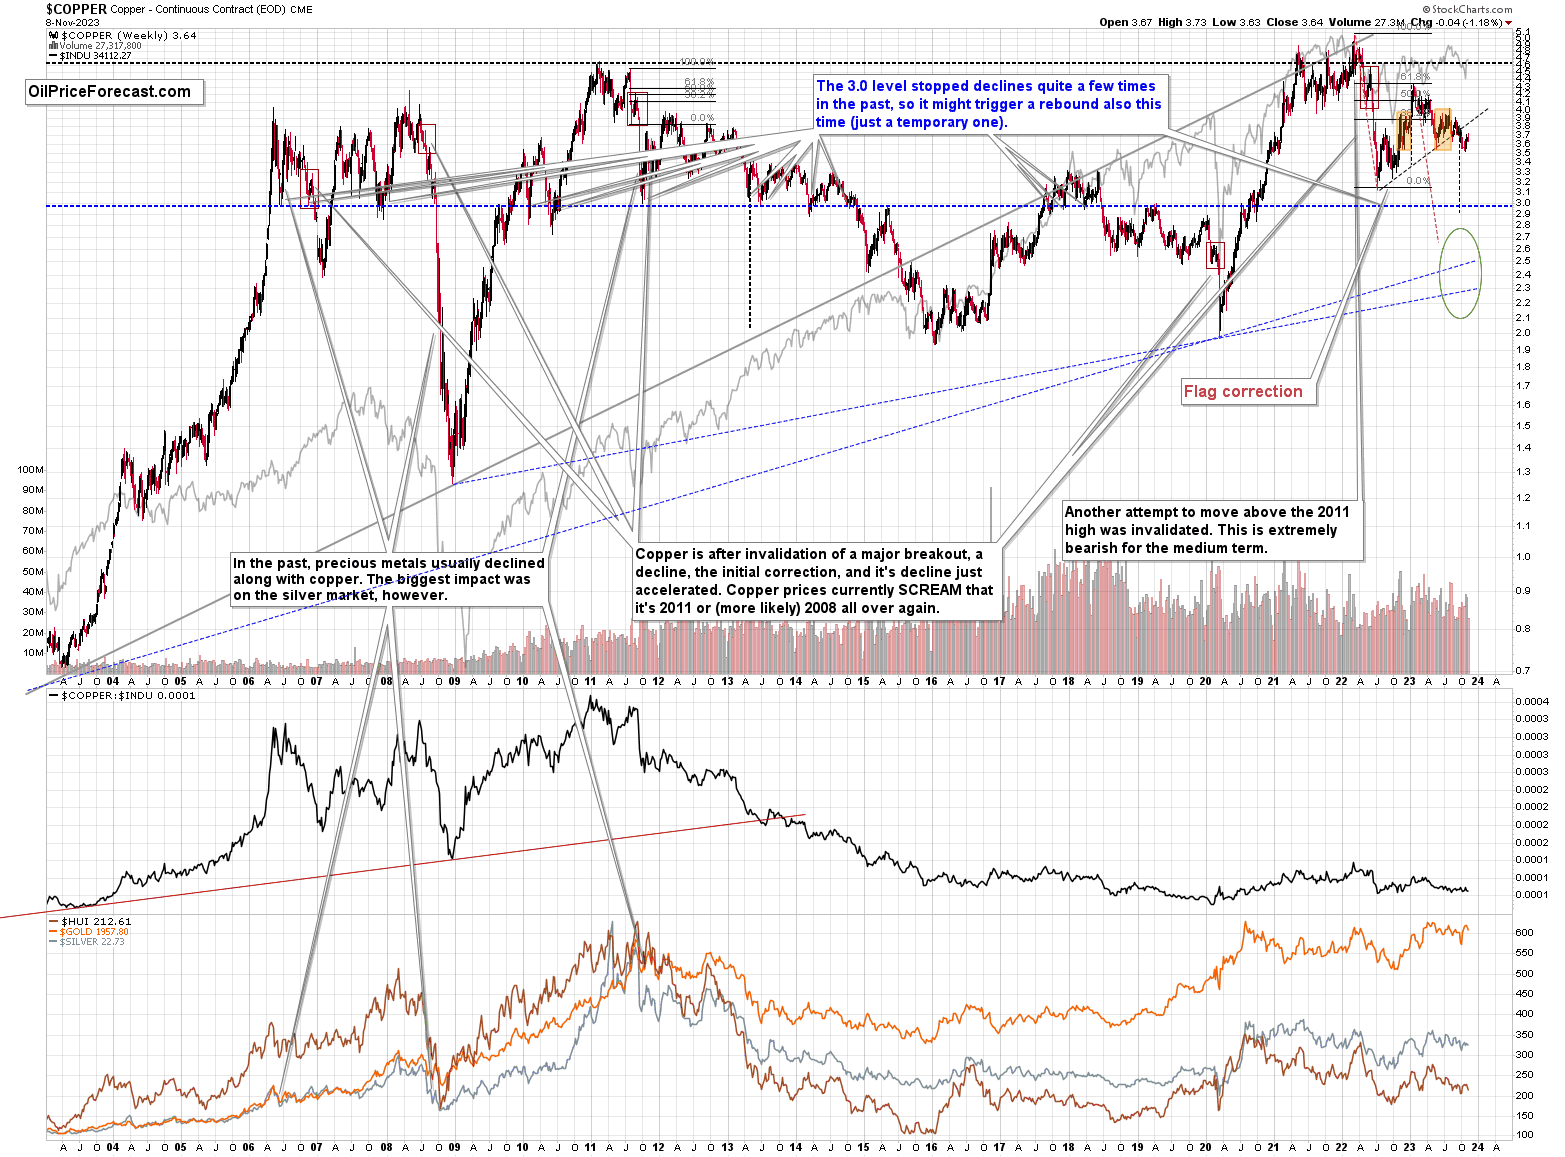
Copper verified its breakdown below the rising resistance line, and the recent small upswing didn’t change anything regarding the validity of the breakdown. The next big move in the price of copper is likely to be to the downside. The initial medium-term target is just at / slightly below $3. And then – after a pause – even lower, in the $2.3 - $2.6 range.
All in all, it seems that our profits from the short positions in the GDXJ and in the FCX are likely to increase soon.
= = =
If you’d like to become a partner/investor in Golden Meadow, you’ll find more details in the above link.
Overview of the Upcoming Part of the Decline
- It seems that the recent – and probably final – corrective upswing in the precious metals sector is over.
- If we see a situation where miners slide in a meaningful and volatile way while silver doesn’t (it just declines moderately), I plan to – once again – switch from short positions in miners to short positions in silver. At this time, it’s too early to say at what price levels this could take place and if we get this kind of opportunity at all.
- I plan to switch from the short positions in junior mining stocks or silver (whichever I’ll have at that moment) to long positions in junior mining stocks when gold / mining stocks move to their 2020 lows (approximately). While I’m probably not going to write about it at this stage yet, this is when some investors might consider getting back in with their long-term investing capital (or perhaps 1/3 or 1/2 thereof).
- I plan to return to short positions in junior mining stocks after a rebound – and the rebound could take gold from about $1,450 to about $1,550, and it could take the GDXJ from about $20 to about $24. In other words, I’m currently planning to go long when GDXJ is close to $20 (which might take place when gold is close to $1,450), and I’m planning to exit this long position and re-enter the short position once we see a corrective rally to $24 in the GDXJ (which might take place when gold is close to $1,550).
- I plan to exit all remaining short positions once gold shows substantial strength relative to the USD Index while the latter is still rallying. This may be the case with gold prices close to $1,400 and GDXJ close to $15 . This moment (when gold performs very strongly against the rallying USD and miners are strong relative to gold after its substantial decline) is likely to be the best entry point for long-term investments, in my view. This can also happen with gold close to $1,400, but at the moment it’s too early to say with certainty.
- The above is based on the information available today, and it might change in the following days/weeks.
You will find my general overview of the outlook for gold on the chart below:
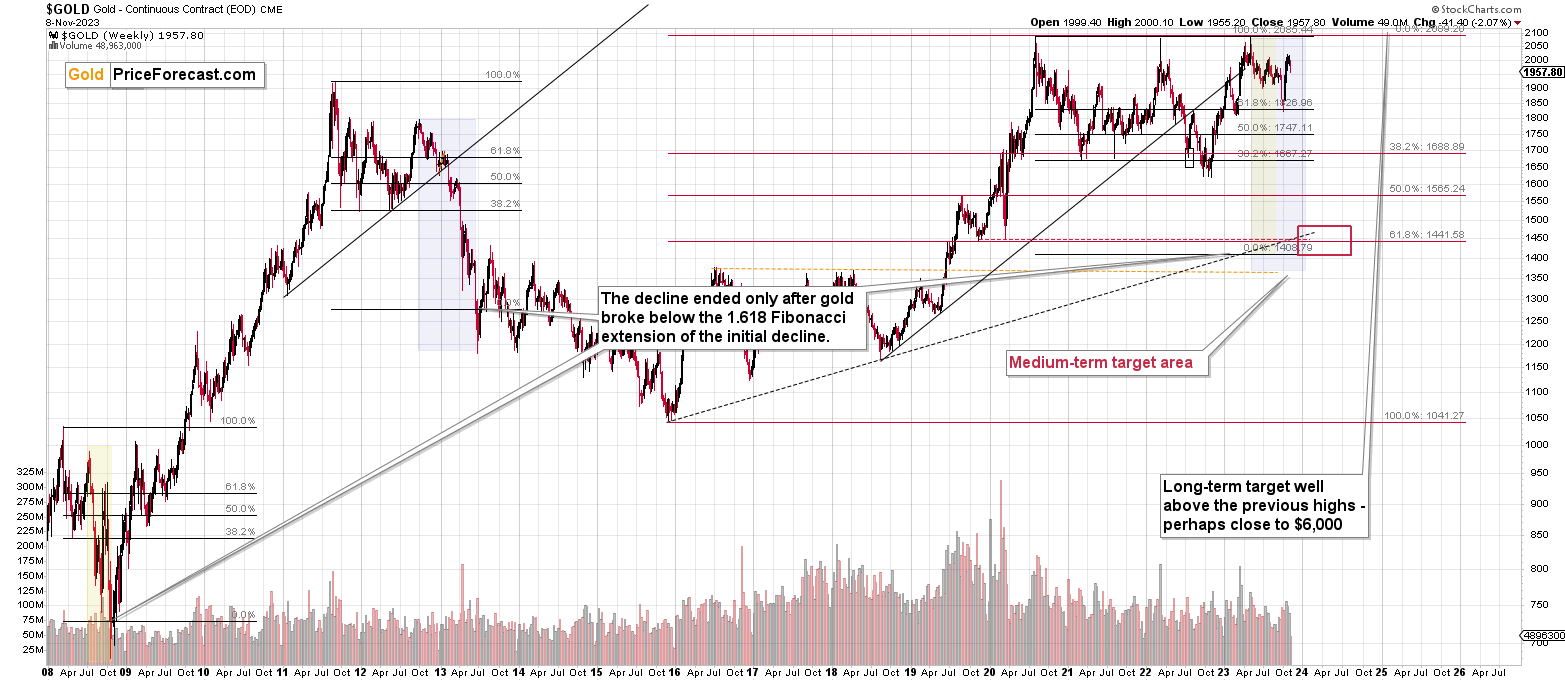
Please note that the above timing details are relatively broad and “for general overview only” – so that you know more or less what I think and how volatile I think the moves are likely to be – on an approximate basis. These time targets are not binding nor clear enough for me to think that they should be used for purchasing options, warrants, or similar instruments.
Letters to the Editor
Please post your questions in the comments feed below the articles if they are about issues raised within the article (or in the recent issues). If they are about other, more universal matters, I encourage you to use the Ask the Community space (I’m also part of the community) so that more people can contribute to the reply and enjoy the answers. Of course, let’s keep the target-related discussions in the premium space (where you’re reading this).
Summary
To summarize, the medium-term trend in the precious metals sector remains clearly down, and it seems that the corrective upswing is already over and the profits on our current short position are going to increase. We just caught the 11th profitable trade in a row – congratulations. The outlook for the short positions in junior miners and in the FCX remains very favorable.
===
Finally, since 11th profitable trade in a row is such a great piece of news (and the same goes for the fact that the current short position is already profitable), here’s… Even more great news! The possibility to extend your subscription for up to three years (at least by one year) with a 20% discount from the current prices is still open.
Locking in those is a great idea not only because it’s perfect time to be ready for what’s next in the precious metals market, but also because the inflation might persist longer than expected and prices of everything (including our subscriptions) are going to go up in the future as well. Please reach out to our support – they will be happy to assist you and make sure that your subscription days are properly extended at those promotional terms. So, for how many years would you like to lock-in your subscription?
To summarize:
Short-term outlook for the precious metals sector (our opinion on the next 1-6 weeks): Bearish
Medium-term outlook for the precious metals sector (our opinion for the period between 1.5 and 6 months): Bearish initially, then possibly Bullish
Long-term outlook for the precious metals sector (our opinion for the period between 6 and 24 months from now): Bullish
Very long-term outlook for the precious metals sector (our opinion for the period starting 2 years from now): Bullish
As a reminder, Gold Investment Updates are posted approximately once per week. We are usually posting them on Monday, but we can’t promise that it will be the case each week.
Our preferred ways to invest in and to trade gold along with the reasoning can be found in the how to buy gold section. Additionally, our preferred ETFs and ETNs can be found in our Gold & Silver ETF Ranking.
Moreover, Gold & Silver Trading Alerts are posted before or on each trading day (we usually post them before the opening bell, but we don’t promise doing that each day). If there’s anything urgent, we will send you an additional small alert before posting the main one.
Thank you.
Przemyslaw K. Radomski, CFA
Founder, Editor-in-chief

