

Briefly: gold and the rest of the precious metals market are likely to decline in the next several weeks/months and then start another powerful rally. Gold’s strong bullish reversal/rally despite the USD Index’s continuous strength will likely be the signal confirming that the bottom is in.
Welcome to this week's Gold Investment Update.
Predicated on last week’s price moves, our most recently featured medium-term outlook remains the same as the price moves align with our expectations (and we remain on a streak of 11 realized – unleveraged – trades). On that account, there are parts of the previous analysis that didn’t change at all in the earlier days and are written in italics.
The key event of the recent past is still gold’s profound weekly reversal that we saw two weeks ago, and nothing that happened in the meantime invalidated the enormously bearish implications thereof. While I realize that it’s most difficult to focus on what really happened instead of following the prevailing feeling (it “feels” most bullish close to the tops), I trust that my analysis will help to keep things in the proper perspective.
The notable short-term event of smaller importance is the fact that junior mining declined this week (and the same goes for silver), even though gold hasn’t. This is bearish, as miners often lead gold.
The key fundamental development that happened recently is Fed’s dovish turn, which is I’ll once again start with a quote from the previous analysis about that topic, and I’ll move to the technical details next.
Debunking Rate-Cut Optimism
The recent narrative uplifting stocks and the PMs is the belief that a pivot is bullish. Conversely, pivots are not bullish, and risk assets often crash when they realize why rate cuts are occurring.
Please see below:
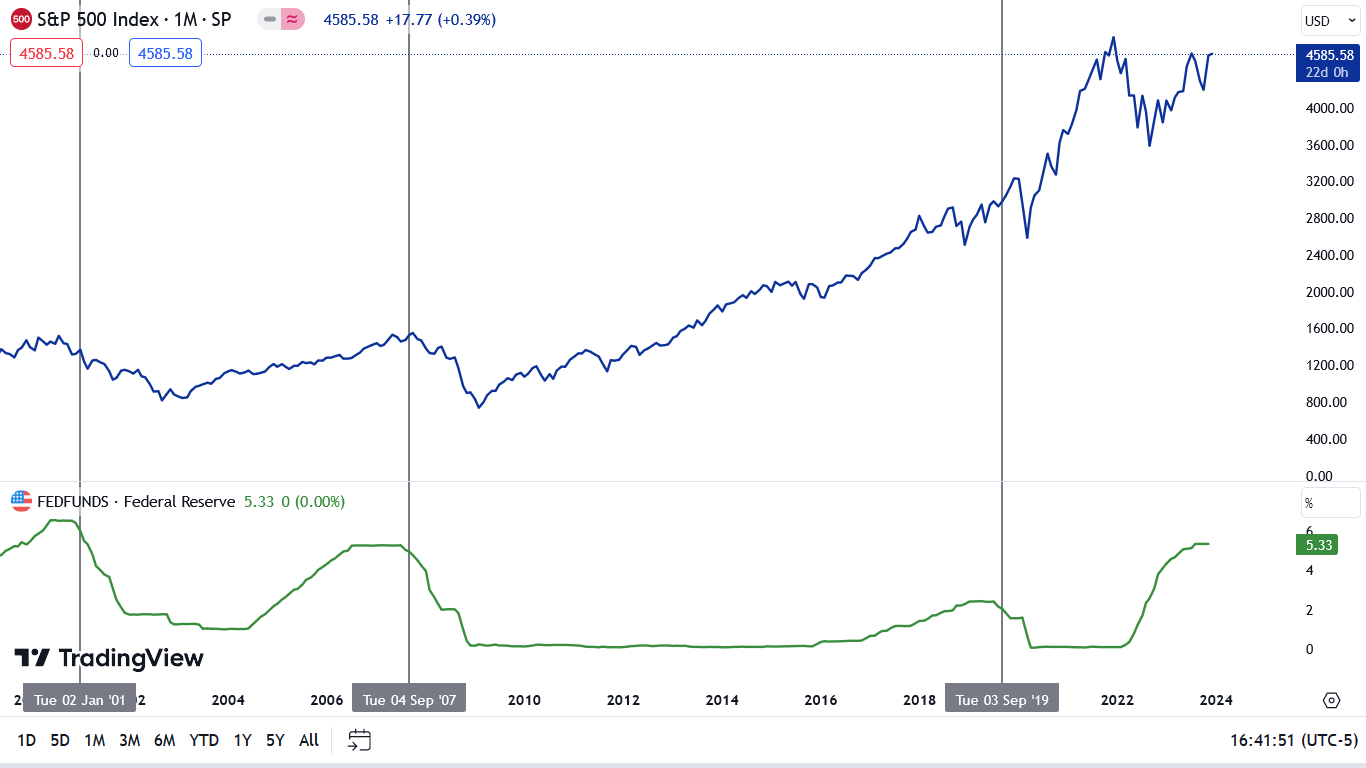
To explain, the blue line above tracks the S&P 500, while the green line tracks the federal funds rate (FFR). If you analyze the horizontal gray lines, you can see that the last three times the Fed cut the FFR, the S&P 500 was already sinking or was approaching a cliff.
Therefore, while it may seem like new highs are inevitable for all assets, the recent optimism is more of a ‘buy the rumor, sell the news’ type trade. In other words, investors will likely bail on the S&P 500 and the GDXJ ETF when the Fed actually cuts rates. To that point, with oil prices resuming their crash, it’s a bad look for global growth when crude oil falls below $70.
Overall, the fundamentals continue to unfold as expected, with higher rates weighing heavily on the U.S. economy. And while the ‘bad news is good news’ trade remains intact, history shows it should end with sharp drawdowns of the S&P 500 and the GDXJ ETF, and a meaningful rise in the USD Index.
Later, I added:
Again, the immediate-term reaction is one thing, as people reacted emotionally to more dovish approach. We also saw an immediate-term rally in 2019, but then a decline materialized, anyway.
So, no, the current move higher doesn’t change the outlook. The big move is still likely to be to the downside. I know that it might be difficult to think so while gold jumped over $30, but this really is the case. Remember how difficult it was to doubt gold’s breakout to new highs? On Dec 4, 2023, I wrote that the breakout is likely to be invalidated and followed by a massive slide. I started that day’s analysis with the following sentence:
“During sharp rallies, it’s nearly impossible to convince investors that this move is about to end. And yet, that’s exactly what is likely.”
That was the top.
And this sentence applies also today. The breakdown below the rising support line in gold was not invalidated and the next big move is likely to be to the downside.
Before I move to gold’s breakdown below its rising support line, it’s consider the key event – the weekly reversal.
I previously wrote about some details coming from the broader perspective and some from the immediate-term analysis, and all that remains true. The recent weekly reversal was so huge that its impact on the next weeks really needs to be kept in mind at all times. It’s not likely that a daily price move in any direction (…) would invalidate the implications of the powerful weekly (!) reversal.
In case that massive reversal seems like a distant memory, here’s a reminder of what happened.
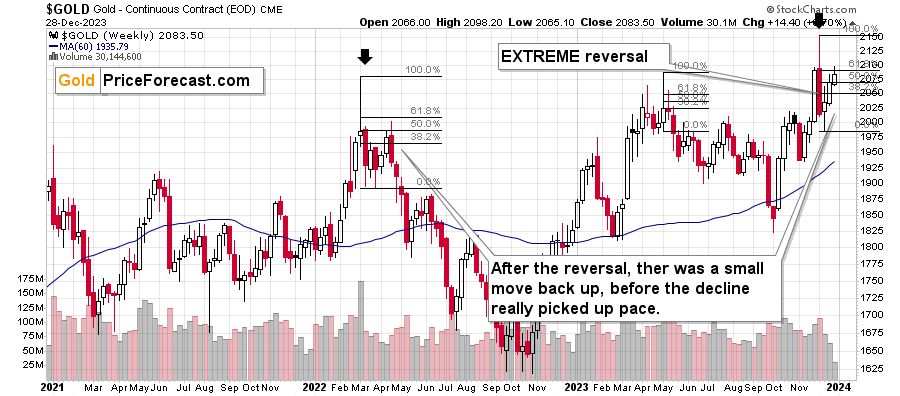
Gold soared above $2,100 only to then plunge to almost $2,000, and in happened on huge volume. This was the most profound weekly reversal in years. It was similar to the reversal that we saw in May 2023 and the one from March 2022, and they both started big declines.
The same is likely this time.
This means that this and last weeks moves higher were just a small rebound before the decline’s continuation.
This is particularly likely given the fact that both previous weekly reversals were followed by some kind of bounce before the decline really picked up pace. In 2022, it took several weeks before the second (lower) top formed and in May 2023 the corrective upswing was over within a week. Right now, we’re 1.5 weeks after the reversal, which means that the decline could start any day now.
Also, please note that in 2022, gold corrected over 50% of the initial decline before finishing the rebound, and in May 2023, gold corrected slightly over 61.8% of the initial decline before moving south. This means that the size of the rally that we just saw is nothing extraordinary. In particular, it doesn’t mean that gold rallied so much that it invalidates the immensely bearish implications of the recent weekly reversal.
Gold recently moved a bit above the 61.8% Fibonacci retracement level, just like it did earlier this year, and – again, just like it did earlier this year – it then moved back below it. Moving back below this retracement meant that the top was in. The same is likely this time.
This is in perfect tune with the previous post-massive-reversal-top price patterns, which means that it doesn’t invalidate them. This is a normal behavior after a gargantuan reversal.
This is in perfect tune with the previous post-massive-reversal-top price patterns, which means that it doesn’t invalidate them. This is a normal behavior after a gargantuan reversal.
Yes, I put the same paragraph twice, and I did it in purpose. If there’s one thing that I want you to remember about the current market situation is this. I’m going to continue to describe what’s happening in other markets, but – given the profoundness and importance of the weekly reversal – the above is enough to make the current outlook for gold (and in consequence for silver and mining stocks) bearish for the following weeks (and likely months).
Now, keeping this in mind, let’s take a look at gold’s short-term chart.
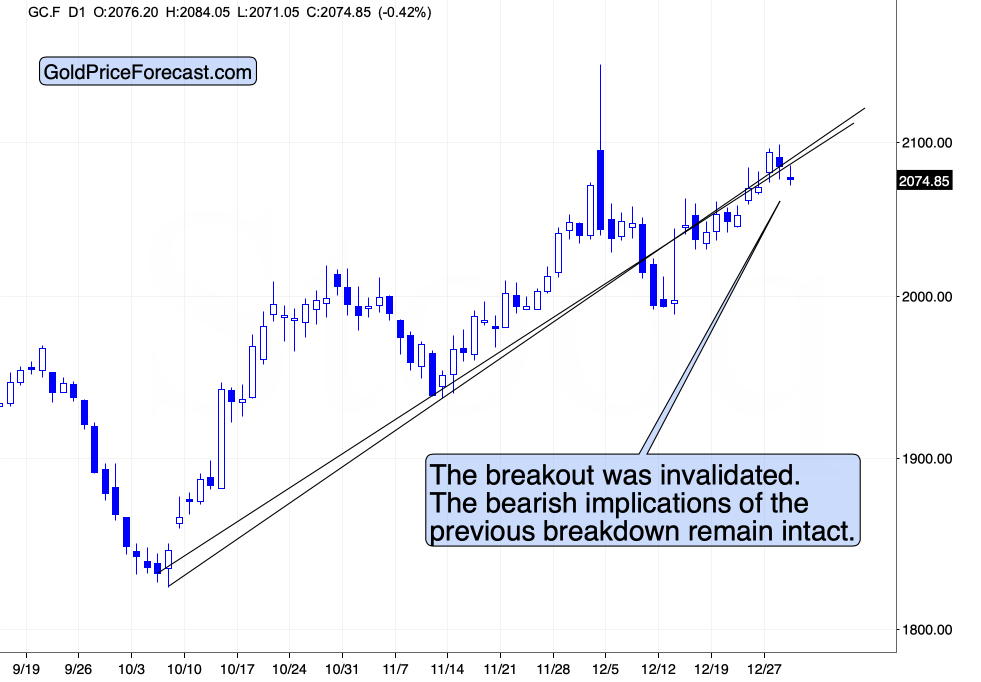
Gold recently broke below its rising support line (which means that it turned into resistance) line in a stealthy manner. Then, even though gold moved a bit higher, it actually verified the breakdown, which was a bearish sign.
Finally, gold tried to move back above the rising resistance line, and it failed. Yesterday’s and today’s declines clearly took gold back below this line, thus flashing another sell signal.
Here’s what the situation looks like from the GLD ETF point of view:
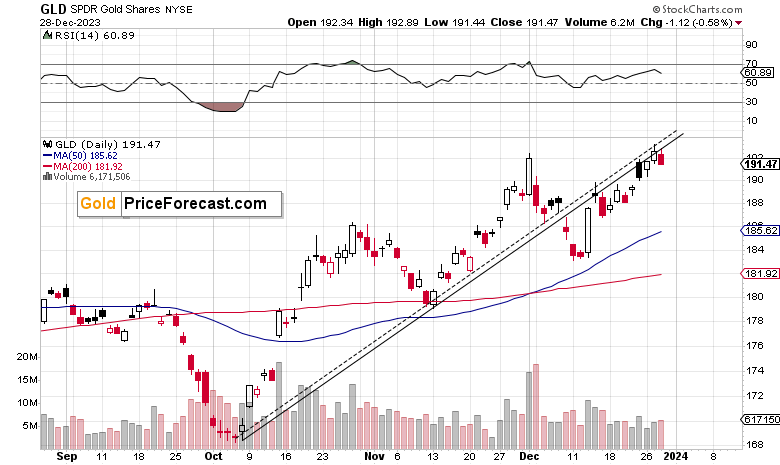
In short, the situation is similar, and the implications are not identical, but even more bearish.
The reason is that from the GLD ETF point of view, gold didn’t just fail to rally back above the rising resistance line. It also tried to move to new highs, and it failed to do so, by closing back below them yesterday.
This is in perfect tune with gold’s previous weekly reversal.
Yes, I know that I’ve been writing about the weekly reversal multiple times already, but I really want you to keep it in mind. If I gave it just as much attention within the text as to many other signals, many subscribers might think that they are similarly important, and this couldn’t be further from the truth. Just because there are some news releases or signals from some indicators every day, doesn’t make any of them important. And gold price’s weekly reversal is not just an event, it’s THE event.
While the gold price has been correcting (nothing more!) after the profound reversal, the USD Index moved much lower.
As gold futures are not testing their recent highs, gold is not fully reacting to USD’s weakness, which is bearish for the former.
And since the latter is not likely to decline much from here, it seems that gold will get a bearish push from USD’s rebound any day now.
Why wouldn’t the USD Index want to decline from here?
My yesterday’s comments provide a reply to this question:
Moving on to the trigger and to the main part of today’s analysis – let’s take a look at the USD Index.
I mentioned both in one sentence, because the trigger for the precious metals market is likely to come from the USD Index (and from the general stock market, but I’ll write more about that tomorrow).
In fact, this trigger is almost already here. Let’s check the facts:
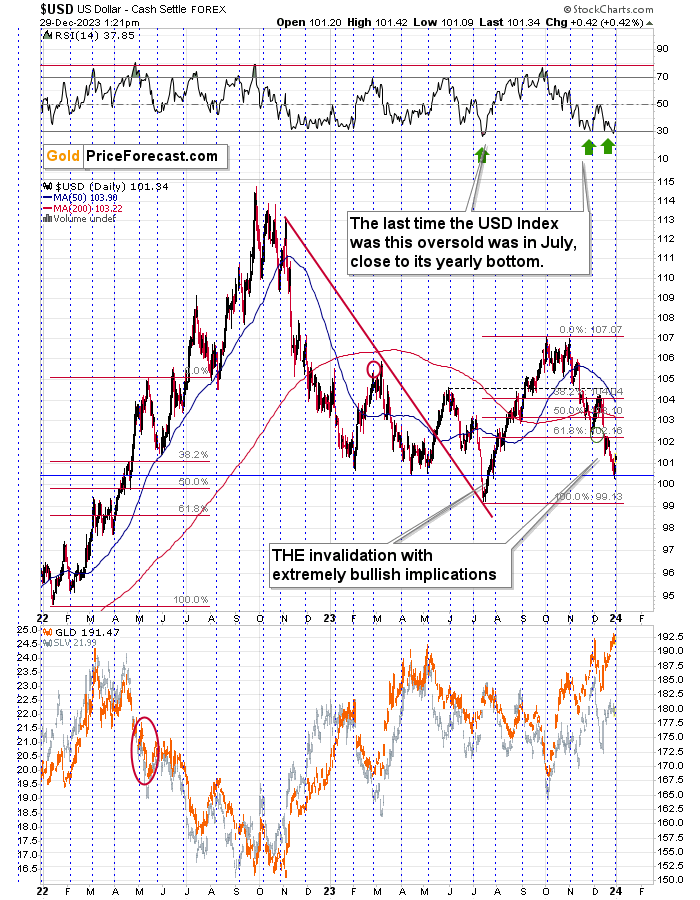
- The USD Index is after a sizable, short-term decline, which caused it to be very oversold in RSI terms.
- The last two times, when the RSI was similarly oversold, immediately preceded bottoms and rallies (including the yearly bottom).
- The USD Index is slightly above the all-important 100 level, which serves as a strong support due to psychological reasons (everyone notices it as it’s a perfectly round number).
- The USD Index is at its previous bottoms – each time the USD Index got close to the current levels in 2023, it then bottomed and rallied.
- It’s very close to the turn of the month, and the USD Index has a strong tendency to reverse its course close to those moments (as marked with blue, dashed lines). Since the last move was to the downside, the reversal has bullish implications.
There is one additional clue on the long-term chart.
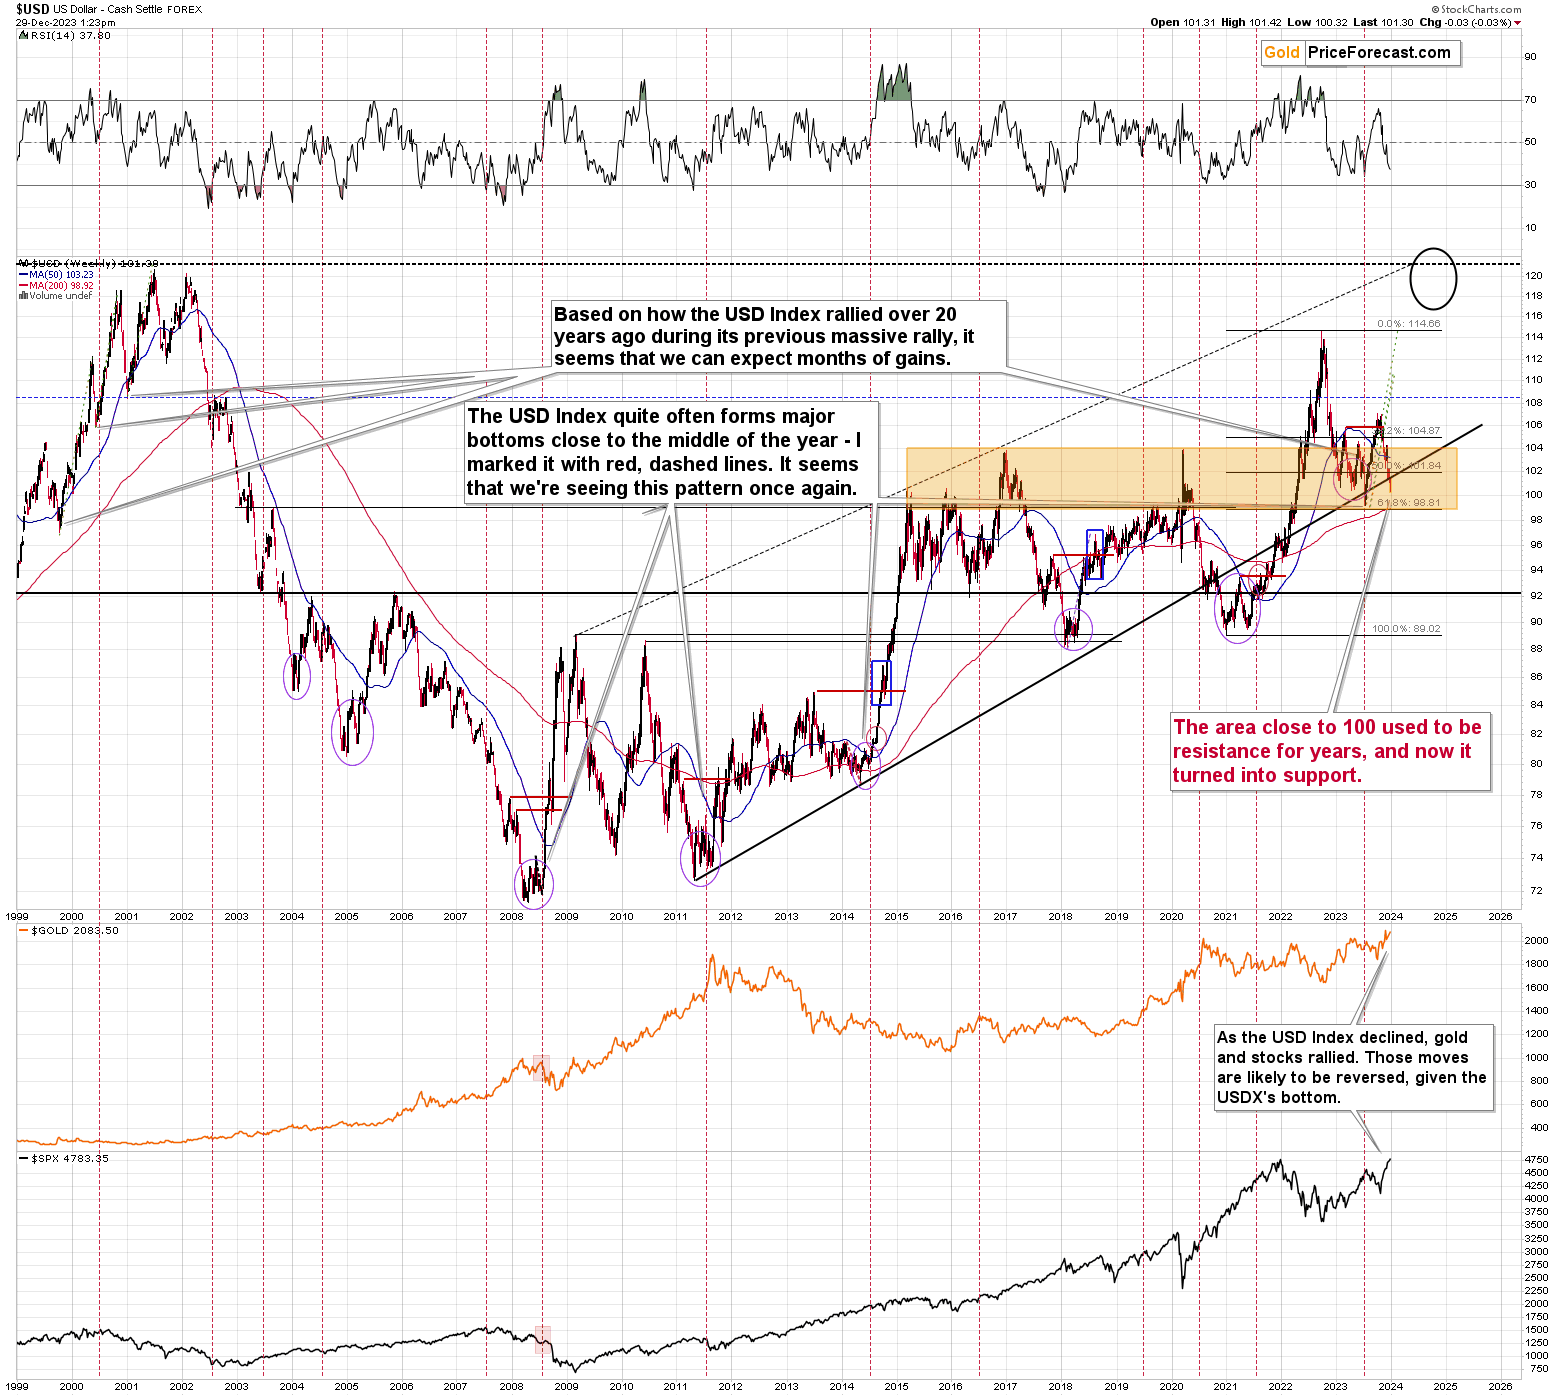
It’s the rising, long-term support line that started in 2011. It was reaching this line that triggered the reversal and caused the yearly bottom to form. Precisely, the USD Index broke slightly below this line, and it was the invalidation of the breakdown that created the bottom.
The USD Index is EXACTLY in the same position right now!
Due to all points listed below the USD Index’s short-term chart, the U.S. currency is very likely to rally at least in the short run. This, in turn, means that it would invalidate the breakdown below the rising, long-term resistance line, just like it did at the 2023 bottom, thus flashing a similar, long-term buy signal.
This is a profoundly bullish combination, even though it might be difficult to view it as such, when focusing on the last few days’ performance.
Since gold is now willing to decline even while the USDX is moving lower… Gold is likely to truly plunge (and the same goes for other commodities, like natural gas) when the USD Index finally rallies. And it looks like both are about to take place.
Here’s what the USDX did yesterday:
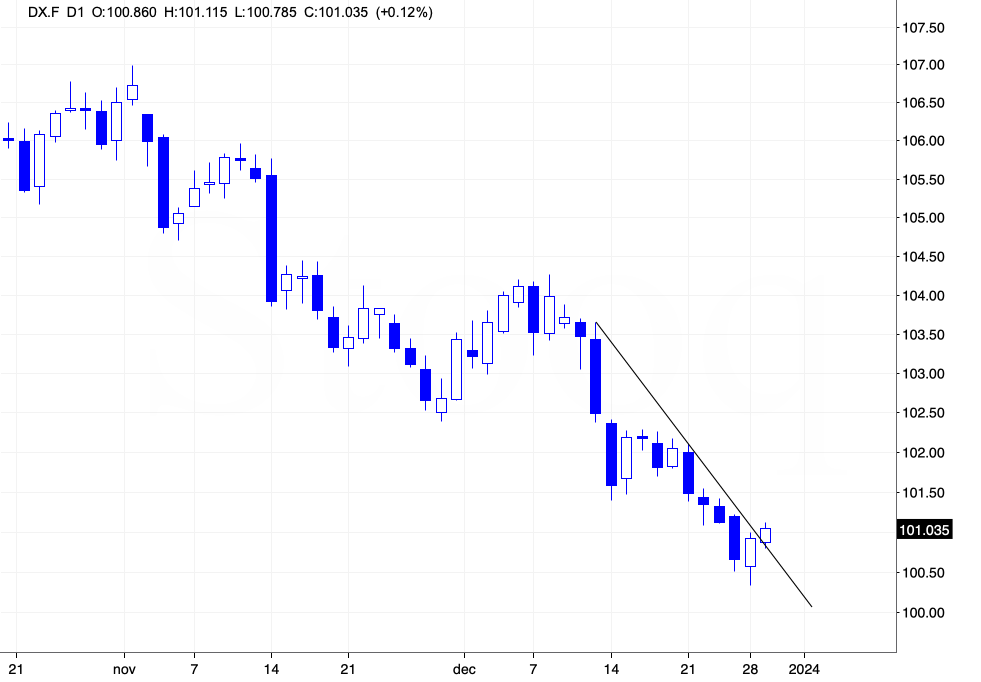
It not only reversed its course, but it broke above its very short-term, rising resistance line. Both serve as perfect confirmations of the bullish set-up that I described above.
Also, USD Index’s biggest component, the EUR/USD formed a bearish pattern, suggesting a quick reversal.
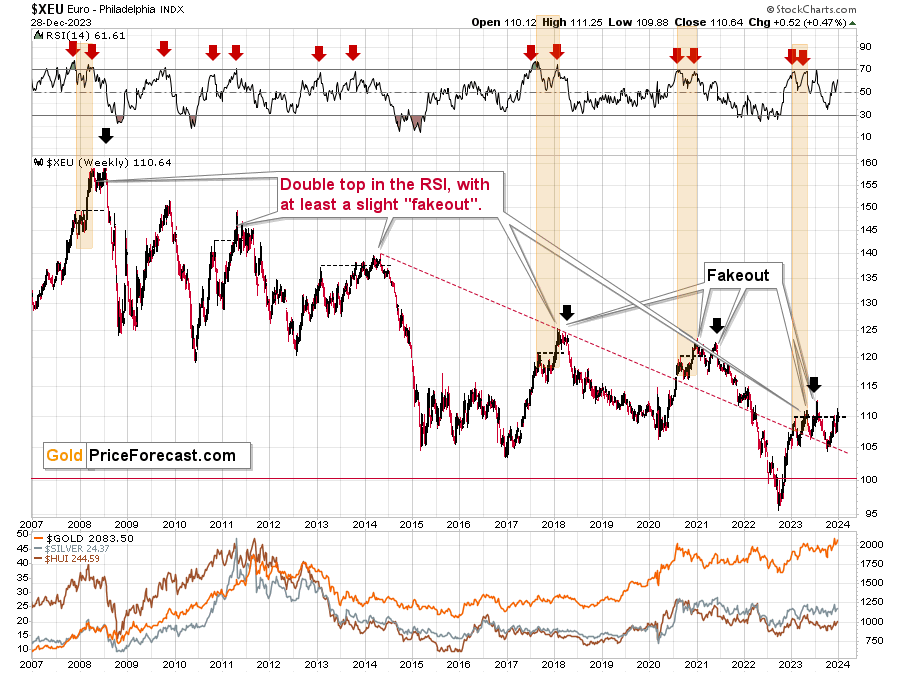
The European currency moved once again to its early-2023 top, thus likely creating a multi-top pattern. This has been a common way for the EUR/USD to top and I marked the previous cases on the above chart.
In 2008 and in 2011 there were sharp, final comebacks to this level before the decline continued. The one in 2014 was small, but it was still there, and the same goes for the one seen in 2021.
What might see chaotic or a game-changer from the short-term point of view, often becomes normal and orderly when looked at from a bigger perspective.
The situation in copper also confirms that a turnaround is here or just around the corner.
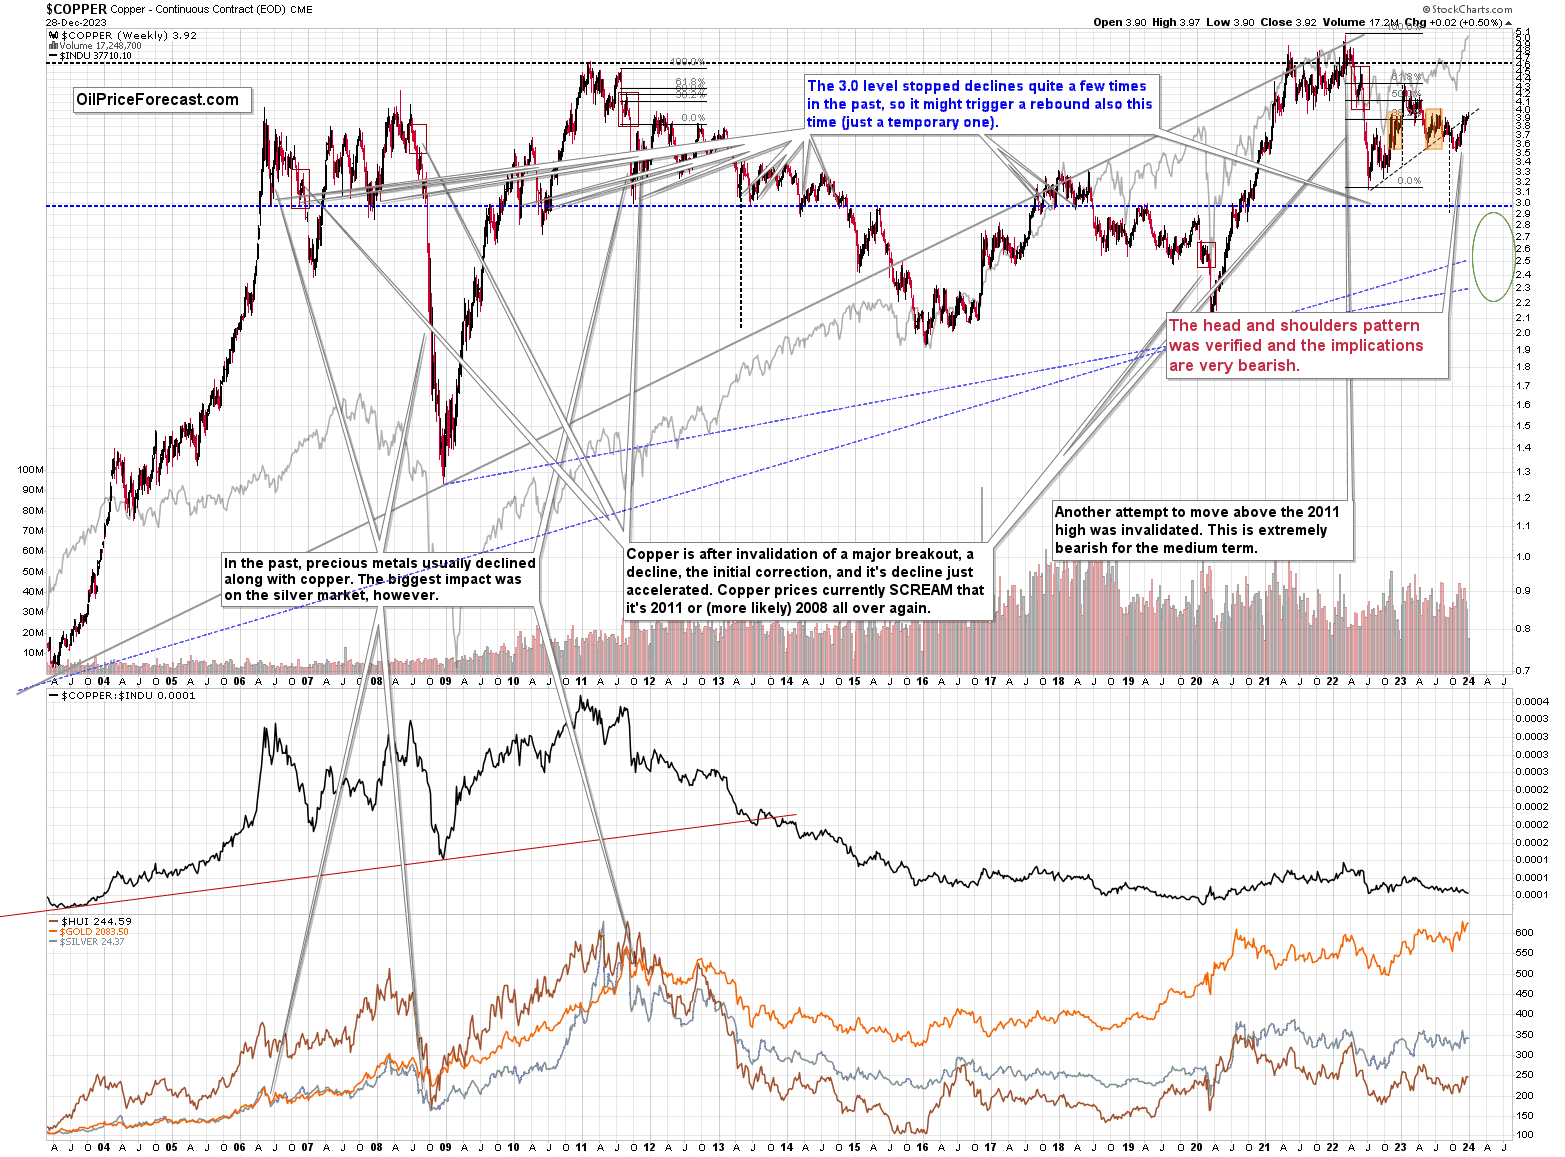
The recent rally was quite sharp, but it took copper back to its rising resistance line, which is also the neck level of the head-and-shoulders formation. A decline from here would be a natural consequence of the verification of the breakdown. The target based on the head-and-shoulders formation is below 3.0, and that’s where copper is likely heading, at least initially.
The short-term picture for copper is also bearish, and you’ll find details below in the quote from today’s Oil Trading Alert (while there’s just “Oil” in the name of the service, it covers many commodities like natural gas and copper as well as individual oil stocks):
===
Copper - The Current Overview
Let’s start todays analyze with the medium-term chart.
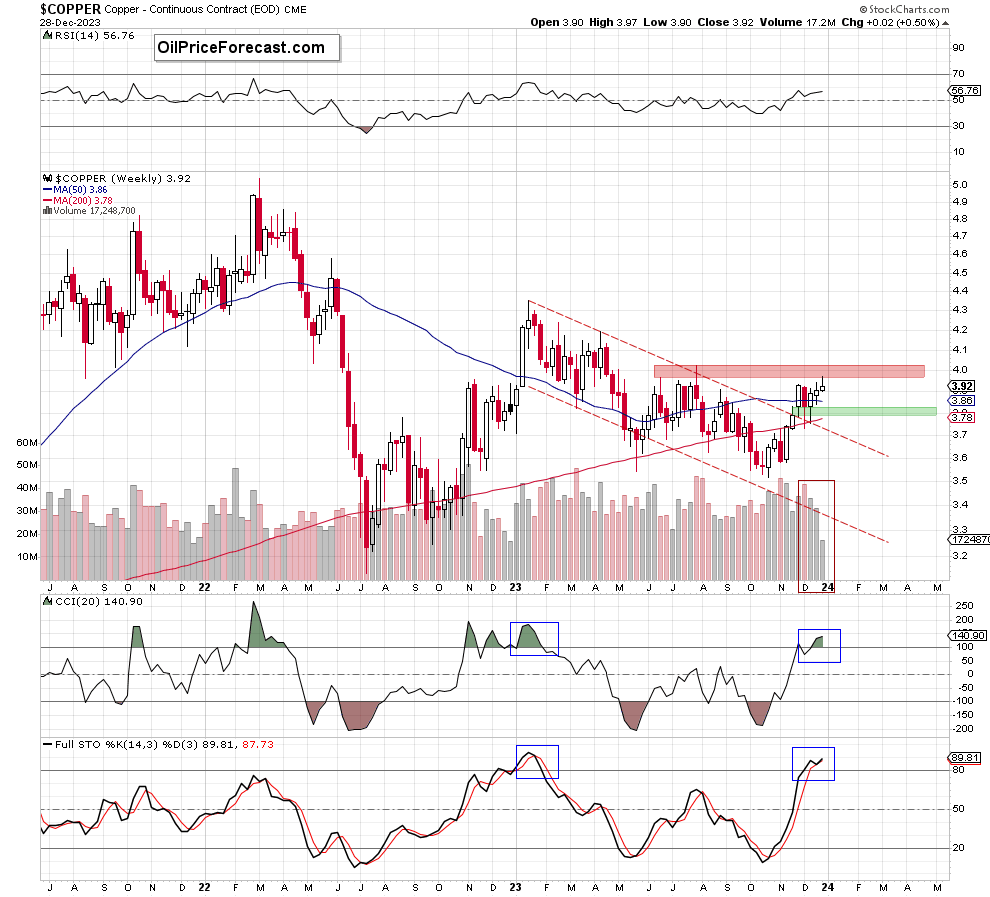
Looking at the weekly chart, we see that after many weeks in the down trend the bulls managed to push the price of copper not only above the previously broken 200-week moving average, but also above the upper line of the red declining trend channel (marked with dashed lines), which opened the way to higher levels.
As you see, the price jumped above the channel at the end of November, creating a green gap (3.789-3.829), which encouraged the buyers to go even higher. Thanks to their action copper climbed not only above the 50-week moving average, but also above the Aug. 28 peak of 3.909). Despite these positive signs, the bulls didn’t manage to hold gained levels, which triggered a pullback, which took the price to the previously broken upper line of the channel.
In this way, copper verified the earlier breakout (not only above the channel, but also above the 200-eweek moving average), which in combination with the strength of the green gap encouraged the bulls to come back on the trading floor.
As a result, the price extended earlier upward move and climbed to a fresh multi-month high of 3.974 earlier this week, but will we see further improvement?
If we take a closer look at this chart, we can see a couple of worrying factors that could interfere with the bulls' pro-growth plans.
What do I mean?
Firstly, copper moved to the resistance area created by the June and July peaks (3.967-4.024).
Secondly, the volume which accompanied recent increases was falling week by week, which definitely doesn't confirm the strength of the bulls.
Thirdly, the CCI and the Stochastic Oscillator moved to their overbought areas, increasing the probability of sell signals in the coming week(s). Although this is not yet a very negative sign, we must remember that such high readings of indicators we could observe at the beginning of this year. What happened then? In the same month, a multi-month correction of previous increases began, which raises the risk that we may see a similar situation at the beginning of next year (as history likes to repeat itself).
Will the short-term chart bring the bulls better news and allies to support them as they continue their march north? Let’ examine the daily chart to find out.
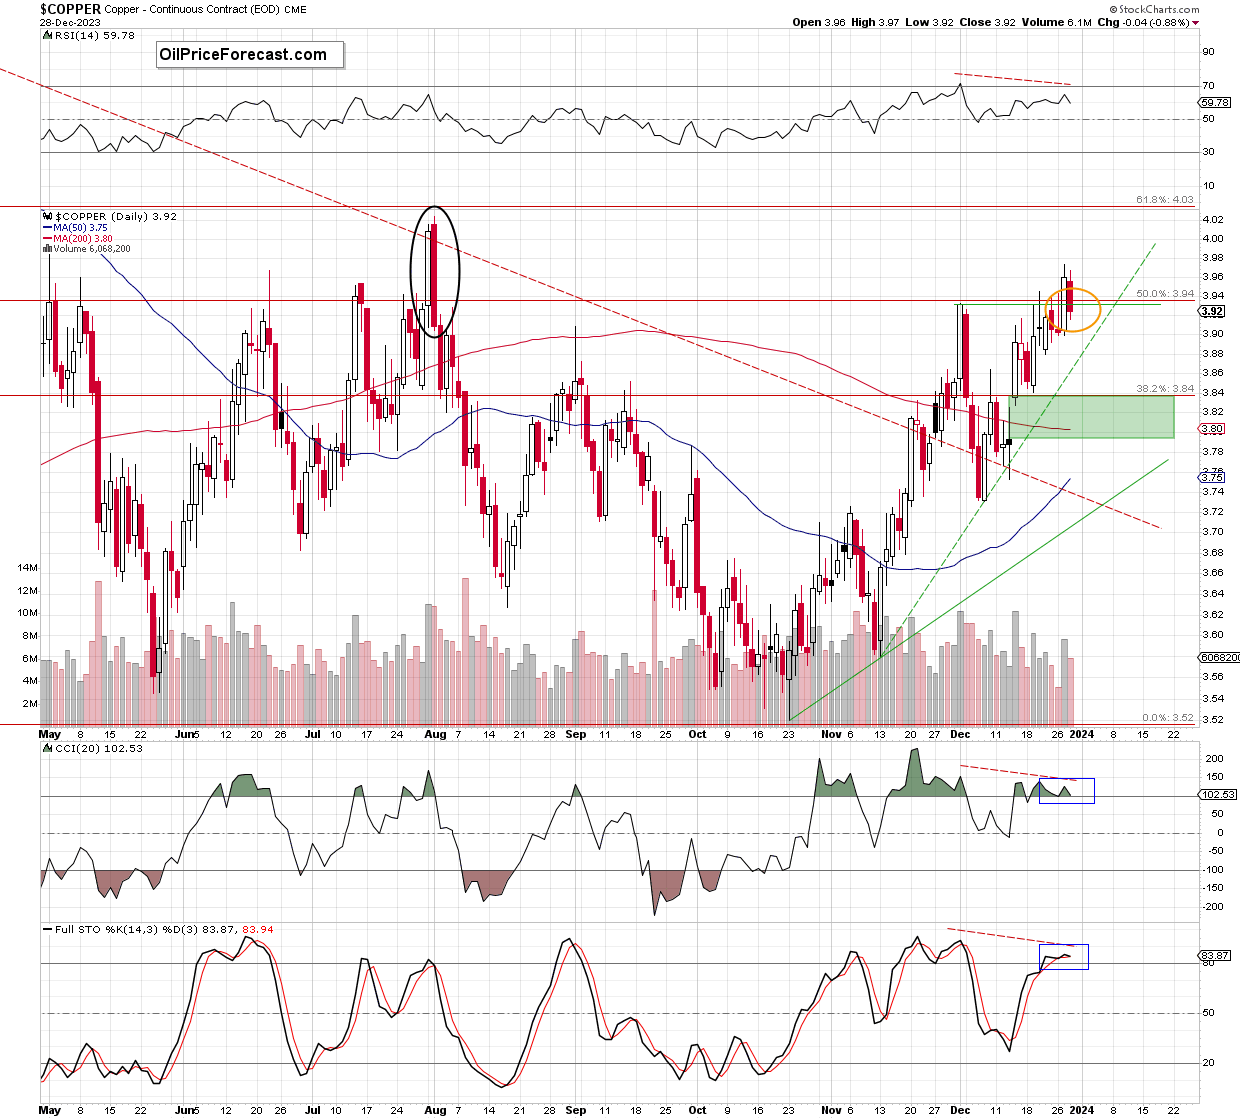
The first thing that catches my eye on the above chart is an invalidation of the earlier breakout above the Dec. 1st peak of 3.933 and the 50% Fibonacci retracement (based on the entire earlier downward move started at the beginning of the year) during yesterday’s session, which doesn’t bode well for further improvement.
Additionally, copper moved to the area of a huge bearish engulfing candlestick pattern formed on Aug. 1st (marked with the black eclipse), which serves as very important resistance (and reinforces the strength of the 61.8% Fibonacci retracement).
What does it mean?
In my opinion, even if the bulls try to push the price a bit higher from current levels, the combination of these two factors will likely encourage the bears to attack. This scenario is additionally supported by the current situation in the indicators.
As you can see, there are negative divergences between the price and all marked indicators, which increases the probability that reversal may be just around the corner. Additionally, the CCI and the Stochastic Oscillator moved to their overbought areas and the latter indicator generated already a sell signal.
How low could copper go?
In my opinion, the first downside target for the sellers would be the green dashed rising support line (currently at around 3.875), but if it is broken, the bears will likely test Dec. 19 low of 3.841 or even the green gap (3.788-3.835) formed on Dec. 14, which is also reinforced by the major support seen on the weekly chart – the gap (3.789-3.829) formed at the end of the previous month, which was strong enough to stop declines at the beginning of the month.
Summing up, copper invalidated the earlier breakout above the Dec. 1st peak and the 50% Fibonacci retracement, which in combination with the bearish candlestick formation, the current situation in the indicators (not only daily, but also weekly) and the proximity to the strong resistance area (marked on the medium-term chart) suggests that further deterioration and lower prices are just around the corner.
In closing today's Oil Trading Alert, I'd like to wish all readers a great weekend and a Happy New Year!
See you in 2024
===
Naturally, the above would be likely to have a very negative impact on the prices of copper stocks, like FCX.
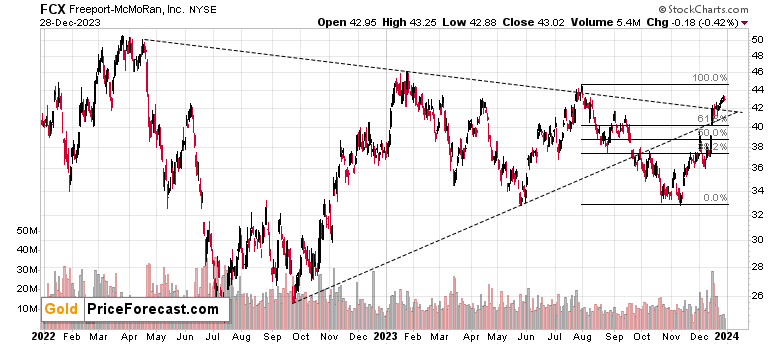
Right now, FCX moved slightly above its declining resistance line based on the April 2022 and January 2023 highs, so it’s a good point from which it could move lower. And since the move higher was sharp, the move back down could be just as sharp, especially that FCX’s move above the rising resistance line was not confirmed (while the previous breakdown was).
In many cases, a breakout above a resistance line would be bullish, but FCX broke above this line only to top there in August, the current implications are not bullish.
Besides, please note that the triangle-vertex-based reversal (the point where both dashed lines cross) is just several days away, so the price is likely to top any day now.
Since the price target for copper is well below its current price, FCX is likely to fall far from the current levels as well.
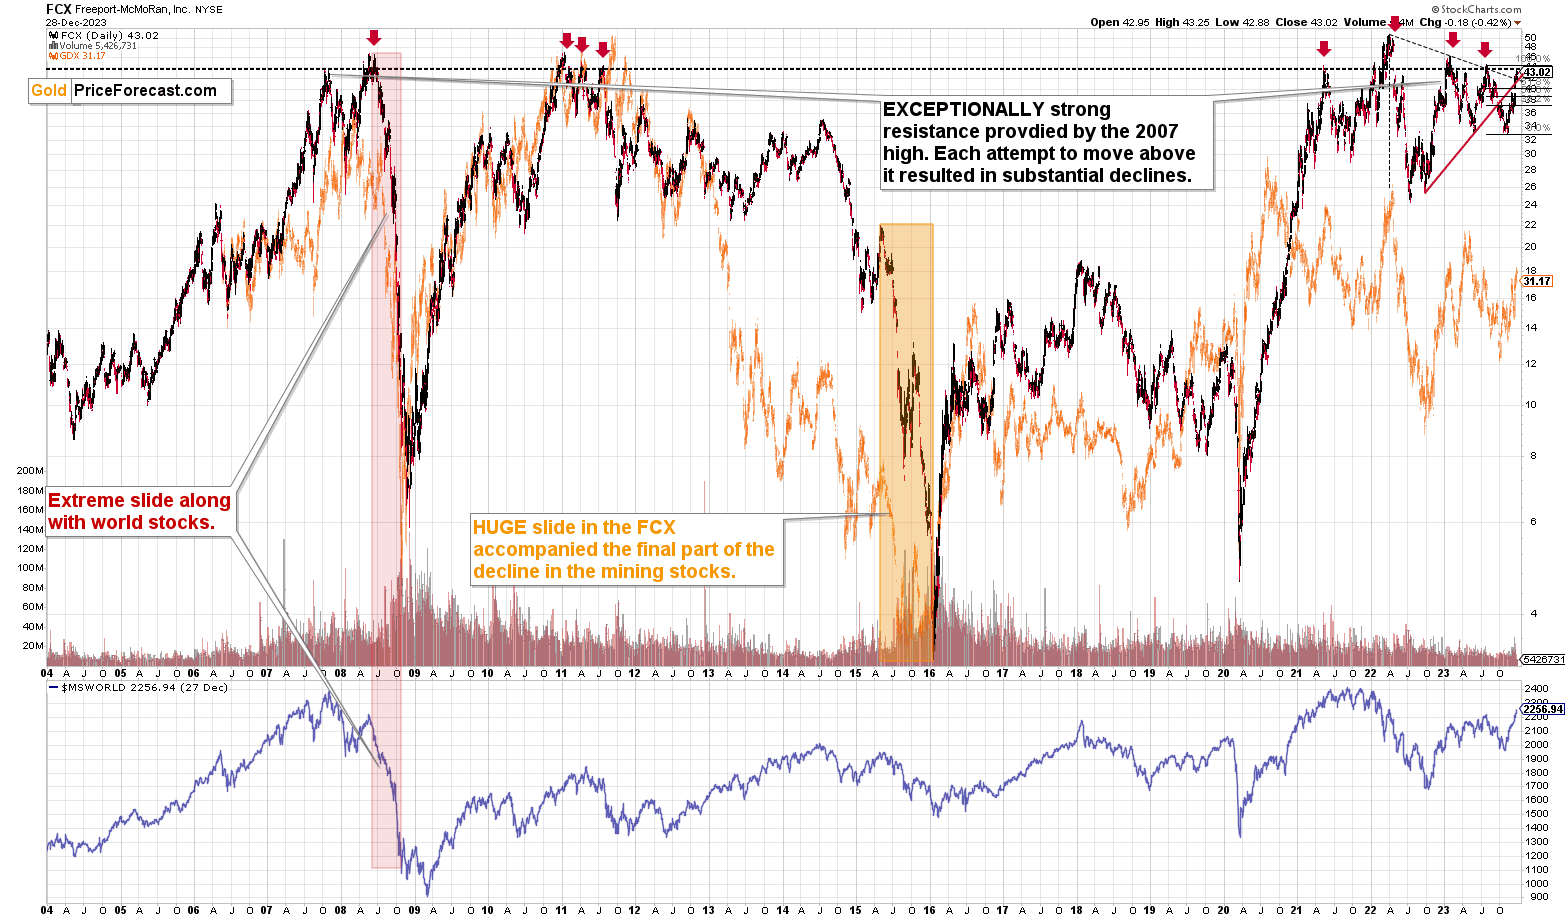
The declines from the current levels after failed breakouts above the 2007 high were big, and in some cases (in 2008) they were enormous. The downside potential is waaaay bigger than what you can see on FCX’s short-term chart.
Speaking of breakout that are not necessarily bullish, let’s take a look at silver.
Last week I wrote the following:
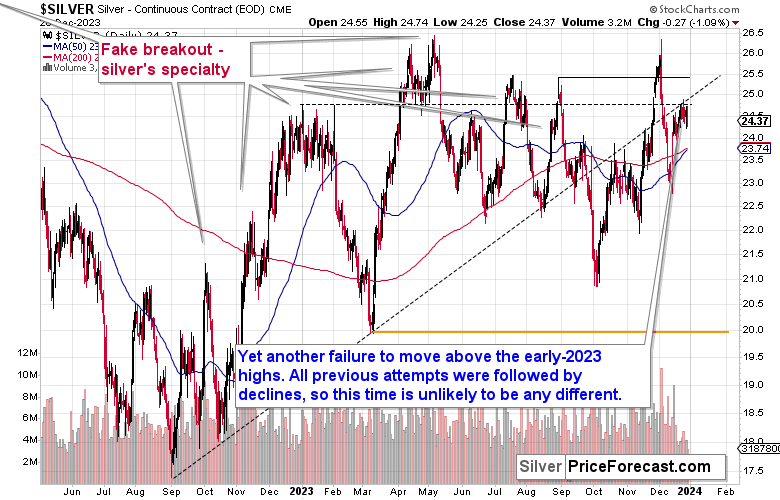
The white metal recently touched its early 2023 highs, and in today’s pre-market trading it even moved slightly above it (the overnight high is $24.84 at the moment of writing these words).
Many traders would consider a breakout in silver as something very bullish. It would probably be the same “many traders” that then get caught by surprise when silver reverses right when it “shouldn’t”. The white metal is behaving very specifically, and it’s a very difficult market for beginning traders.
One of the reasons is silver’s tendency to invalidated breakouts. Each breakout above the early-2023 highs was invalidated and followed by substantial declines. The current tiny attempt to move above it is unlikely to be any different. Consequently, the implications of silver’s overnight move higher are not bullish, but bearish.
Indeed, silver topped at its early 2023 highs, and at the moment of writing these words silver futures are trading at $23.82, which means that the tiny breakout above the early 2023 highs was clearly invalidated.
Besides, please note that the recent back-and-forth movement in silver is similar to what silver did in late 2012 and early 2013.
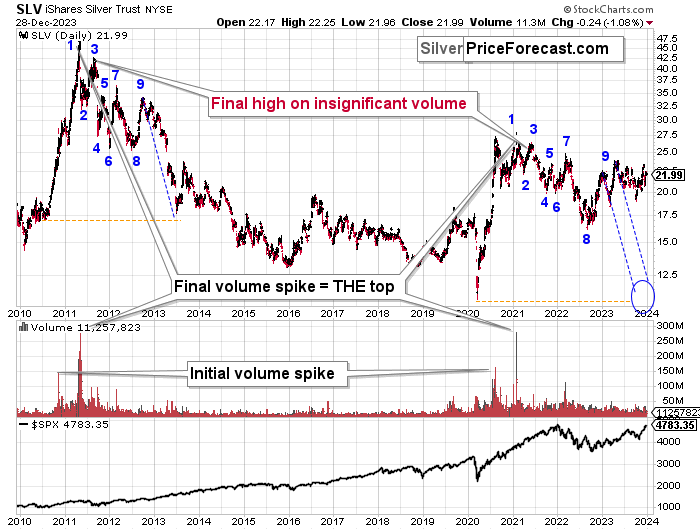
The final tops (2011, 2021) formed on huge volume, and that was preceded by an initial volume spike. Then the SLV ETF declined in a back-and-forth manner, where we saw 9 bigger highs and lows. Then, after the final (9) top, silver declined in a back-and-forth manner in a smaller range.
We see the same thing right now. The current price movement is what preceded one of the biggest declines in silver’s recent history, so it’s difficult to view the recent performance as something bullish.
The analogy to 2011-2013 had very bearish implications for the following weeks and months, so the implications here are bearish, not bullish.
Meanwhile, junior mining stocks are down this week and they declined quite profoundly yesterday.
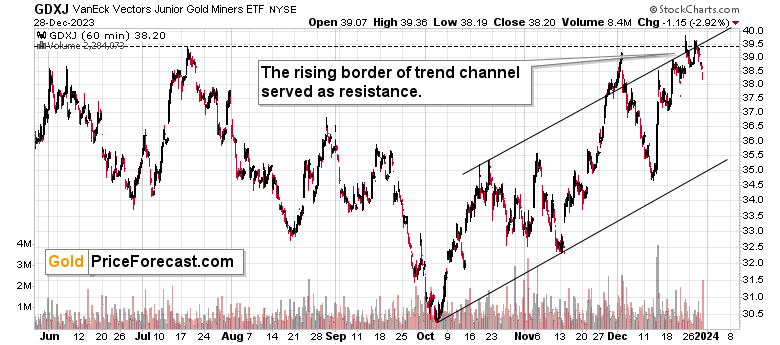
On the above hourly candlestick chart, you can see that the GDXJ moved clearly below the most recent low, and also back below the July and early-December highs. This is particularly bearish not only because of the invalidations of the breakouts that it means. It’s particularly bearish, because yesterday’s almost 3% decline in the GDXJ took place along with just a 0.58% decline in the GLD, which means that junior miners underperformed gold to a large extent without gold’s help.
And given gold’s pre-market decline, it’s likely that this is just the start of a bigger move lower, not its end. This is in perfect tune with the way in which the GDXJ used to top in the previous months.
I previously wrote the following:
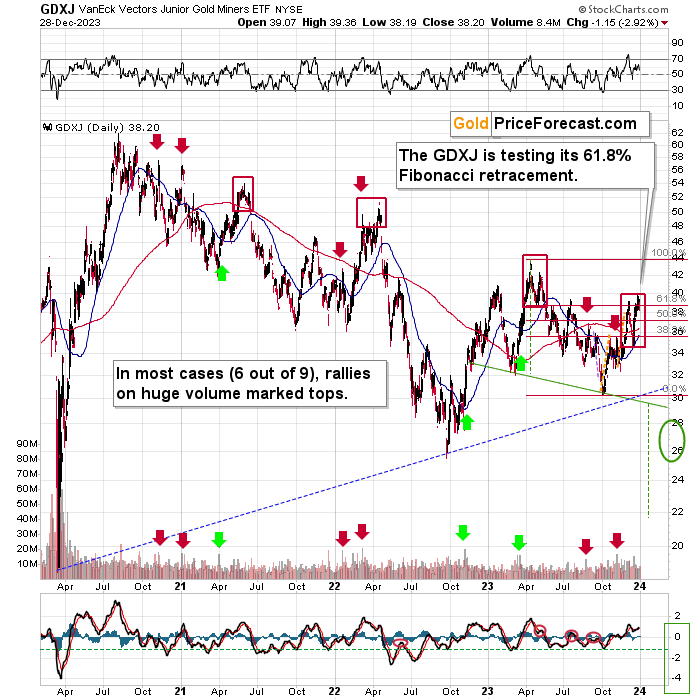
In case of this ETF, the link between big-volume rallies and local tops is not as clear as it is in case of silver, but it’s still present. I marked the similar cases with arrows and in 6 out of 9 such cases, big-volume rallies marked local tops, or those tops followed very soon. Only in 3 out of 9 cases, big rallies followed.
Interestingly, all those three bullish cases were preceded by declines that were much bigger than what we saw recently. This suggests that the bullish analogies are not the correct ones. The bearish ones are.
Moreover, please take a look at the areas that I marked with red rectangles. They mark important tops in the GDXJ ETF. In call those cases, junior miners topped by first declining somewhat, then correcting, and then sliding without looking back. In two out of three cases the second (final) top was below the initial one, and in the remaining case (in early 2022), the second (final) top, was slightly higher than the initial one.
So, is seeing the GDXJ close to the previous top (but still below it) a bullish game-changer? Absolutely not.
All in all, the outlook for the precious metals market remains strongly bearish and the potential for our current trading positions in junior mining stocks remains enormous.
What’s next? While the next 1-3 days are a bit unclear, the entire roadmap that I featured for the GDXJ ETF in my previous Gold Trading Alert remains very much up-to-date.
The markets usually don’t move up or down in a straight line, so some kind of correction is likely to take place in the future, anyway. The question is from what price levels.
My best candidate for the first correction (based on the data that I have available right now) is The $30.5 - $32 range, which is based on the previous lows. I don’t expect a huge rally from those levels, though. Perhaps a move from $30.5 to $32, and then the decline would continue.
The next target is more important. After breaking to new 2023 lows, the move to the 2022 low (close to $26) becomes a good possibility – I marked this area with a green ellipse.
Once this level is reached, I then expect the GDXJ to correct in a more visible manner. After all, at that point, it will be after important breakdowns:
- Below the rising blue support line
- Below the previous 2023 low
- Below the green support line
Consequently, a verification of those breakdowns by a move back to them, would be quite normal. This means a move back to $29 - $30. Then, after a successful verification of those breakdowns, I’d expect the GDXJ to slide lower – to the 2020 low or close to them – at about $20.
There’s also a good possibility of seeing a bottom at about $22, as that’s where we have a downside target based on the head-and-shoulders pattern that is most likely being formed right now. It could also be the case that the GDXJ slides to about $20 on an intraday basis only to recover and close the day at about $22. In a way, both targets would be reached in this case.
There are many IFs around the above-mentioned scenario, and the situation might (and it probably will) change as we go. Remaining open-minded and flexible regarding the new information is key, but having a roadmap is very useful, too, as it shows how things could develop on a more-or-less basis. This can help you prepare for those – or similar – price moves.
Meanwhile, the implications coming from many long-term charts continue to favor lower precious metals and mining stock prices in the following months.
For example, the situation in world stocks hasn’t really improved recently.
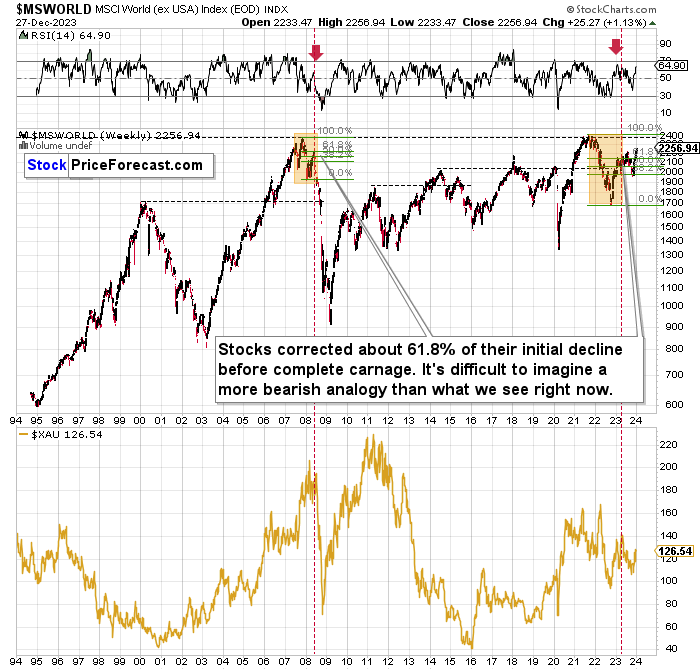
The situation continues to be very similar to what we saw in 2008, with the main difference being that now the initial decline was bigger. Because of that it’s no wonder that the corrective upswing is also bigger and it takes longer.
In both cases, world stocks corrected to approximately the 61.8% Fibonacci retracement, and they declined thereafter. This time, there were two corrections to that level, which is not that odd given that the initial decline was bigger this time.
The implications remain very bearish not just for stocks, but also for mining stocks.
As you can see miners (the XAU Index) suffered enormously in 2008 in the aftermath of the situation that’s so similar to the current one. Let’s take a closer look.
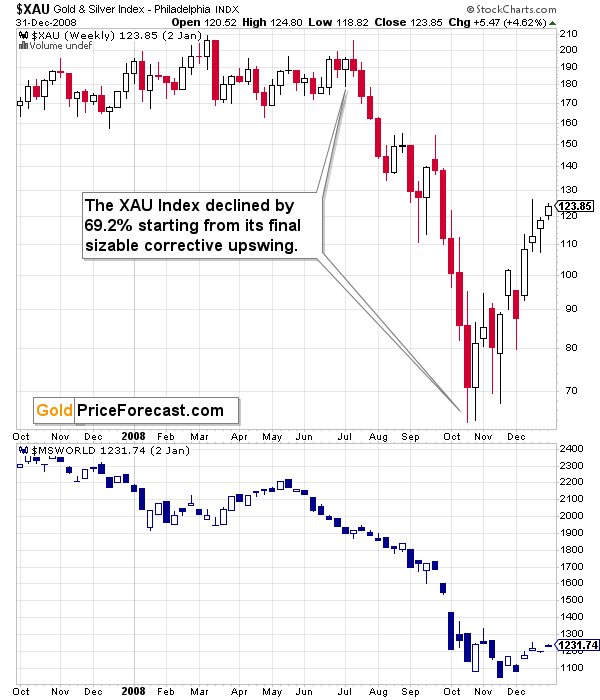
This analogy has very bearish implications for the following months.
And while we’re discussing stock market indices and their long-term charts, let’s not forget about the critical situation in the Toronto Stock Exchange Venture Index – one of the proxies for junior mining stocks.
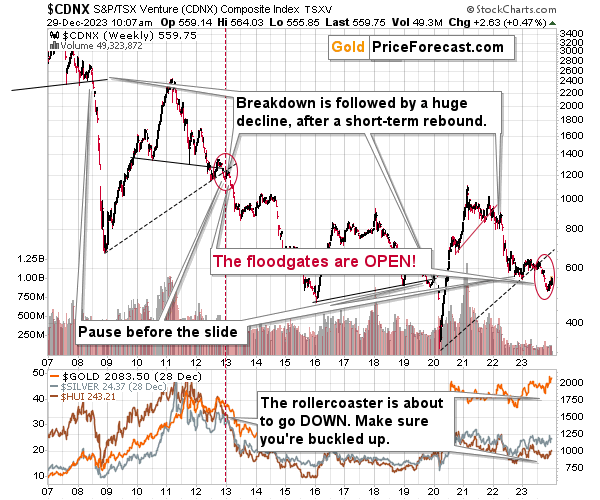
The TSXV is after a massive breakdown below the rising support line, that’s analogous to the one that we saw in early 2013 – and, to a smaller extent, to the one seen in 2008.
Now we see a pause in the decline, but given that the breakdown was already confirmed, the decline is likely to resume after the pause, and it’s likely to put a very bearish pressure on the precious metals and mining stock prices.
Gold stocks to other stocks also clearly show just how important and big the recent “strength” in the mining stocks were.
In short, both are nonexistent. The ratio between the HUI Index (proxy for gold stocks) and the S&P 500 Index (general stock market) is testing its recent lows.
It takes just a little push for the ratio to break below its 2-15, 2018, 2021, and 2022 lows. This is very bearish, because after that breakdown, there’s no significant support all the way down to the 2000 low close to 0.025. This means cutting gold stocks’ prices in half IF the general stock market stays at its current levels, and it means even bigger declines in gold stocks, if other stocks do decline.
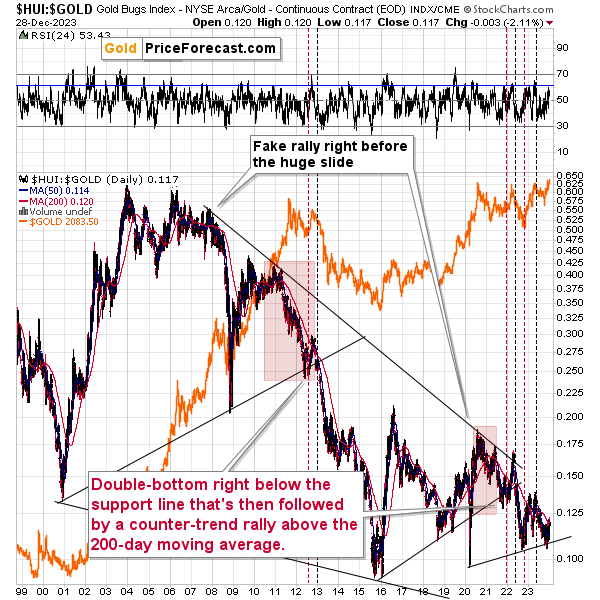
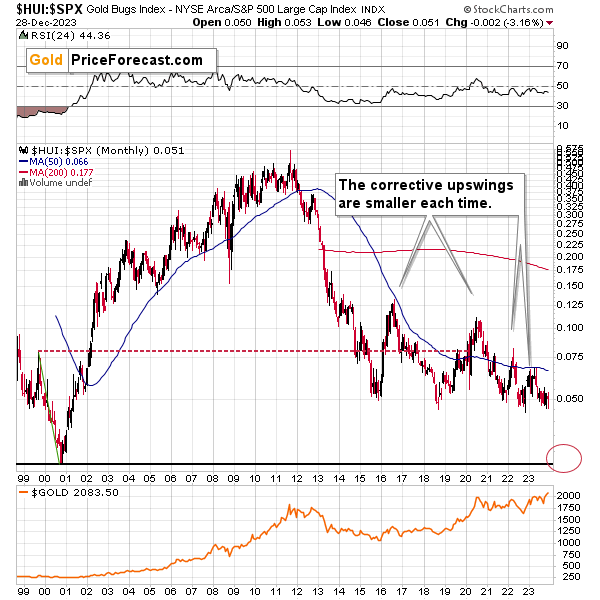
Comparing gold stocks to gold reveals that we saw another small correction within a long-term downtrend. Ever since mid-2021, all attempts to break above the 200-day moving average (marked with red) were followed by invalidations and declines in the precious metals sector.
This is bearish, and the same goes for the fact that corrective upswings were smaller in each time when the ratio moved from about 0.1. The 2016 bottom was followed by a sizable correction, the one from 2020 was smaller, then one that we saw in 2022 was even smaller, and this year’s correction is tiny in comparison.
The implications for the following months are very bearish, as when the ratio finally breaks below the rising support line, it’s likely to decline much lower – as low as the 2016 low or even lower.
Meanwhile, stock market is approaching its all-time high, and while Paul Rejczak remains cautiously bullish, (link leads to today’s analysis by Paul) he’s preparing to take profits from his long position, and I agree that stocks look very toppy here. My previous comments on the S&P 500 Index remain up-to-date:
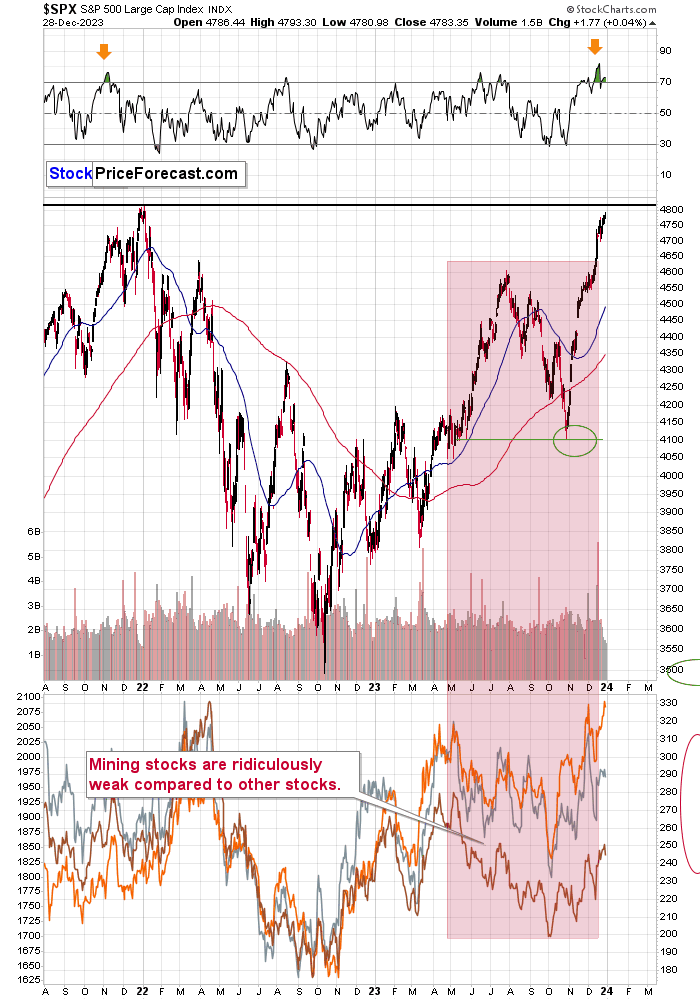
The RSI based on the S&P 500 Index was just extremely overbought – more so than at the 2022 top. Given yesterday’s decline close to the end of the session it seems quite possible that the top is in. And if it’s not, it’s likely that the top is at hand anyway, as the all-time high is unlikely to be taken out given this kind of overbought status of the market.
There are some fake rallies out there in individual stocks as well, including individual oil stocks. This could be viewed as another indication that the entire market is about to turn south.
What does it all mean? It means that the precious metals sector is likely to turn south any day now as… That’s right, you guessed it – the ultra-powerful weekly reversal in gold continues to have very bearish impact on the outlook for gold.
There are more reasons for the situation to change drastically soon, and what I wrote about it previously remains up-to-date:
- So, when will those declines finally take place?
At this time, I wouldn’t be surprised to see them really begin early next year. The reason is that they are quite likely to be correlated with the declines on the general stock market (note: Paul is preparing to take profits from his long positions in stocks), and… Wall Street pros want their yearly bonuses, don’t they?
As the performance is often assessed in yearly terms, and most funds / asset management companies are invested in stocks (and are not shorting them), it’s in their best interest not to see significant slides before the end of the year (three more sessions including today’s one). Once we have the final yearly price, it seems that the prices of stocks can “be allowed to” slide. And the same goes for the prices of precious metals and mining stocks.
(…)
Have you considered buying gold recently? Like to the point of searching for it online?
Because many people have.
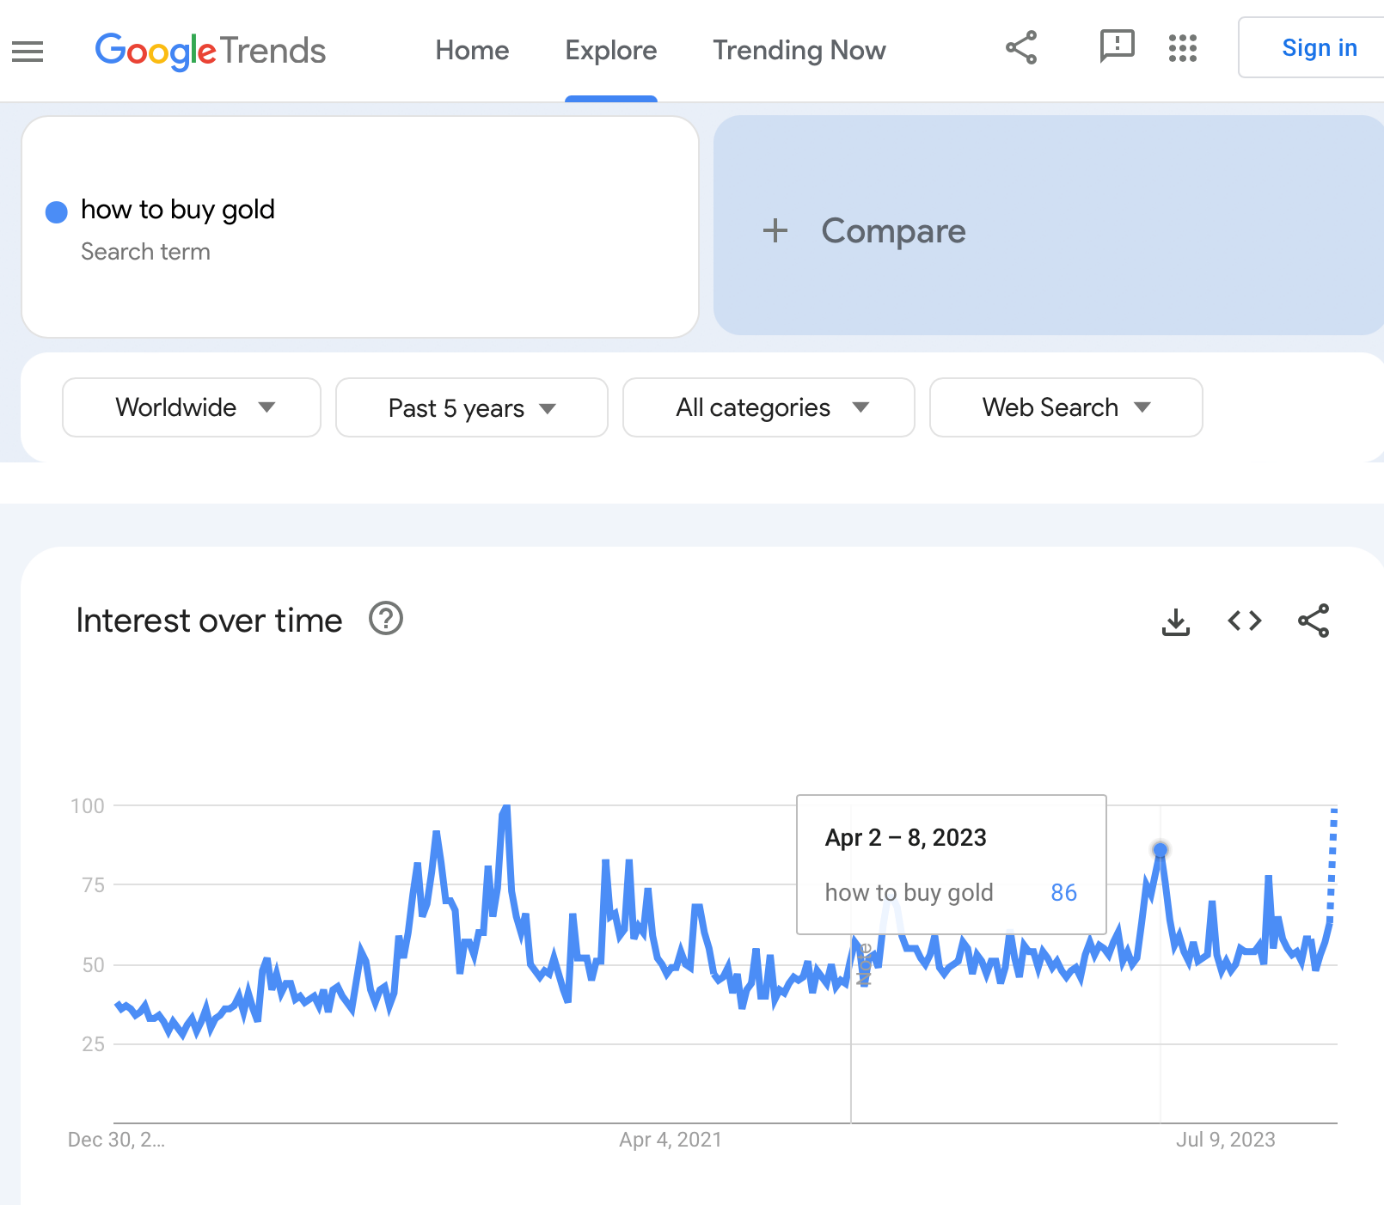
As you can see on the above Google Trends screenshot, the searches for “how to buy gold” just soared, and it’s not the first time that it happened.
Makes one wonder… What happened to gold price in those other cases?
After all, whatever circumstances triggered this jump in the interest in the topic, they are taking place all over again. I don’t mean the state the world is in – I mean the sentiment among gold investors. By estimating the latter, we can also estimate what’s likely to happen to the price, because… The history tends to rhyme, and people’s emotional reactions to what the market is doing remain more or less the same, regardless of the details of the fundamental situation.
I marked one of the moments on the above chart and here are the other notable peaks:
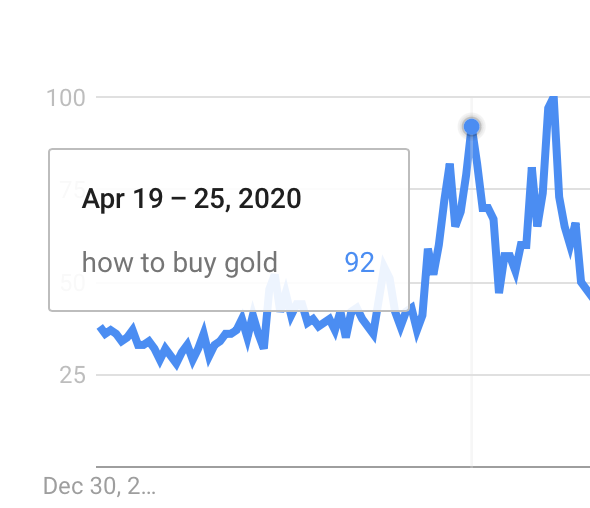
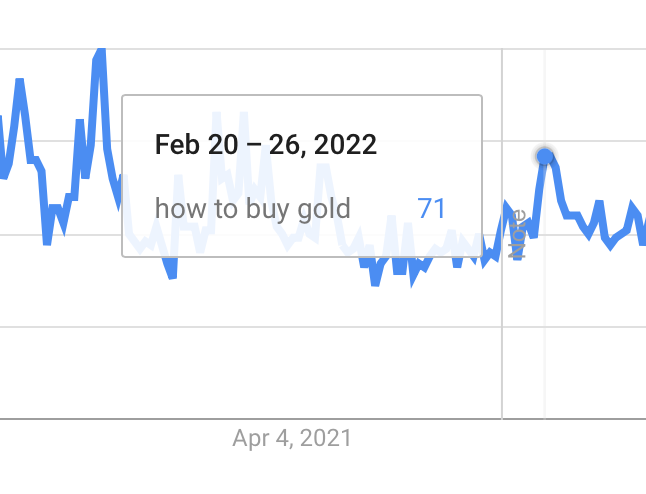
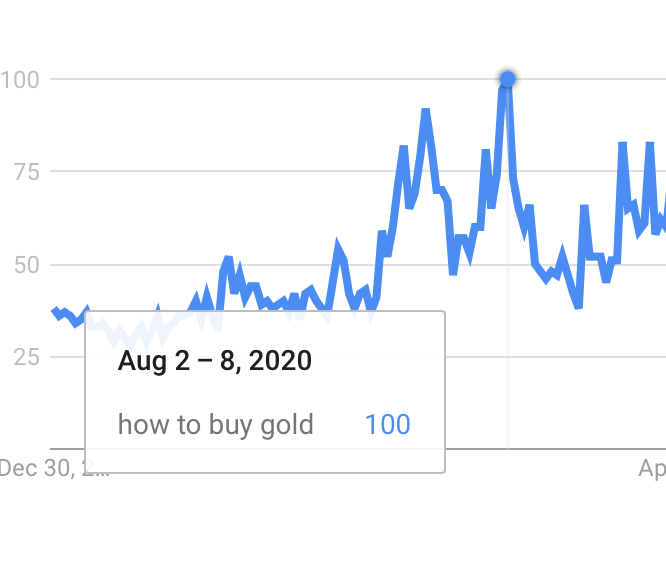
So, what happened to gold price on those occasions?
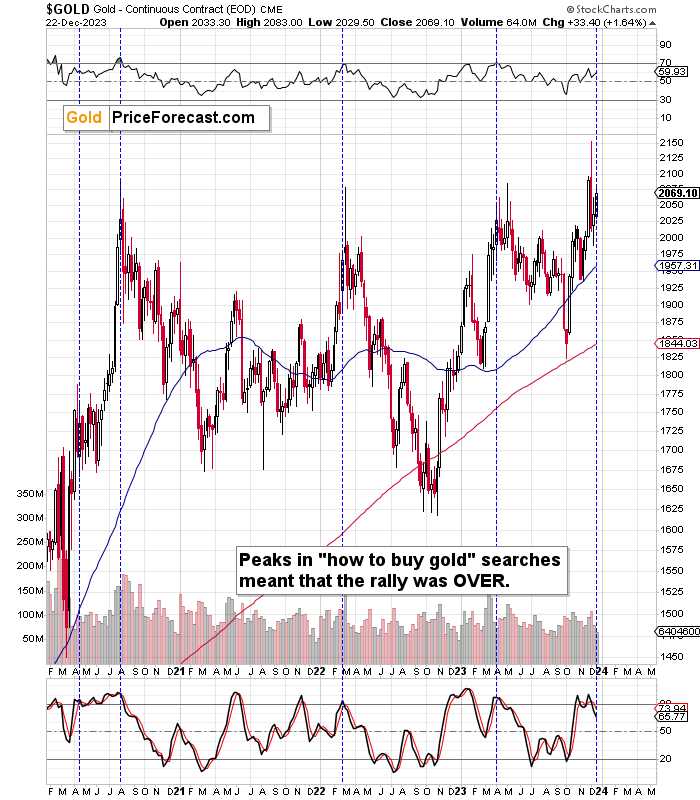
I marked all-above-mentioned cases with blue, dashed lines and in three out of four cases those were the MAJOR tops. Ones that were followed by hundreds-of-dollar declines in the price of gold.
The only remaining case was when it was still the end of a short-term rally and the start of a pause (that took gold about $100 lower, anyway). This time was truly exceptional, though, because it was right after the covid-scare bottom – it was not a regular course of action.
So, I’d say that in all “regular” cases, the huge increase in interest in buying gold translated into huge declines in the following months. After all, people tend to buy at the tops – that’s exactly what this sentiment analysis proves.
We are at this stage one more time (in many other stocks, too, including some oil stocks). Once again, it’s difficult NOT to buy into the euphoria, even though looking at the situation from a broad perspective practically “screams” WATCH OUT.
Now, you are informed, you are prepared.
And I will continue to keep you – my subscribers – up-to-date, so that what surprises most investors, will not surprise you, but that it will benefit you. We’re on a streak of 11 profitable (unleveraged) trades, after all, and it’s VERY likely that the current trades will increase this streak soon.
Again, as always, I’ll keep you – my subscribers – updated.
= = =
If you’d like to become a partner/investor in Golden Meadow, you’ll find more details in the above link.
Overview of the Upcoming Part of the Decline
- It seems that the recent – and probably final – corrective upswing in the precious metals sector is over.
- If we see a situation where miners slide in a meaningful and volatile way while silver doesn’t (it just declines moderately), I plan to – once again – switch from short positions in miners to short positions in silver. At this time, it’s too early to say at what price levels this could take place and if we get this kind of opportunity at all.
- I plan to switch from the short positions in junior mining stocks or silver (whichever I’ll have at that moment) to long positions in junior mining stocks when gold / mining stocks move to their 2020 lows (approximately). While I’m probably not going to write about it at this stage yet, this is when some investors might consider getting back in with their long-term investing capital (or perhaps 1/3 or 1/2 thereof).
- I plan to return to short positions in junior mining stocks after a rebound – and the rebound could take gold from about $1,450 to about $1,550, and it could take the GDXJ from about $20 to about $24. In other words, I’m currently planning to go long when GDXJ is close to $20 (which might take place when gold is close to $1,450), and I’m planning to exit this long position and re-enter the short position once we see a corrective rally to $24 in the GDXJ (which might take place when gold is close to $1,550).
- I plan to exit all remaining short positions once gold shows substantial strength relative to the USD Index while the latter is still rallying. This may be the case with gold prices close to $1,400 and GDXJ close to $15 . This moment (when gold performs very strongly against the rallying USD and miners are strong relative to gold after its substantial decline) is likely to be the best entry point for long-term investments, in my view. This can also happen with gold close to $1,400, but at the moment it’s too early to say with certainty.
- The above is based on the information available today, and it might change in the following days/weeks.
You will find my general overview of the outlook for gold on the chart below:
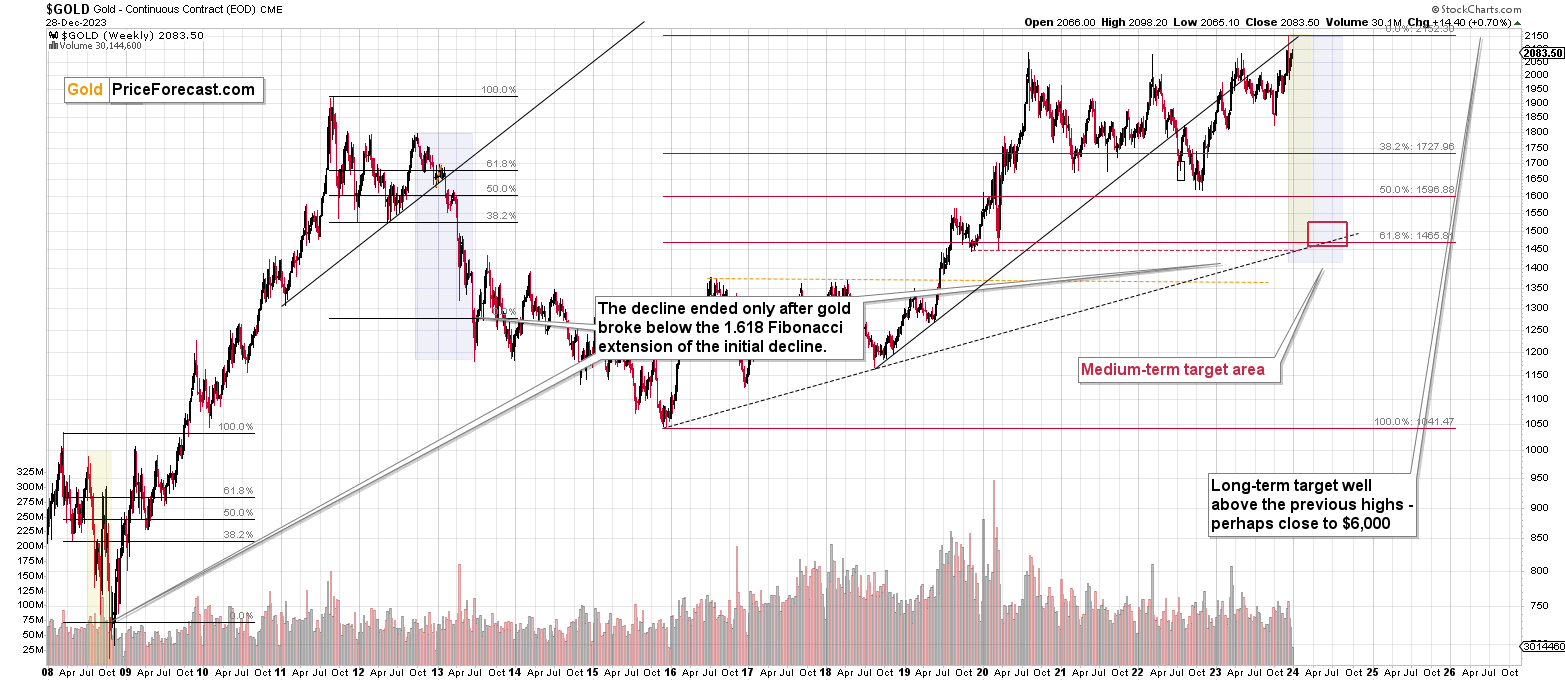
Please note that the above timing details are relatively broad and “for general overview only” – so that you know more or less what I think and how volatile I think the moves are likely to be – on an approximate basis. These time targets are not binding nor clear enough for me to think that they should be used for purchasing options, warrants, or similar instruments.
Letters to the Editor
Depending on the nature and target group of your question, feedback or comment, please use the following means of communication:
- For questions or comments that you’d like to get the Community’s response, please use the Ask the Community space so others can contribute to the reply and also enjoy the answers.
- For questions, comments or feedback that you’d like me to comment on / reply to, please send them to Golden Meadow’s support – some clarifications can be provided directly by our experienced support team, and those that are strictly for me, will be forwarded to me and I’ll then provide replies either individually, or in the “Letters to the Editor” section in the Alerts, depending on the nature of the question/comment.
Summary
To summarize, the key thing about the precious metals market is still gold’s extremely important weekly reversal that we saw two weeks ago, which puts the recent (even today’s) rallies in the proper context. What we see now is a perfectly normal post-initial-decline rebound. These moves used to take gold back up to the 50% - 61.8% (approximately) retracements based on the initial size of the decline, and given today’s upswing, gold futures are now a bit above the 50% retracement. Again, this is normal.
The junior mining stocks are testing their July high, and they are unlikely to break above them in a sustainable manner. Due to the above-mentioned reversal in gold, any strength in the miners here is likely to be invalidated soon.
I know it “feels” extremely bullish, very close to the tops, so it’s particularly difficult to remain calm and objective, but that’s also profitable in the long run. I hope and trust that you will find my analyses helpful in reaching those goals – and growing your portfolio over time (while it’s not possible to have all the short-term moves in the “right” direction, the right approach, help to make money over time).
===
As we’re on a streak of 11 profitable (closed, unleveraged) trades, and – just like I wrote today and in the previous days – it looks like we’re going to see much more of them in the near future, I want to provide you with even more great news!
We’re opening the possibility to extend your subscription for up to three years (at least by one year) with a 10% discount from the current prices.
Locking in those is a great idea not only because it’s perfect time to be ready for what’s next in the precious metals market, but also because the inflation might persist longer than expected and prices of everything (including our subscriptions) are going to go up in the future as well. Please reach out to our support – they will be happy to assist you and make sure that your subscription days are properly extended at those promotional terms. So, for how many years would you like to lock-in your subscription?
This 10% discount (and ability to subscribe to up to three years) applies also in case of the just-released Diamond Package that includes not only Gold Trading Alerts, but also Oil Trading Alerts and Stock Trading Alerts. This package provides access with an additional (bundle-offer) discount, and it’s the most prestigious product that we have in our offer. Be sure to use the “DIAMOND10” code when going Diamond for the 10% discount.
To summarize:
Short-term outlook for the precious metals sector (our opinion on the next 1-6 weeks): Bearish
Medium-term outlook for the precious metals sector (our opinion for the period between 1.5 and 6 months): Bearish initially, then possibly Bullish
Long-term outlook for the precious metals sector (our opinion for the period between 6 and 24 months from now): Bullish
Very long-term outlook for the precious metals sector (our opinion for the period starting 2 years from now): Bullish
As a reminder, Gold Investment Updates are posted approximately once per week. We are usually posting them on Monday, but we can’t promise that it will be the case each week.
Our preferred ways to invest in and to trade gold along with the reasoning can be found in the how to buy gold section. Additionally, our preferred ETFs and ETNs can be found in our Gold & Silver ETF Ranking.
Moreover, Gold & Silver Trading Alerts are posted before or on each trading day (we usually post them before the opening bell, but we don’t promise doing that each day). If there’s anything urgent, we will send you an additional small alert before posting the main one.
Thank you.
Przemyslaw K. Radomski, CFA
Founder, Editor-in-chief

