

Briefly: gold and the rest of the precious metals market are likely to decline in the next several weeks/months and then start another powerful rally. Gold’s strong bullish reversal/rally despite the USD Index’s continuous strength will likely be the signal confirming that the bottom is in.
Welcome to this week's Gold Investment Update.
Predicated on last week’s price moves, our most recently featured medium-term outlook remains the same as the price moves align with our expectations (and we not only took profits from the previous short position, but we profited on the rebound and are now making money on the short side again). On that account, there are parts of the previous analysis that didn’t change at all in the earlier days and are written in italics.
Interest rates continued their ascent this week, and the USD Index has benefited from the hawkish re-pricing. Moreover, the technicals aligned almost perfectly with the fundamentals, as increasing the size of our short position occurred at nearly the perfect time. And while the GDXJ ETF moved higher on Sep. 28, it was largely a countertrend move that should reverse in the days and weeks ahead.
We’ll begin today’s alert by dissecting the fundamentals and then dive into the technical aspects that have proven so prescient over the last several months.
Is Gold Scared of a Recession?
A beautiful setup was wasted on Sep. 28, as gold showed no strength despite weakness from U.S. Treasury yields and the USD Index. And while our out-of-consensus call for higher long-term interest rates surprised the crowd and culminated with a massive bond market sell-off, our future outlook is just as precarious for the PMs.
For example, we have long stated that this cycle should end with a recession. Six of the last seven times the headline Consumer Price Index (CPI) increased by 5% or more year-over-year (YoY) since 1948, the cycles ended with recessions. Furthermore, the one time it didn’t and the headline CPI returned to 2%, a recession occurred roughly 17 months later. Consequently, while history is not the soft landing bulls’ side, it’s still a consensus opinion.
Please see below:
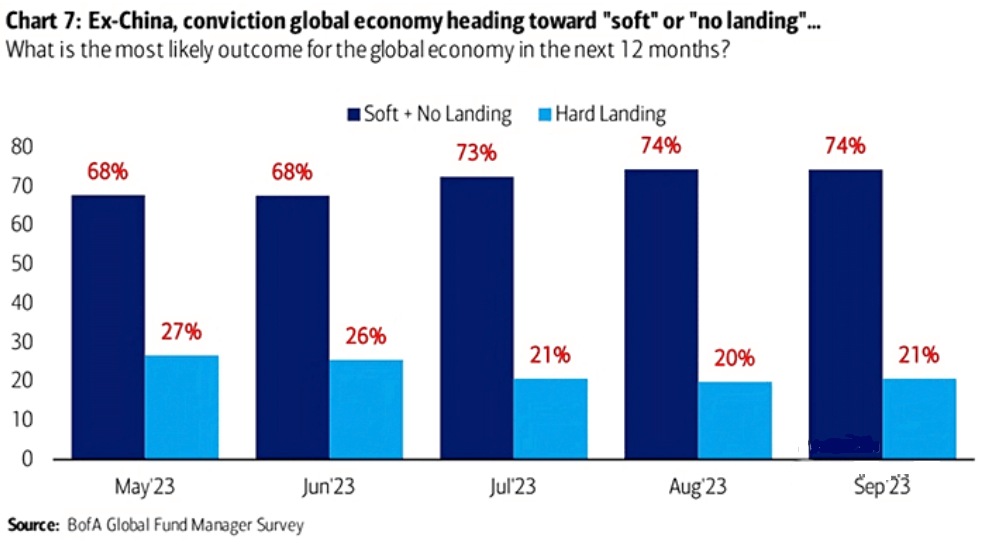
To explain, Bank of America’s latest Global Fund Manager Survey shows that only 21% of respondents expect a “hard landing” (the light blue bar) for developed markets over the next 12 months. Conversely, the majority expect a “soft” or “no landing” scenario to occur, which is a fairytale, in our opinion.
As such, while silver has suffered alongside mining stocks, there is still plenty of misguided optimism priced in that could evaporate if (when) a recession hits.
Speaking of which, the Mortgage Bankers Association (MBA) revealed on Sep. 27 that mortgage applications continue to sink, and we warned that higher long-term interest rates (not the FFR) cause recessions. Joel Kan, MBA’s Vice President and Deputy Chief Economist, said:
“Mortgage rates moved to their highest levels in over 20 years as Treasury yields increased late last week. The 30-year fixed mortgage rate increased to 7.41 percent, the highest rate since December 2000, and the 30-year fixed jumbo mortgage rate increased to 7.34 percent, the highest rate in the history of the jumbo rate series dating back to 2011.”
So, while the crowd ignores these realities, and interest rates have moved even higher this week, the ominous data should worsen until the economy weakens enough for the Fed to cut the FFR (recession).
Please see below:
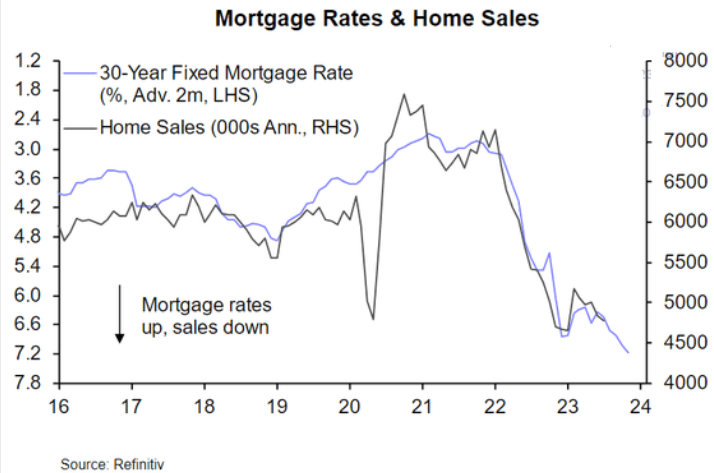
To explain, the black line above tracks U.S. home sales, while the blue line above tracks the inverted (down means up) 30-year fixed mortgage rate. If you analyze the right side of the chart, you can see that the blue line’s descent signals more downside for the black line. Plus, if long-term rates continue to climb, even more demand destruction should unfold.
More Than Mortgages
While that crowd may believe the fundamental weakness is isolated to the mortgage market, there are troubling signs at nearly every turn. And with the USD Index poised to soar when the economic volatility strikes, the PMs should be on the losing end of the drama. For example, Bank of America’s Chief Investment Strategist Michael Hartnett wrote:
“Yield curve steepening -110bps to -67bps, unemployment rate up 3.4% to 3.8%, personal savings rate up 3% to 4-5% YTD, and maybe most importantly, HY defaults are up 1.6% to 3.2%, credit card delinquencies are up by half, from 0.8% to 1.2%, while auto delinquencies are soaring, up 5.0% to 7.3%.”
Thus, while we warned that many of the fundamental metrics that caused us to fade the recession talk in 2021 and 2022 have turned in negative directions, the rapid rise in long-term rates has made the outlook even more dangerous.
As further evidence, The Conference Board revealed on Sep. 26 that U.S. consumer confidence decreased from 108.7 in August to 103 in September. And while the present situation index remained roughly flat, the expectations index suffered mightily. Dana Peterson, Chief Economist at The Conference Board, said:
“Expectations for the next six months tumbled back below the recession threshold of 80, reflecting less confidence about future business conditions, job availability, and incomes. Consumers may be hearing more bad news about corporate earnings, while job openings are narrowing, and interest rates continue to rise, making big-ticket items more expensive.”
Please see below:
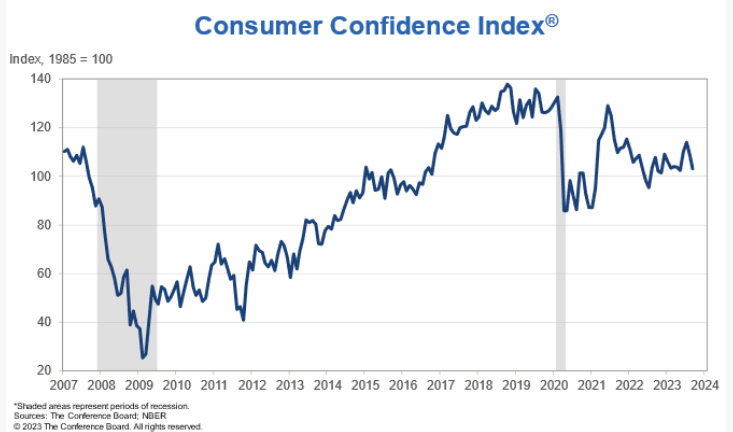
To explain, the blue line’s movement on the right side of the chart shows how U.S. consumer confidence has reversed its recent uptrend as long-term interest rates race to new highs. And with higher oil prices and borrowing costs poised to further reduce Americans’ disposable incomes, consumers are in worse shape now than in 2021 and 2022.
Finally, while consumer confidence was nearly at the same level pre-GFC, another ominous indicator from The Conference Board deserves plenty of attention.
Please see below:
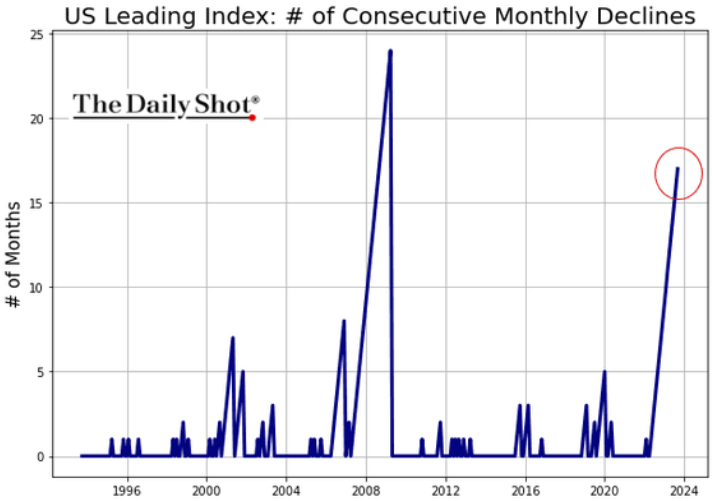
To explain, the firm’s leading economic index has declined for 17 straight months, which, as you can see, is the longest stretch since before the GFC. And like now, everyone believed the soft landing narrative back then, and we all know how that story ended. As such, there is plenty of room for further precious metals downside if (when) fund managers suffer the next crisis of confidence.
Overall, the S&P 500 has felt the pain of higher interest rates, and even though it rallied on Sep. 28, a sharp sell-off should occur in the months ahead. Again, a recession won’t arrive overnight, but it’s essential to notice the warning signs, especially when the consensus firmly believes in a soft landing. Consequently, we did, and still do, think a recession will sink asset prices to their long-term lows.
Silver’s Sell-Off Pauses
Silver has declined materially from its August highs, and we warned that higher real yields would spoil the PMs’ party. We wrote on Oct. 7, 2022:
The U.S. 10-Year real yield often peaks alongside the FFR (or near it). With the Fed poised to raise the FFR by at least another 1.25% (to reach 4.5%), the U.S. 10-Year real yield should have more room to run, which is bullish for the USD Index.
Please see below:
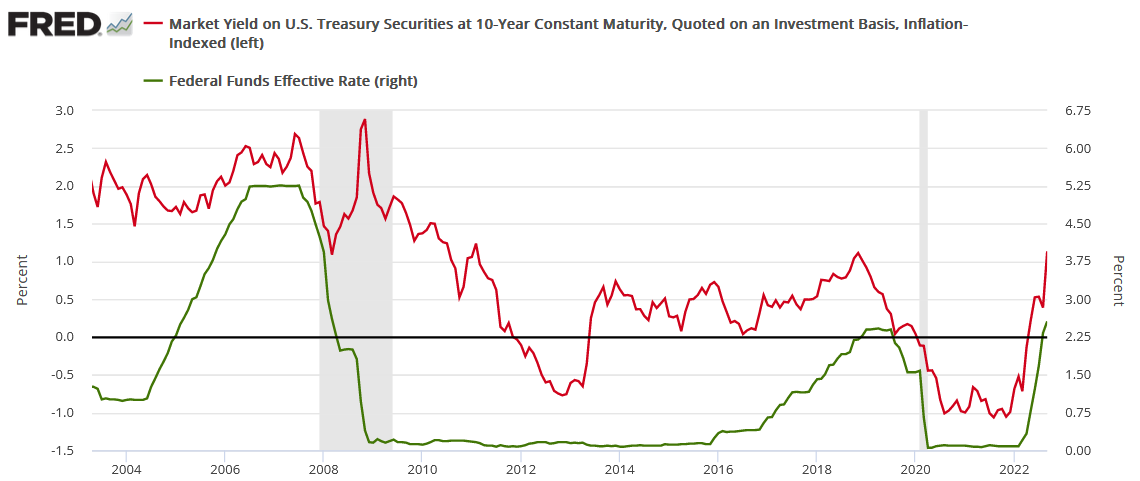
To explain, the red line above tracks the U.S. 10-Year real yield, while the green line above tracks the FFR. As you can see, a higher FFR supports higher real interest rates. Also, when the FFR hit ~4.5% in February 2006, the U.S. 10-Year real yield reached a monthly high of 2.14%, and it occurred with a YoY CPI at roughly half the current rate.
Thus, with the prediction proving prescient, the U.S. 10-Year real yield’s surge has rattled the bulls in the recent weeks.
Please see below:
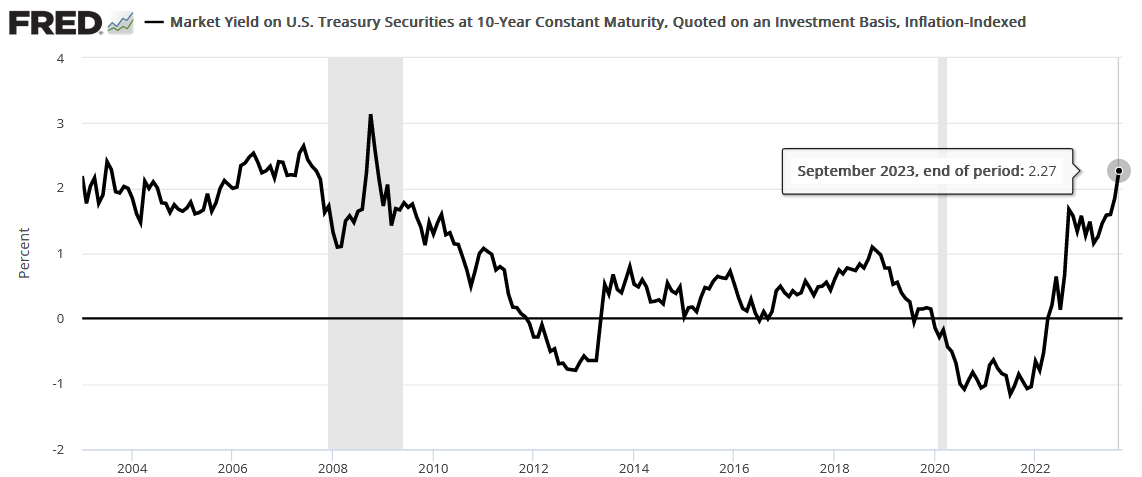
To explain, the U.S. 10-Year real yield recently surged to 2.27% and aligned with our prediction. So, the fundamentals continue to unfold as expected, and a recession should be the next fundamental catalyst to upend gold and silver.
Ominous Indicators
While higher oil prices are often deemed an indicator of economic activity, the reality is that recessions occur when oil prices are high, now low. As such, with crude jumping over $90 recently, it’s another variable that takes money out of consumers’ pockets.
Please see below:
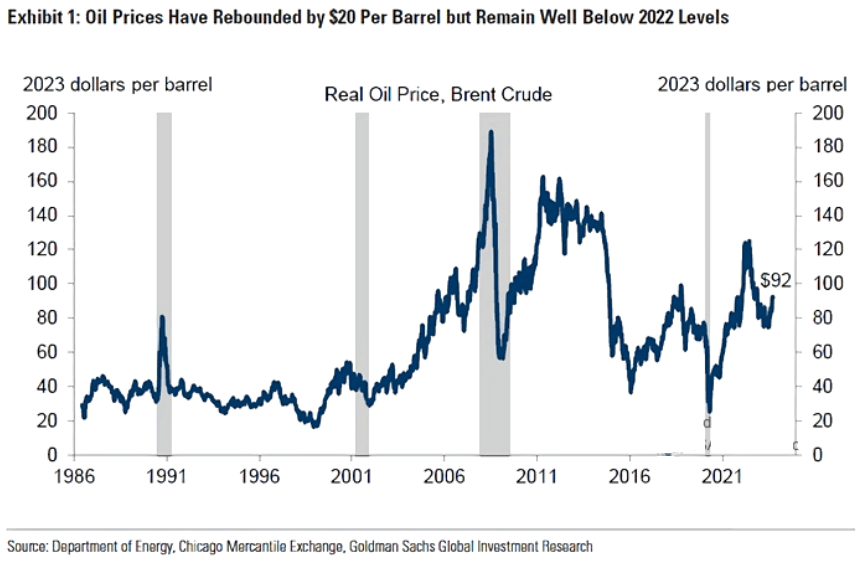
To explain, the blue line above tracks the real Brent oil price, and the vertical gray bars represent recessions. If you analyze the three closest to the left, you can see that higher oil prices were present before/during the U.S. economy’s darkest days.
Therefore, with oil’s ascent occurring alongside rapidly rising interest rates, lower job openings, and student loan repayments restarting next week, the soft landing narrative should come under immense pressure.
To that point, job openings on Indeed hit cycle lows on Sep. 28, and as higher long-term rates suppress demand, the downtrend should continue.
Please see below:
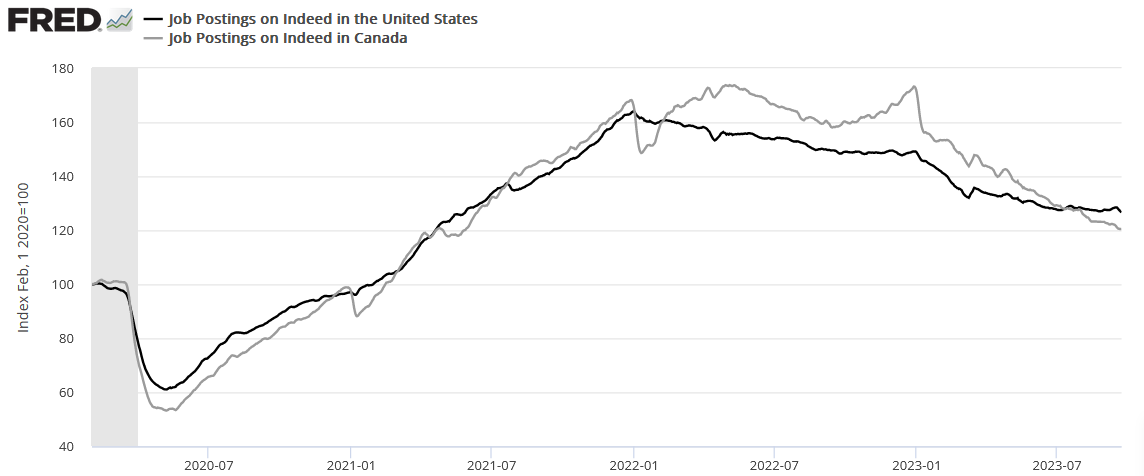
To explain, the black and gray lines above track U.S. and Canadian job postings on Indeed. If you analyze the right side of the chart, you can see that both are heading lower, with Canada underperforming the U.S. And with higher long-term rates present across North America, the trend continues to head in the wrong direction.
In addition, Jefferies downgraded consumer apparel stocks on Sep. 25, as student loan repayments will further degrade consumers’ spending power. And with less money to allocate to discretionary items, the current backdrop is much different than 2021/2022, in our opinion.
Please see below:
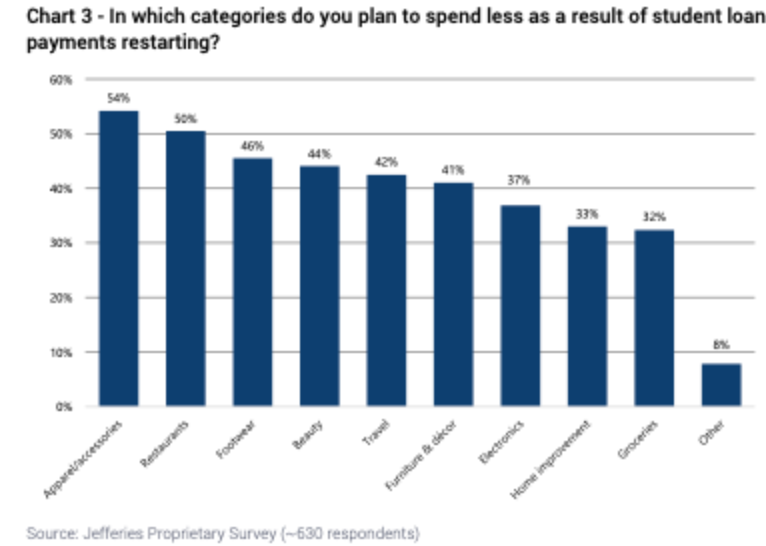
To explain, Jefferies surveyed student loan borrowers and found that roughly 40% to 50% plan to cut their spending on things like electronics, travel and apparel. As such, a confluence of factors has collided, making the economic outlook extremely unfriendly, and a Minsky Moment should help push the USD Index to new highs.
Finally, world trade volume has peaked and begun its move lower, which further highlights why demands’ best days are in the rearview.
Please see below:
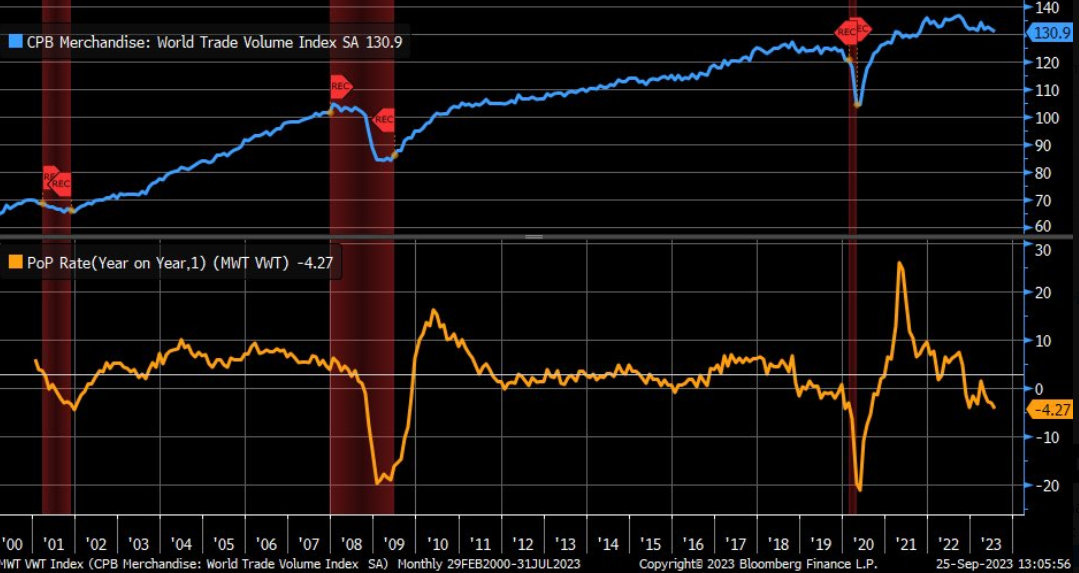
To explain, world trade volume (the blue line) has dipped to its lowest level since October 2021, while the YoY percentage change (the orange line) has gone negative. If you analyze the vertical red-shaded areas, you can see that similar developments preceded the last three recessions. As a result, optimism should turn to pessimism in the months ahead.
Overall, the fundamentals remain aligned with our thesis, and recession momentum has picked up despite the cheerful narrative. Moreover, while the S&P 500 suffered a sharp correction, the crowd assumes that higher rates are the primary concern when history shows the worst sell-offs occur when the Fed cuts the FFR (recession arrives). Thus, we think risk assets, like the PMs, should confront major fundamental hurdles over the medium term.
The Bottom Line
The bond market has become manic, as interest rates have risen nearly every day. But, with history showing that long-term yields rise and rise until an ‘uh oh’ event occurs, the economic invincibility narrative should turn cold with the weather. In other words, while the Fed disappointed investors in 2021, we see a similar development unfolding in 2024.
In conclusion, the PMs were mixed on Sep. 28, as gold underperformed its precious metals peers. And with the weakness poised to continue, mining stocks and silver shouldn’t be too far behind.
Technically Speaking
We have booked 10-straight profitable trades, and the 11th has started out on the right track. I warned that the GDXJ ETF was a sheep in wolf’s clothing, and lower highs and lower lows have confronted the junior miners since mid-April. As a result, those that stuck with the process and avoided falling for the bear market rallies have been rewarded.
From here, I still expect further GDXJ ETF downside, as several medium-term technical indicators are flashing red. For a detailed explanation of the thesis, please read my comments from Sep. 28:
It happened! Junior miners moved to new 2023 lows! If one opened a short position in GDXJ this year and they hold it, they are profitable.
The question – of course – is if junior miners and the rest of the precious metals sector are going to continue to move lower from here or will they bottom, just as they did previously when they were trading at similar levels.
While it’s impossible to predict the future in each and every case, looking into the previous patterns can give us insights into what is likely just around the corner. Let’s take a look, starting with junior miners themselves.
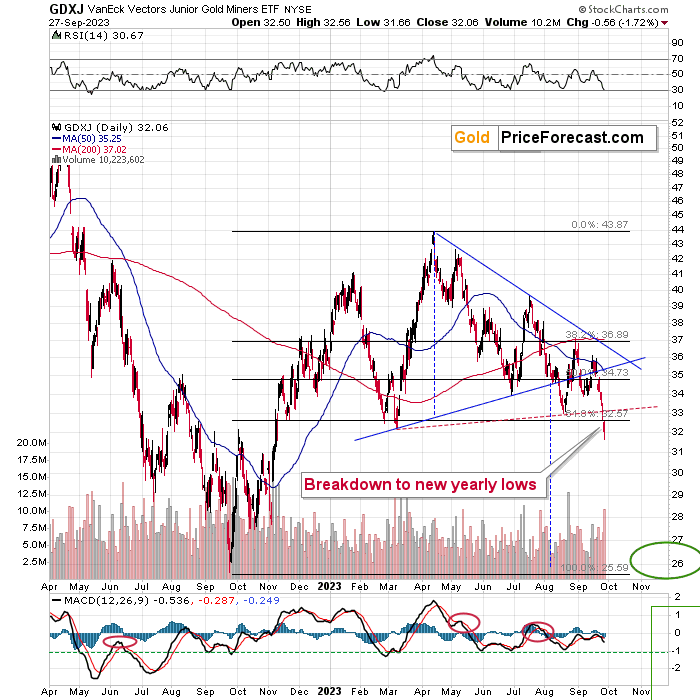
The GDXJ ETF moved and closed at new yearly lows. Its “bigger” counterpart – the GDX didn’t, which only confirms that the proxy that we correctly selected the proxy for our current short position.
The breakdown to new lows is not the only thing that we can see on the above chart, though.
Another important development that we just saw is that the RSI indicator moved very close to the 30 level. This meant that the GDXJ was about to reverse and move higher for at least a while.
Additionally, the GDXJ just formed a reversal candlestick, and it happened on a huge volume. This is also a bullish sign.
However, if we were to see a rally from here, how high could the GDXJ go? And this, my friends, is a better question to be asking right now than one about whether the immediate-term outlook is bullish.
Indeed, based on the RSI and big-volume reversal, the immediate-term outlook is bullish, but the key point here is that based on the breakdown to new lows, it’s quite likely that the GDXJ won’t rally far – if it rallies at all that is.
The GDXJ now has resistance at the previous 2023 low, and the August low, and at the slightly rising red resistance line. This means that the immediate-term upside target is very close – below $33.5.
This, in turn, means that I don’t think that adjusting the current short position is justified from the risk-to-reward point of view. Of course, day-traders might want to take advantage of the possible rebound, but in general, it seems that this move might be too tiny to really take it into account.
Another bullish indication comes from the GDXJ to SLV ratio.
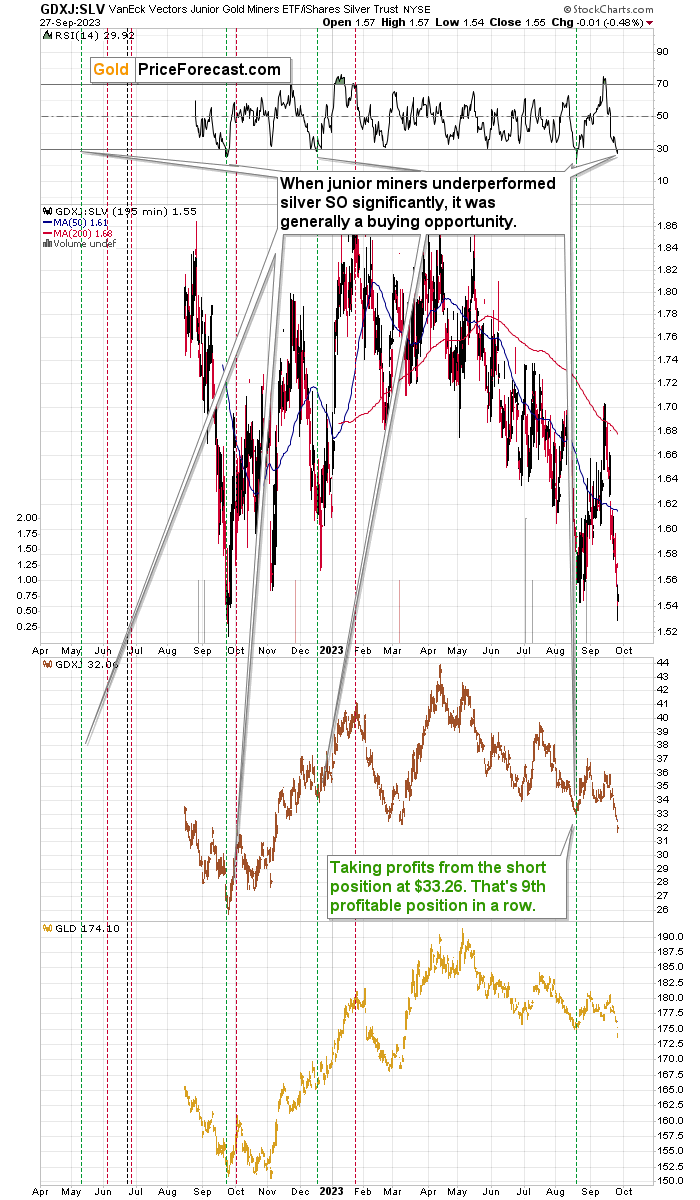
Remember when I commented on this ratio in August? That was the key reason due to which we took profits from our previous short position (before entering a long one, on which we then profited, too). Well, this ratio is providing the same kind of buy indication once again.
Namely, it moved sharply lower, reached the previous lows, and the RSI based on the GDXJ to SLV ratio once again moved below 30. I marked similar situations with green lines, and it they were usually buying opportunities for the GDXJ.
Again, just because a move higher in the GDXJ here might be likely, it doesn’t mean that the GDXJ would be likely to rally far before turning south once again.
Here’s another confirmation of the immediate-term-bullish case that doesn’t necessarily imply much for the following weeks (and it doesn’t change the bearish picture for the big move).
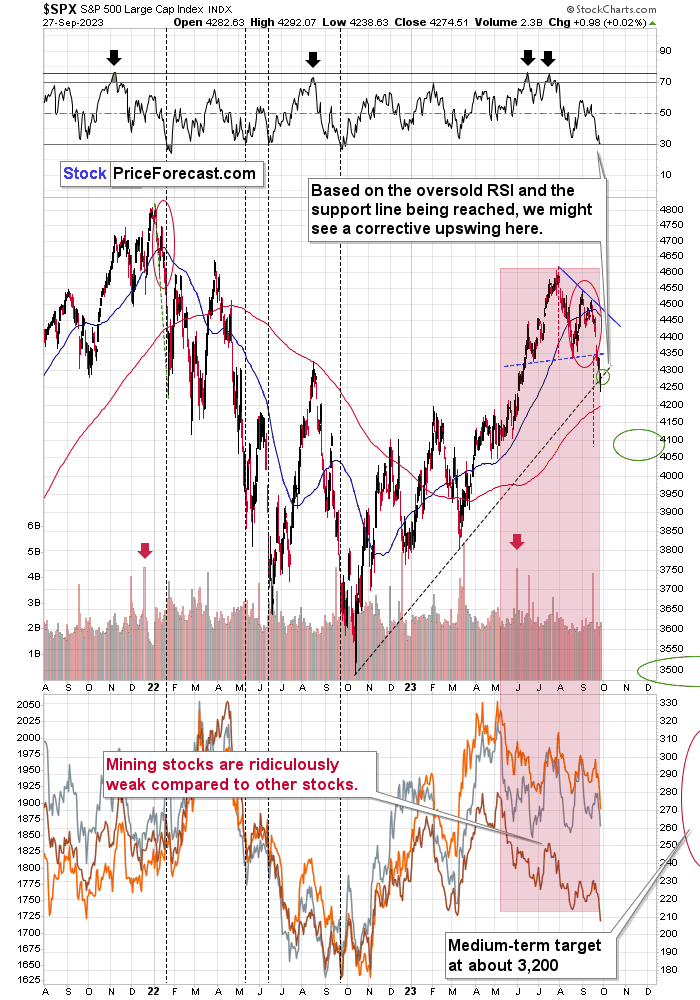
We just saw an intraday reversal in the S&P 500, and it happened right after it reached its rising, medium-term support line while the RSI is close to 30. That’s a very bullish combination. My yesterday’s comments remain up-to-date:
“The thing is that the S&P 500 index just moved below the neck level of the head-and-shoulders pattern (which is bearish for the following weeks). The other thing is that the index moved to the rising support line, which was its short-term downside target area.
On top of that, we have a reading from the RSI indicator that suggests that a corrective upswing is about to be seen.
The correction doesn’t have to be sizable, though. In fact, it’s quite likely that it won’t be. The head-and-shoulders formations and breakdowns below them have a tendency to be followed by short-term upswings that are then followed by much bigger declines.
At this time, the rally could be as small as a move back to the previously broken neckline at about 4,350. This could trigger a corrective upswing in the precious metals sector, but it doesn’t have to be anything to write home about.”
If we see a small rally in stocks, we might see a small rally in junior miners as well.
The USD Index points to a particularly interesting situation as well…
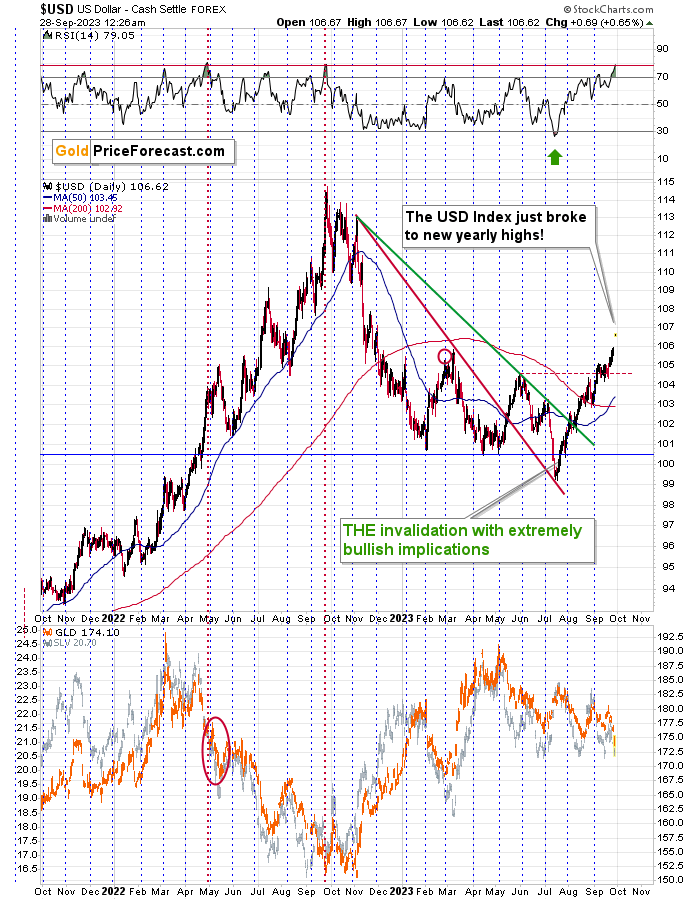
Namely, it’s extremely overbought from the short-term point of view, but at the same time, we just saw a breakout to new yearly highs.
The RSI is well above 70, indicating a likely turnaround… And yet… If you look at what happened to the gold price in the two previous cases when we saw the same thing, you’ll discover that gold bottomed in one of those cases, but in the other (May 2022), it continued to decline, then corrected, and then moved even lower.
Consequently, ultimately, the implications are not as bullish for the precious metals market as they might seem at first sight.
Is a pause or a small correction here likely? Yes. Is a major bottom likely as well? No.
What to do with this information? Of course, it depends on your approach to trading/investing. In my view, however, it’s not necessarily optimal to try to time each and every tiny move. Especially that…
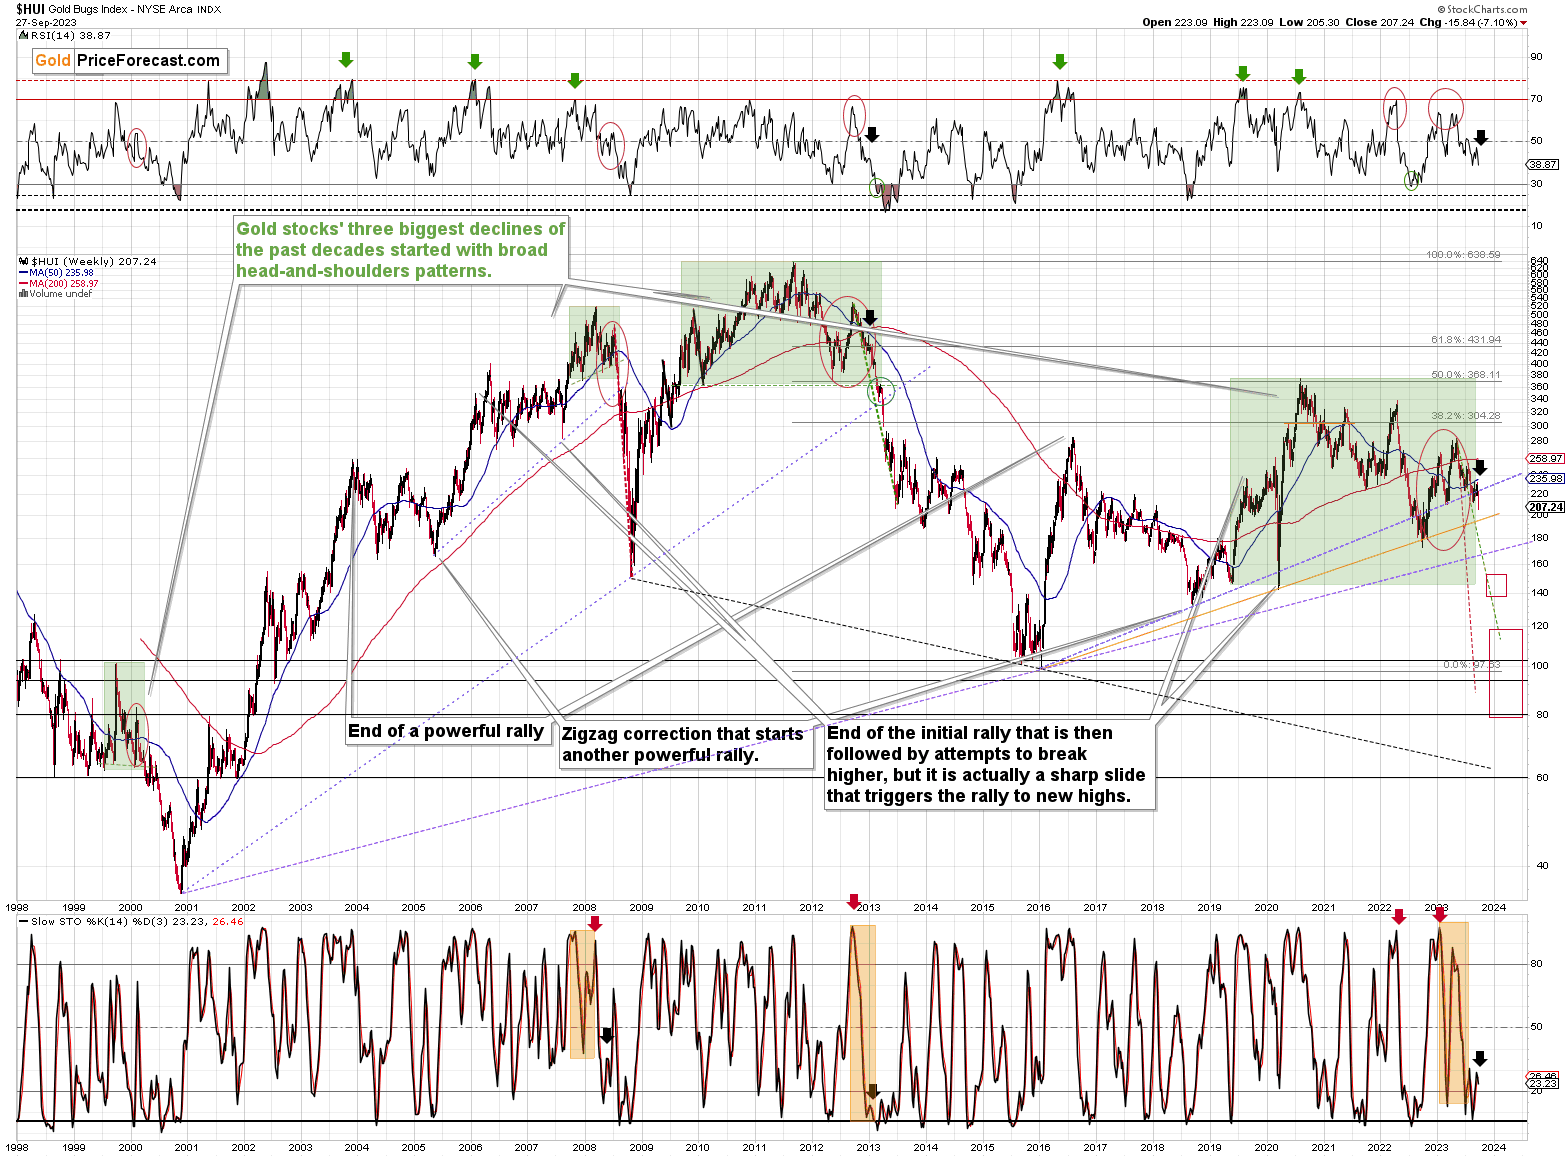
Especially since the HUI Index (flagship proxy for gold stocks) has been behaving very similarly to what it’s been doing in early 2013. I marked that situation with black arrows. Even the RSI is in a similar position.
This seems to be the final part of a very broad head-and-shoulders pattern that leads to waterfall selling. When that happened in 2013, miners were underperforming gold to an extreme extent, and we’ve seen exactly the same thing recently.
The thing is that in this similar situation in 2013, it wasn’t necessarily a good idea to try to try to get in and out of the market during the decline. The move lower was powerful, and the key thing about it was not missing the huge move. Trying to time each rebound makes the above much more difficult.
The bottom line is that the profits on the current short position in the GDXJ are likely to increase in a massive manner in the following weeks, and whether we see a small correction here or not doesn’t really matter. The profit-take levels for this downswing remain up-to-date.
===
If you’d like to become a partner/investor in Golden Meadow, you’ll find more details in the above link.
Overview of the Upcoming Part of the Decline
- It seems that the recent – and probably final – corrective upswing in the precious metals sector is over.
- If we see a situation where miners slide in a meaningful and volatile way while silver doesn’t (it just declines moderately), I plan to – once again – switch from short positions in miners to short positions in silver. At this time, it’s too early to say at what price levels this could take place and if we get this kind of opportunity at all.
- I plan to switch from the short positions in junior mining stocks or silver (whichever I’ll have at that moment) to long positions in junior mining stocks when gold / mining stocks move to their 2020 lows (approximately). While I’m probably not going to write about it at this stage yet, this is when some investors might consider getting back in with their long-term investing capital (or perhaps 1/3 or 1/2 thereof).
- I plan to return to short positions in junior mining stocks after a rebound – and the rebound could take gold from about $1,450 to about $1,550, and it could take the GDXJ from about $20 to about $24. In other words, I’m currently planning to go long when GDXJ is close to $20 (which might take place when gold is close to $1,450), and I’m planning to exit this long position and re-enter the short position once we see a corrective rally to $24 in the GDXJ (which might take place when gold is close to $1,550).
- I plan to exit all remaining short positions once gold shows substantial strength relative to the USD Index while the latter is still rallying. This may be the case with gold prices close to $1,400 and GDXJ close to $15 . This moment (when gold performs very strongly against the rallying USD and miners are strong relative to gold after its substantial decline) is likely to be the best entry point for long-term investments, in my view. This can also happen with gold close to $1,400, but at the moment it’s too early to say with certainty.
- The above is based on the information available today, and it might change in the following days/weeks.
You will find my general overview of the outlook for gold on the chart below:
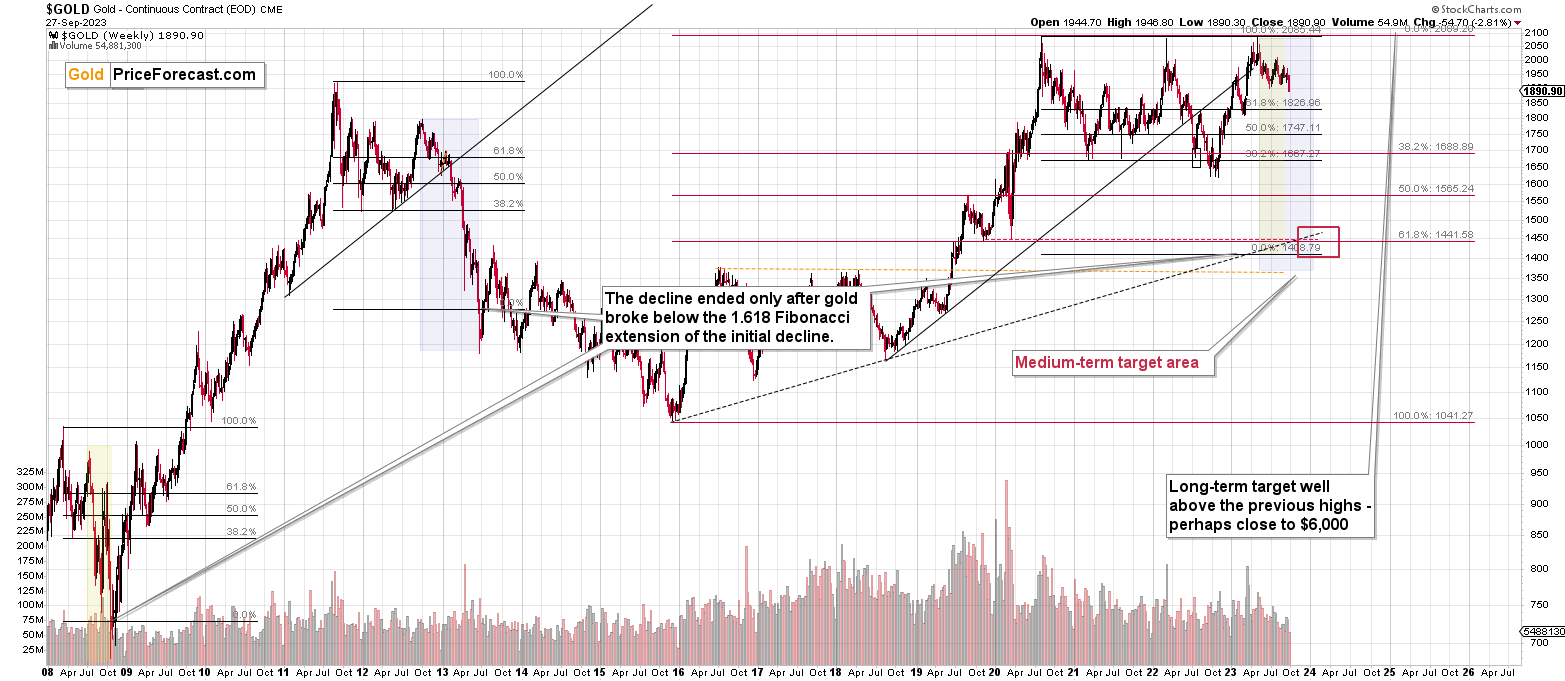
Please note that the above timing details are relatively broad and “for general overview only” – so that you know more or less what I think and how volatile I think the moves are likely to be – on an approximate basis. These time targets are not binding nor clear enough for me to think that they should be used for purchasing options, warrants, or similar instruments.
Letters to the Editor
Please post your questions in the comments feed below the articles, if they are about issues raised within the article (or in the recent issues). If they are about other, more universal matters, I encourage you to use the Ask the Community space (I’m also part of the community), so that more people can contribute to the reply and enjoy the answers. Of course, let’s keep the target-related discussions in the premium space (where you’re reading this).
Summary
To summarize, the medium-term trend in the precious metals sector remains clearly down, and it seems that the corrective upswing is already over and the profits on our current short position are going to increase. We just caught the 10th profitable trade in a row – congratulations. The outlook for the short positions in junior miners and in the FCX remains very favorable.
===
Finally, since 10th profitable trade in a row is such a great piece of news (and the same goes for the fact that the current short position is already profitable), here’s… Even more great news! The possibility to extend your subscription for up to three years (at least by one year) with a 20% discount from the current prices is still open.
Locking in those is a great idea not only because it’s perfect time to be ready for what’s next in the precious metals market, but also because the inflation might persist longer than expected and prices of everything (including our subscriptions) are going to go up in the future as well. Please reach out to our support – they will be happy to assist you and make sure that your subscription days are properly extended at those promotional terms. So, for how many years would you like to lock-in your subscription?
To summarize:
Short-term outlook for the precious metals sector (our opinion on the next 1-6 weeks): Bearish
Medium-term outlook for the precious metals sector (our opinion for the period between 1.5 and 6 months): Bearish initially, then possibly Bullish
Long-term outlook for the precious metals sector (our opinion for the period between 6 and 24 months from now): Bullish
Very long-term outlook for the precious metals sector (our opinion for the period starting 2 years from now): Bullish
As a reminder, Gold Investment Updates are posted approximately once per week. We are usually posting them on Monday, but we can’t promise that it will be the case each week.
Our preferred ways to invest in and to trade gold along with the reasoning can be found in the how to buy gold section. Additionally, our preferred ETFs and ETNs can be found in our Gold & Silver ETF Ranking.
Moreover, Gold & Silver Trading Alerts are posted before or on each trading day (we usually post them before the opening bell, but we don’t promise doing that each day). If there’s anything urgent, we will send you an additional small alert before posting the main one.
Thank you.
Przemyslaw K. Radomski, CFA
Founder, Editor-in-chief

