

Briefly: gold and the rest of the precious metals market are likely to decline in the next several weeks/months and then start another powerful rally. Gold’s strong bullish reversal/rally despite the USD Index’s continuous strength will likely be the signal confirming that the bottom is in.
Welcome to this week's Gold Investment Update.
Predicated on last week’s price moves, our most recently featured medium-term outlook remains the same as the price moves align with our expectations (and we not only took profits from the previous short position, but we profited on the rebound, and are now making money on the short side again). On that account, there are parts of the previous analysis that didn’t change at all in the earlier days and are written in italics.
Rapid rate rises remained this week, as the bond market refused to help out the PMs, oil or the general stock market. And with the developments aligning with our thesis, part one has played out as expected. The next fundamental catalyst is a recession that pushes several risk assets to their long-term lows.
We’ll begin today’s alert by dissecting the fundamentals, and then dive into the technical aspects that have proven so prescient over the last several months.
Gold Should Fear More Than Higher Rates
While the crowd assumed the Silicon Valley Bank (SVB) debacle would elicit a Fed pivot, we warned throughout the drama that the ‘crisis’ was much different than the bank failures from 2008. Moreover, while the crowd screamed recession on several occasions throughout 2021 and 2022, we noted how long-term interest rates were too low to create the demand destruction necessary to eradicate inflation.
And with gold benefiting from the false narrative, we emphasized on Apr. 6 that the dovish re-pricings would not last. We wrote:
It was only a month ago that investors couldn’t sell bonds fast enough. Now, they’re tripping over one another to get back in. In the process, the positioning shift has weakened the USD Index and helped uplift gold, silver and mining stocks.
Please see below:
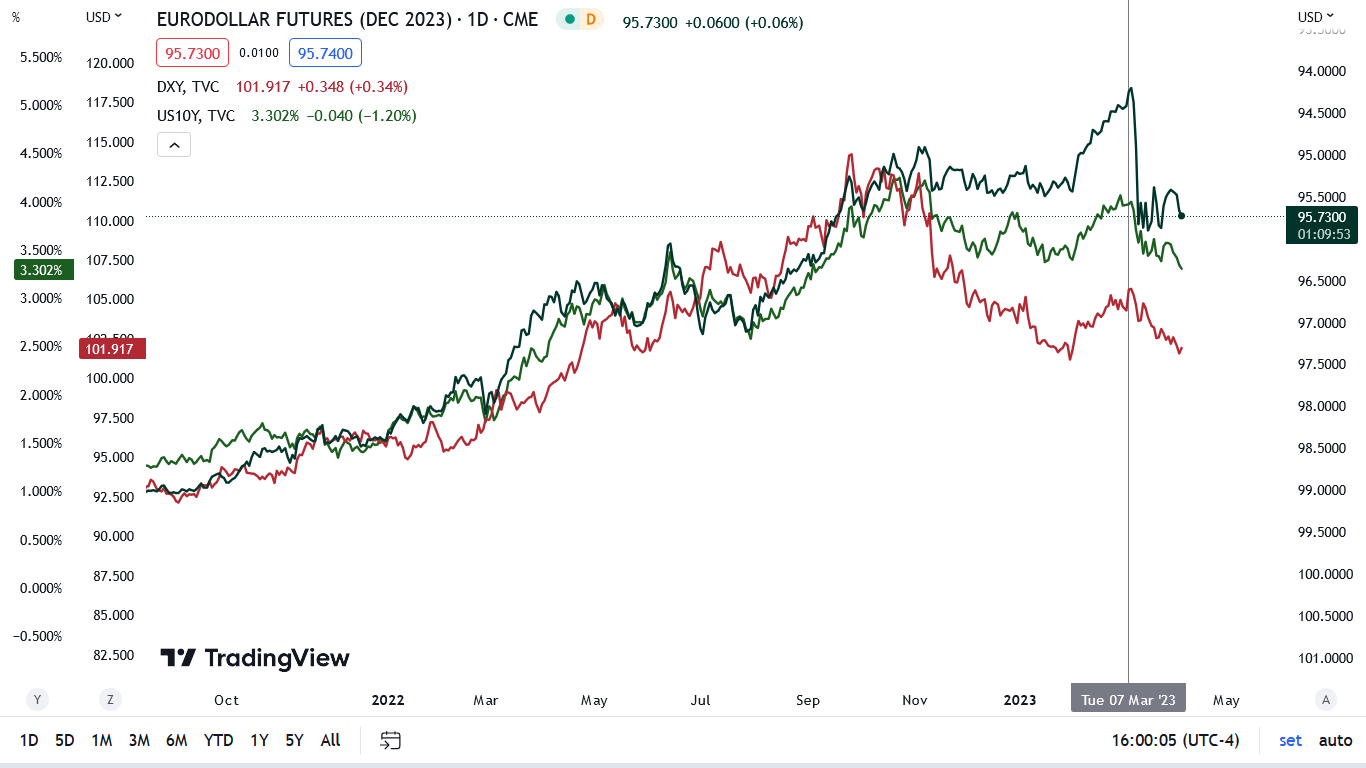
To explain, the red line above tracks the USD Index, while the green line above tracks the U.S. 10-Year Treasury yield. More importantly, the black line above tracks the inverted (down means up) December 2023 Eurodollar futures contract.
For context, Eurodollar is a proxy for the expected U.S. federal funds rate (FFR). And since the yield moves inversely to the price, when Eurodollar rises, it means the crowd is pricing in a lower FFR.
Now, if you analyze the relationship, you can see that perceptions of a more hawkish Fed (higher black line) helped uplift the USD Index and the U.S. 10-Year Treasury yield. Conversely, the vertical gray line on the right side shows how the recent banking crisis has the crowd pricing in rate cuts by the end of December (lower black line), which has weighed on the USD Index and the U.S. 10-Year Treasury yield.
However, rate cuts are wishful thinking without a full-blown banking crisis, and a reversal of these expectations should rock the PMs in the months ahead.
To that point, with the metrics performing hawkish 180s, our bearish fundamental thesis has played out as expected.
Please see below:
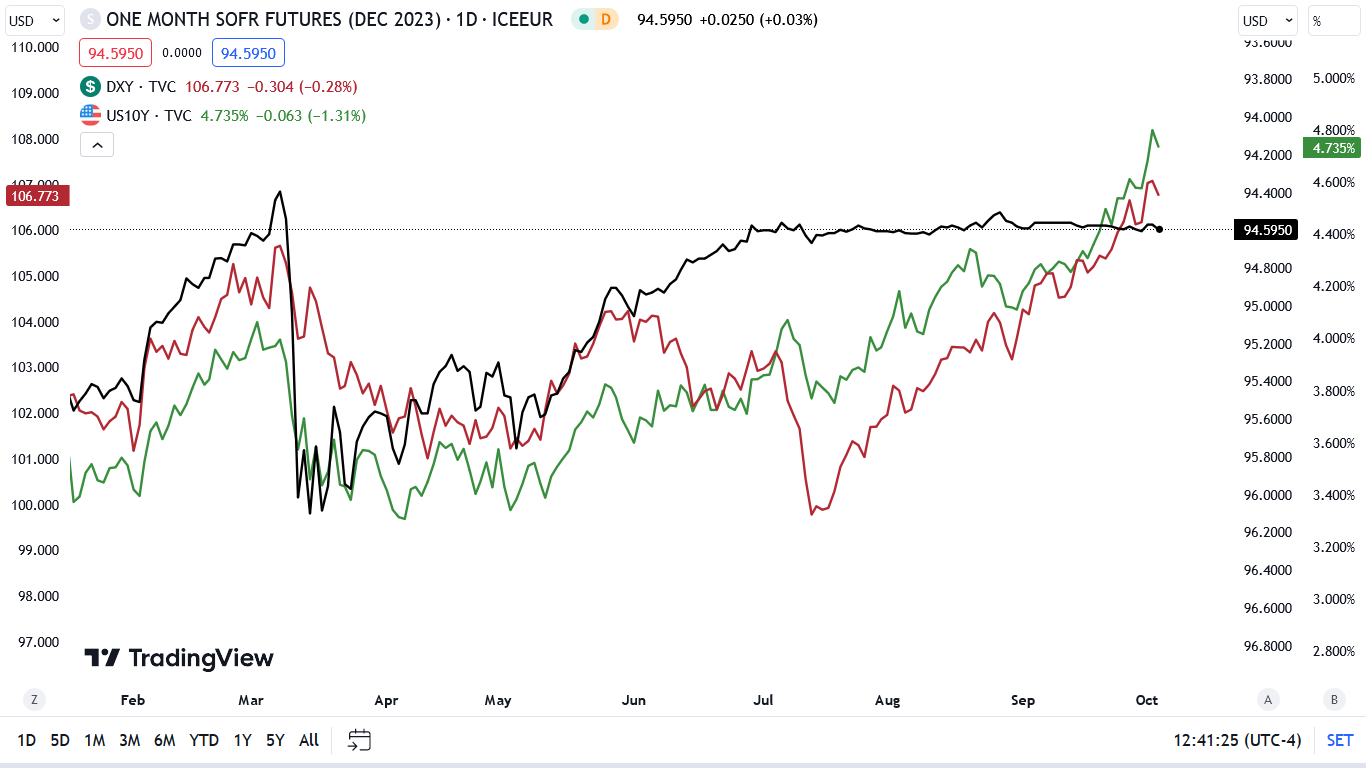
To explain, the three lines’ movement on the right side of the chart highlights how rate-hike expectations (the black line) rose dramatically, which helped uplift the USD Index and the U.S. 10-Year Treasury yield (the red and green lines). Thus, silver’s plight was far from unexpected, and the financial markets are much more aligned with fundamental reality.
Yet, while the crowd was caught out of position by too low long-term interest rates, the opposite should occur in the months ahead.
Inflation Is Old News
No one was more bullish on inflation than us throughout 2021, as we warned that higher commodity prices, rental prices and consumer spending would push the headline Consumer Price Index (CPI) higher. However, with the leading data moving in the opposite direction now, the anxiety uplifting U.S Treasury yields is misguided. Although, the recent rate surge should only worsen the economic outlook and create a recession that pushes the PMs to their final lows.
For example, the Shelter CPI accounts for more than 30% of the headline CPI’s movement. And with the former coming in at 7.2% year-over-year (YoY) in August, inflation looks highly problematic. In contrast, while oil prices initially celebrated the inflation reacceleration, the strength is much more semblance than substance.
Please see below:
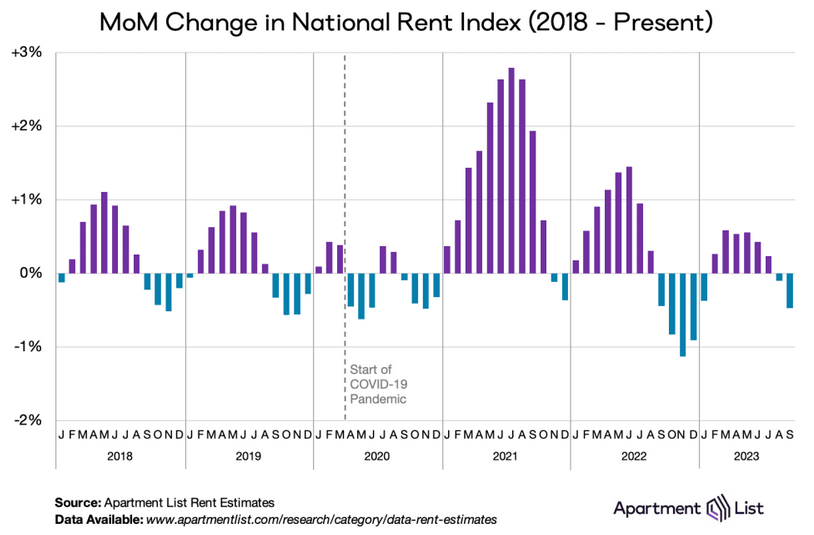
To explain, the purple and blue bars above track the month-over-month (MoM) percentage change in Apartment List’s rent index. If you analyze the behavior in 2021, you can see why we were so bullish on inflation. On the flip side, the bars on the right side of the chart have decreased dramatically, and rental prices declined by 0.5% MoM in September.
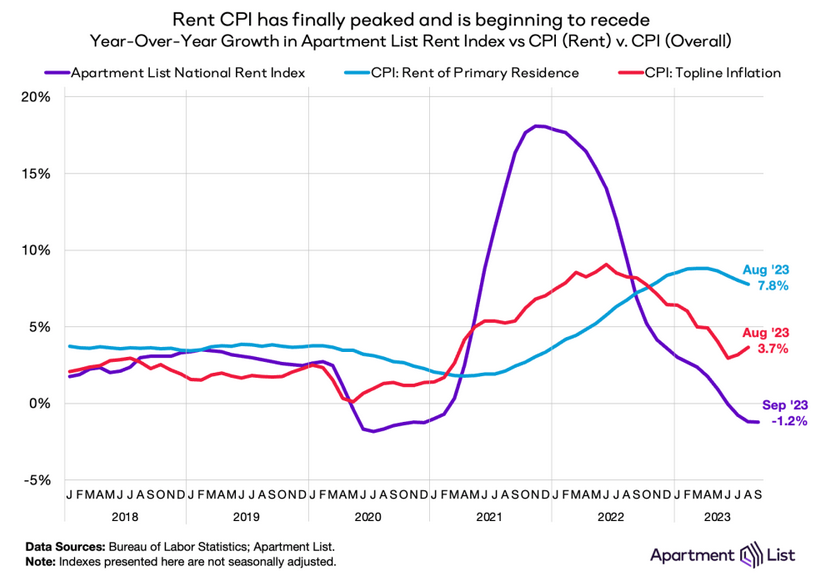
Add it all up, and Apartment List’s rent index is down by 1.2% YoY in 2023 (the purple line below), which means the rent CPI has plenty of room to fall (the blue line below).
Please see below:
Even more revealing, when the crowd bought the transitory narrative in 2021, we warned that Costco – the second-largest retail company in the U.S. – was sounding the alarm. And with the warnings continuing throughout 2022, Costco CFO Richard Galanti said on Sep. 23, 2022:
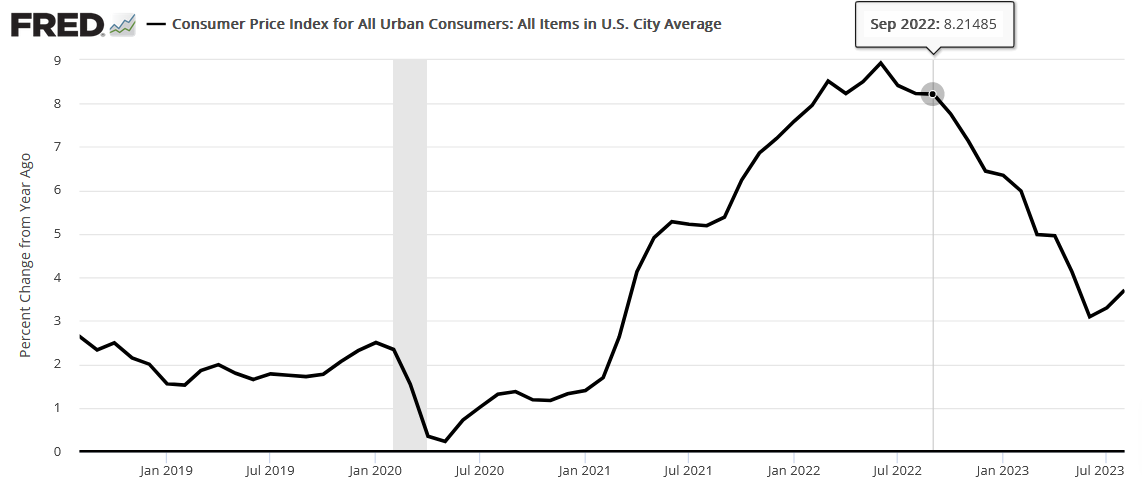
And surprise, surprise, the headline CPI was in the 8% range YoY in September 2022.
Please see below:
Conversely, what a difference a year makes. Costco released its fourth-quarter earnings on Sep. 26, and Galanti painted a much different portrait of the inflation backdrop.
Please see below:
So, while the crowd remains fixated on inflation, they’re likely behind the curve once again, And what does this mean for the PMs? Well, with nominal rates rising and inflation poised to fall, the U.S. could confront higher real yields than expected, which is bullish for the USD Index. Moreover, the developments could push the U.S. into recession and worsen the outlook for risk assets.
Finally, the second act (recession) of the bearish fundamental thesis could take months to develop. And that’s why the technicals are so useful because they allow us to trade around our medium-term bearish view. Furthermore, with a buying opportunity likely to present itself soon, there is plenty of fuel for precious metals upside.
Please see below:
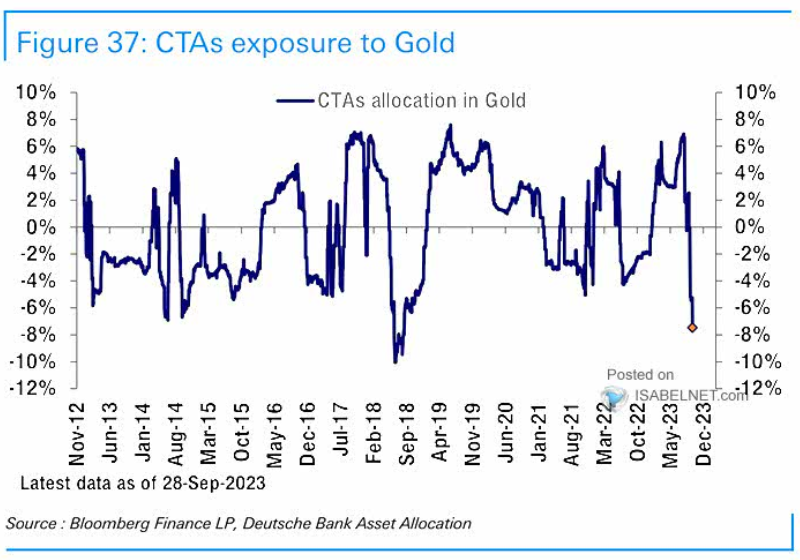
To explain, the blue line above tracks CTAs’ (algorithms) gold exposure. If you analyze the right side of the chart, you can see that the quants are extremely short, which should result in a squeeze higher at some point. As a result, while we remain patiently short for the time being, we eagerly await the opportunity to become short-term bulls.
Overall, interest rates have battered the S&P 500, as nearly all risk assets suffer when bonds offer higher future returns. But, with the growth and inflation outlooks turning bearish, the next major moves lower for the PMs and stocks could occur with rates falling, which is common throughout history. Thus, it’s crucial to remain vigilant in the weeks and months ahead.
Silver Bulls Are the Walking Wounded
With silver gunning for its 2023 lows, the recent sell-off has done severe technical damage. And while the weakness has been a boon for our GDXJ ETF short position, silver could enjoy a meaningful bounce in the weeks ahead. Yet, the technicals are much better than the fundamentals at uncovering support and resistance.
As for the medium-term outlook, we remain bearish, and will cover the fundamental metrics that keep us cautious. To begin, we’ve warned on numerous occasions that higher long-term interest rates (not the FFR) create recessions. And with the recent rate surge dominated by the long end, the chickens should come home to roost in the months ahead.
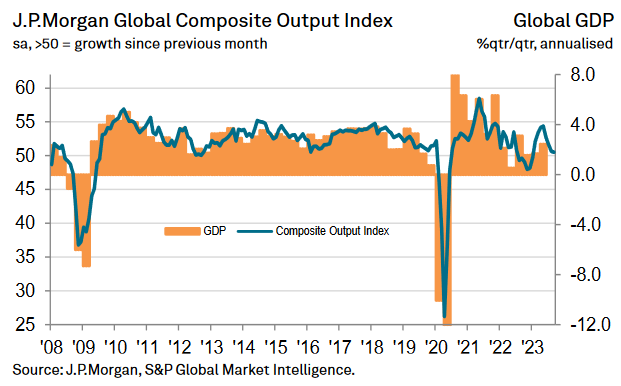
S&P Global and J.P. Morgan released their Global Composite PMI on Oct. 4. And with output already sputtering, the data should only worsen as higher long-term rates filter through the system. The report stated:
“Global economic growth remained lackluster at the end of the third quarter, as output edged higher and intakes of new work contracted for the first time in eight months. There were also signs of further weakness in the coming months, as backlogs of work fell sharply and business optimism dipped to a nine-month low.”
Please see below:
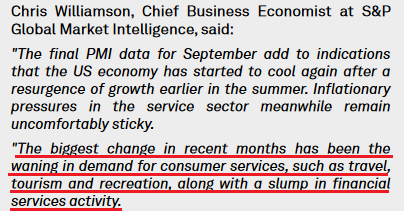
Similarly, while gold could realize a short-term bounce if rates decline due to economic weakness, the medium-term consequences are still bearish. S&P Global’s U.S. Services PMI report stated:
“September data indicated a continued decline in new business at service sector firms. The rate of contraction quickened to the sharpest since December 2022, albeit still modest overall. Lower new orders were reportedly linked to weak domestic and foreign client demand, with new export orders falling for the first time in five months. The decrease in new export sales was the steepest since February and was in stark contrast to the solid expansion seen in July.”
So, while the ISM’s report was much more optimistic, we prioritized S&P Global’s data in 2021 and 2022 and will continue to do so now.
Please see below:
Weak Data
The Mortgage Bankers Association (MBA) reported on Oct. 4 that its Market Composite Index declined by 6% week-over-week (WoW), as higher long-term rates make homes even more unaffordable. Moreover, the longer the gambit persists, the more it stresses the U.S. economy and the more the USD Index should soar when an ominous event occurs. Joel Kan, MBA’s Vice President and Deputy Chief Economist, said:
“Mortgage rates continued to move higher last week as markets digested the recent upswing in Treasury yields. Rates for all mortgage products increased, with the 30-year fixed mortgage rate increasing for the fourth consecutive week to 7.53 percent – the highest rate since 2000.
“As a result, mortgage applications grounded to a halt, dropping to the lowest level since 1996. The purchase market slowed to the lowest level of activity since 1995, as the rapid rise in rates pushed an increasing number of potential homebuyers out of the market.”
On top of that, the recent JOLTS release rattled the bond market, as job openings smashed expectations. Yet, the data is also more semblance than substance, as other metrics support weaker results in the months ahead. Indeed’s Economic Research Director for North America Nick Bunker wrote on Oct. 3:
“Don’t be fooled into thinking the longstanding cooldown in the labor market has suddenly reversed itself after an unexpectedly strong August. While the headline jump in openings was surprising, the large majority of the almost 700,000 increase in job openings came from just one industry – professional and business services – and is likely noisy.”
As further evidence, the quits data highlights how the 2023 labor market is nothing like 2021 and 2022, and oil prices seem to have gotten the memo recently.
Please see below:
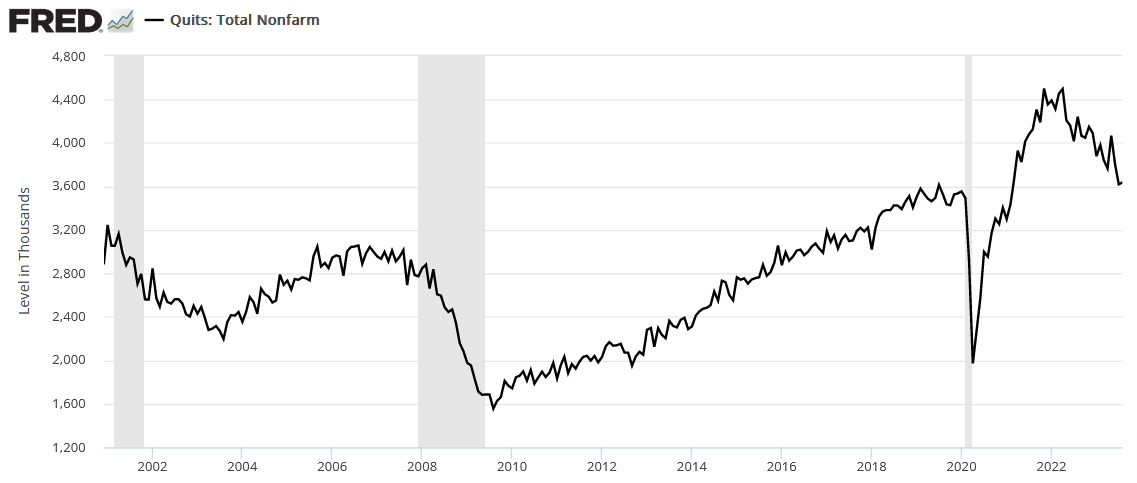
To explain, more Americans quit their jobs when the labor market is hot and do the opposite when it’s cold. And if you analyze the right side of the chart, you can see that quits barely budged in August and remain firmly in a downtrend. Consequently, the metric continues to follow a path that aligns with the last three recessions.
Overall, silver has suffered mightily, as our warning about higher nominal and real yields has come to fruition. Furthermore, with a stronger USD Index also part of the thesis, the developments have rattled the S&P 500 too. So, while we may position for a short-term bounce, the medium-term trend remains down, in our opinion.
The Bottom Line
Reality has returned to the financial markets, as interest rates have moved materially higher. And with the development coinciding with the PMs moving materially lower, the technicals and the fundamentals remain a powerful team. As such, we aim to demonstrate similar accuracy in the months ahead.
In conclusion, the PMs were mixed on Oct. 5, as mining stocks attempted a comeback. But, we still expect more downside before a likely buying opportunity presents itself.
Technically Speaking
While the GDXJ ETF rallied on Oct. 5, the trend of lower highs and lower lows continues. Therefore, the technicals have been like a North Star, and little has occurred to change my outlook. And while an opportunity to flip long may present itself soon, the charts and analysis below highlight why I remain bearish, so please read yesterday’s comments to gain a deeper understanding.
Before quoting those comments, I’d like to provide you with a quick early-market update. I think you might be concerned with today’s moves higher, especially in silver, and especially given that the triangle-vertex-based reversal in GDXJ is right now.
Starting with the latter… We see that the GDXJ has indeed moved higher, but it moved higher before the reversal point and it reversed… to the downside right at it. It could be the case that instead of the reversal point indicating an important short-term bottom, it confirmed a rather irrelevant immediate-term top.
Overall miners are barely up today, while gold is up more notably.
It even broke above its declining resistance line after forming an intraday bottom. However, the move higher can sometimes not be bullish, but bearish.
Why so? I already mentioned one reason – because during this small upswing mining stocks didn’t show strength against gold.
And while miners didn’t show strength, silver did.
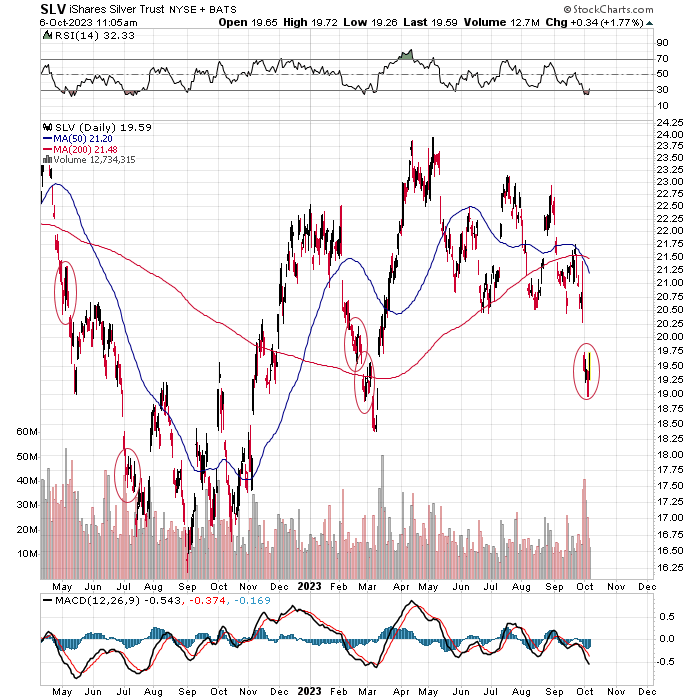
Silver is up by almost 2% today, and white metal’s short-term outperformance of gold is often a sell signal. So, it’s not that clear if we saw an important short-term bottom.
Moreover, please note that the size of the current corrective upswing is very similar to the size of the corrective upswings that we saw in the past in the final parts of the previous short-term rallies, but not right at the bottoms. I marked those situations with red ellipses.
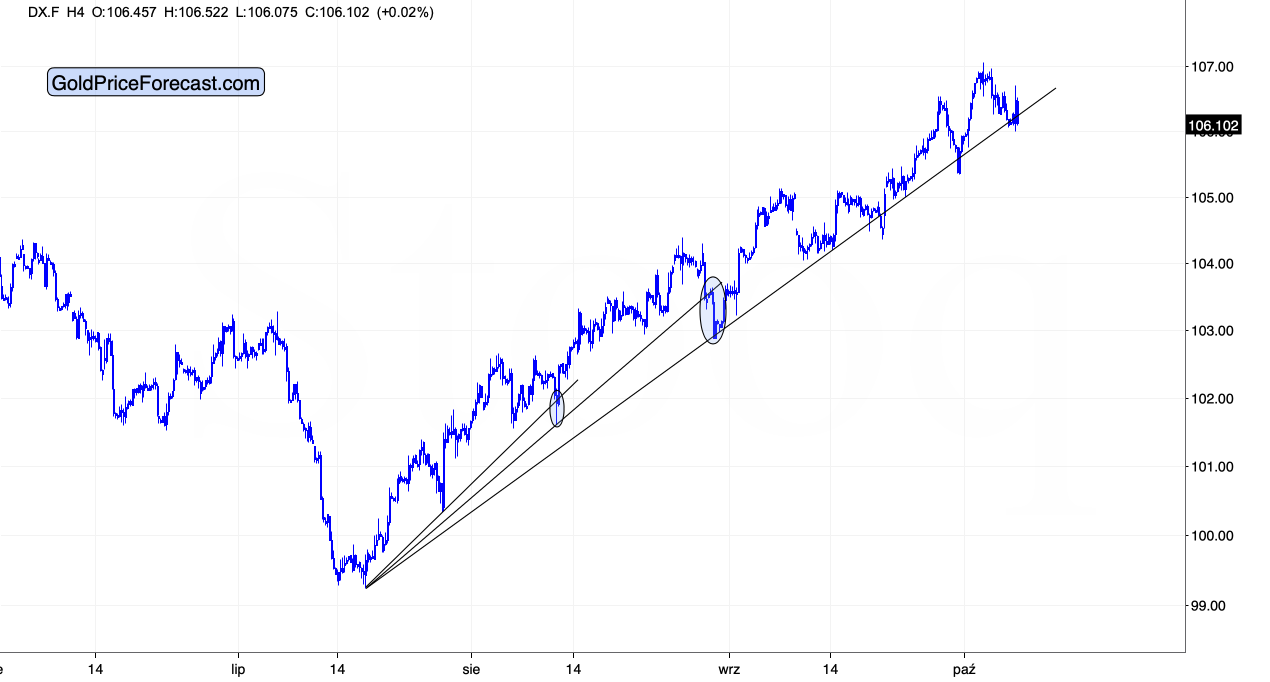
The USD Index moved slightly below its rising support line and while this might be viewed as a breakdown… In reality all those tiny breakdowns were moments when the USD Index started to rally again. Consequently, I don’t see it as a sell signal at this time.
All in all, I don’t see today’s price action as a major confirmation of the bottom. And consequently, I think that keeping the short positions intact is justified from the risk to reward point of view.
Most importantly, though, if I’m wrong here and miners actually do rally from here, they are not likely to rally very far, as the upside target would be the same as I wrote previously – at about $32 for the GDXJ (or even $33 if things get more bullish). Neither of those levels is high enough (compared to the current price of ~$31.4) to justify a change in the current trading position. After all, given the links to the 2013 slide, the real risk here is to be out of the short position – the risk being missing out on this enormous opportunity. So, again, I think that keeping the current short position open at this time is justified from the risk to reward point of view.
And now, to provide bigger context, here’s what I wrote previously (I’m still including the note about the possibility of seeing a slide and a bigger bottom in the GDXJ today or on early next week because that could still happen, but I don’t think that it would create a buying opportunity unless GDXJ slides to our profit-take levels – close to $28):
Gold, silver, and miners have been declining substantially recently, just as the USDX has been soaring. But all (good?) things come to an end, right?
While the above is up for debate, it’s definitely true that no market moves up or down in a straight line *cough* except for silver *cough* without periodic corrections. And since the precious metals sector has been declining relentlessly recently, it seems natural to expect it to at least correct sometime in the near future.
Indeed, there are signs pointing to a nearby reversal and an upcoming correction… Before the carnage really begins.
Let’s start today’s discussion with a look at the two markets that can (and do) impact the price moves in gold, silver, and mining stocks: the USD Index and the general stock market.
The USD Index has been truly soaring since its fake breakdown to new yearly lows. It took a breather right before and right after breaking above its May/June highs, but it moved sharply higher thereafter.
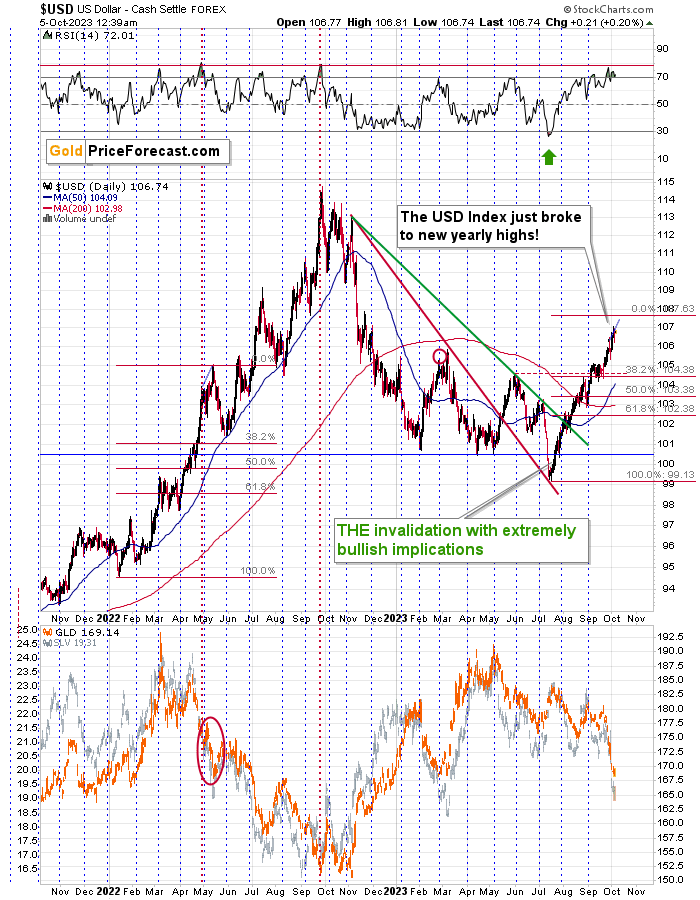
The RSI based on the U.S. Dollar index jumped well above 70, then it corrected a bit, and now it’s once again in the overbought territory. In recent history, there was only one similar situation, and that was in May 2022.
Since history tends to rhyme (just as the people’s emotional responses to similar price moves remain similar under varying economic conditions), the above situation is our best guide into the current state of affairs.
What happened then is that the USDX – after moving to the extremely overbought levels (in RSI terms), corrected slightly and then moved higher once again. That was the final short-term top. Then, a brief pullback materialized, and the rally continued.
What’s interesting is the size of the move above the initial high that was accompanied by the extreme RSI reading. I marked that move with a blue line, and I copied it to the current situation. If the USDX rallies in a similar manner here, it will top close to the 107.5 level.
This level is approximately confirmed by another technique – the Fibonacci extension. The technique suggests that a bigger move can be approximately 1.618 times bigger than the initial rally in the same move. So, it’s kind of like a Fibonacci retracement, but the other way around. Applying this technique to the current rally and using the August top as the end of the initial move provides us with ~107.6 as the target price.
The most recent high was 107.05, so it seems that the U.S. currency could move slightly higher before forming the final top. It could also be the case that it already topped, but the former seems more likely.
And you know what was the most important thing about it all from a gold investor’s point of view? That gold didn’t rally recently when the USD Index corrected a bit. This indicated that gold wasn’t ready for a rally just yet – it seems that it needs to go even lower before it can rebound.
Also, while we’re discussing the USD Index, let’s not forget how perfectly the technical technique called the cyclical turning point worked this year.
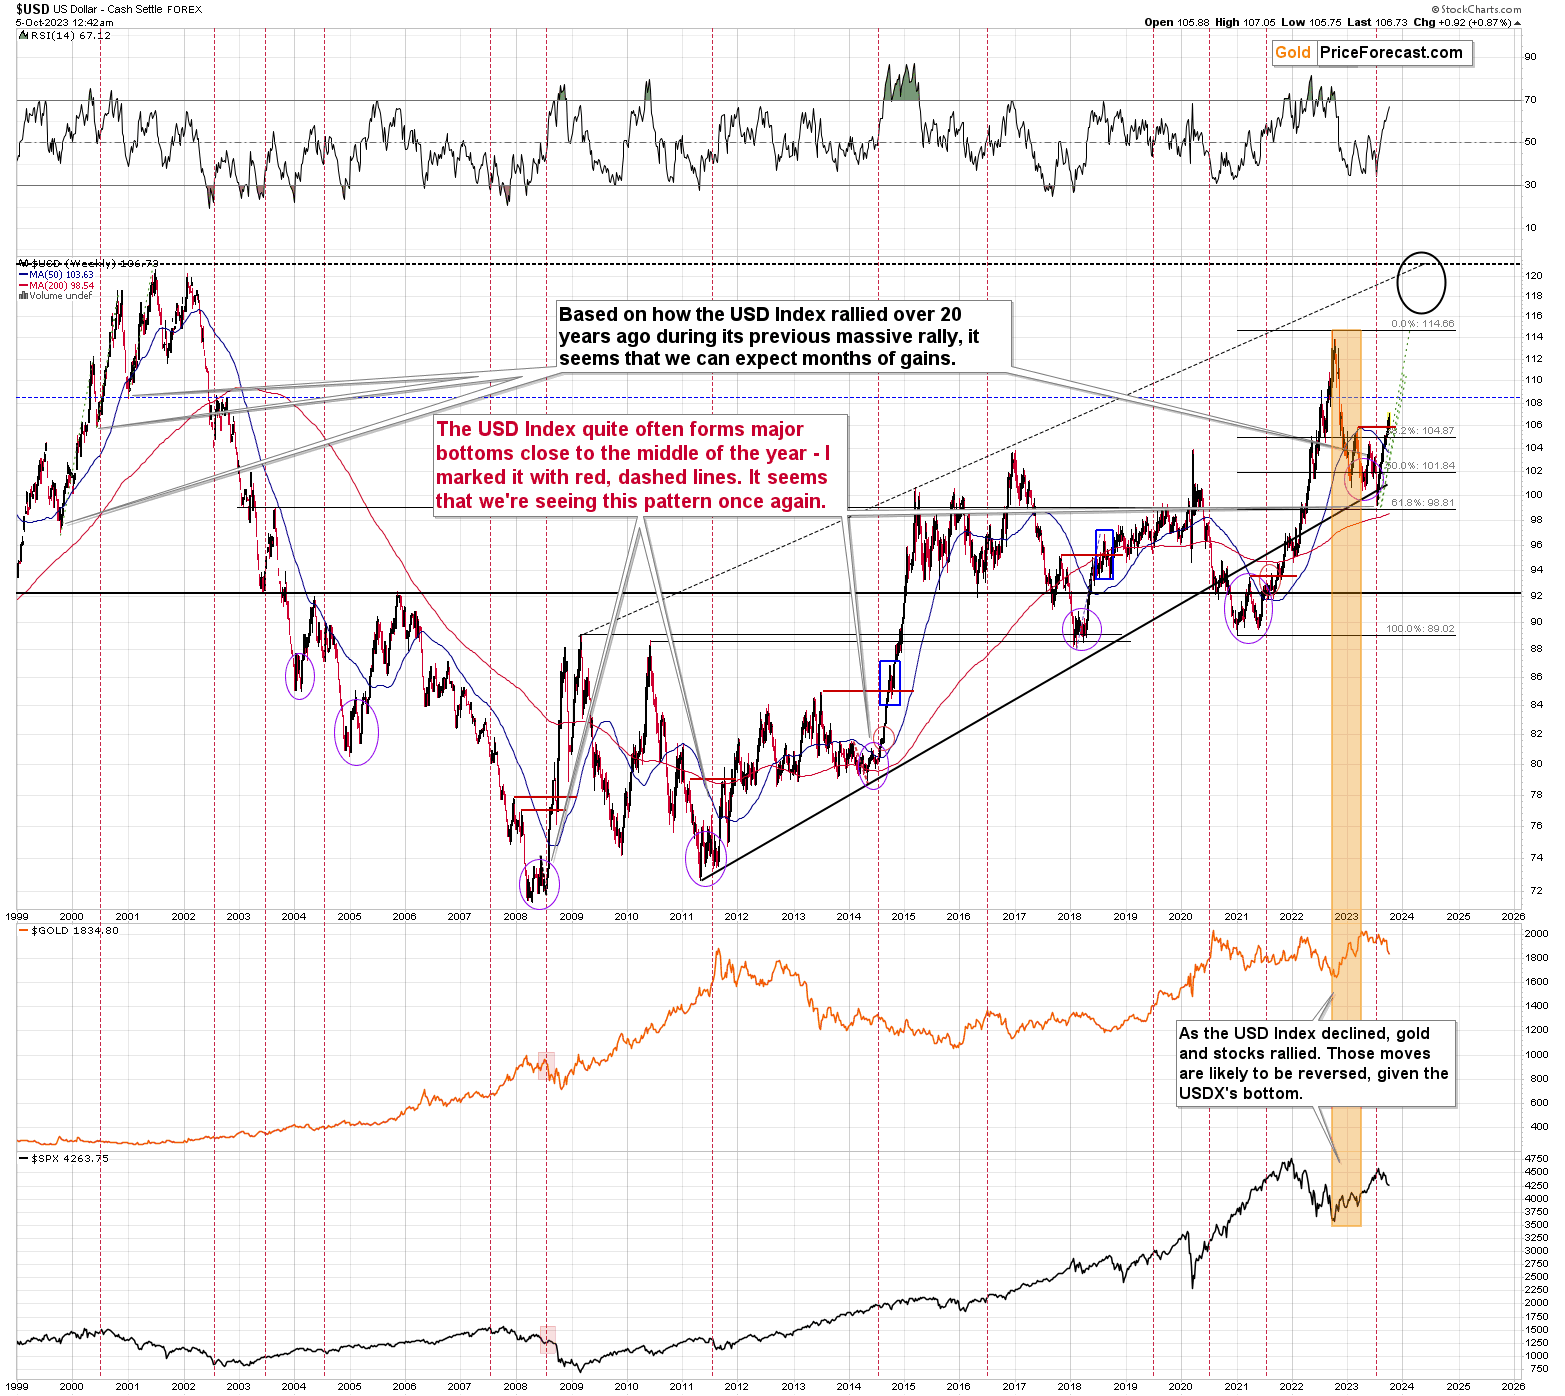
The simple and obvious (yet noticed by very few people) technique is to take into account the USD Index’s tendency to form local bottoms in the middle of the year. That’s exactly what happened this year, and it was one of the things that made me doubt the USD Index’s breakdown to new yearly lows. I wrote that this move was likely to be reversed and that the implications of that invalidation would be profound. With the USD Index well above 106, it seems that they were indeed profound.
Anyway, the key takeaway from the USD Index’s analysis for precious metals investors is that gold, silver, and mining stocks might decline a bit more before they form a short-term bottom, as they are negatively correlated with the USD Index. After all, the opposite seems to be in the cards for the latter.
How low can the USDX decline when it corrects? Of course, I can’t make any promises, but it seems that a pullback to the previous highs and the 38.2% Fibonacci retracement - at about 105 – would be a likely outcome.
Having said that, let’s see what’s going on in the stock market.
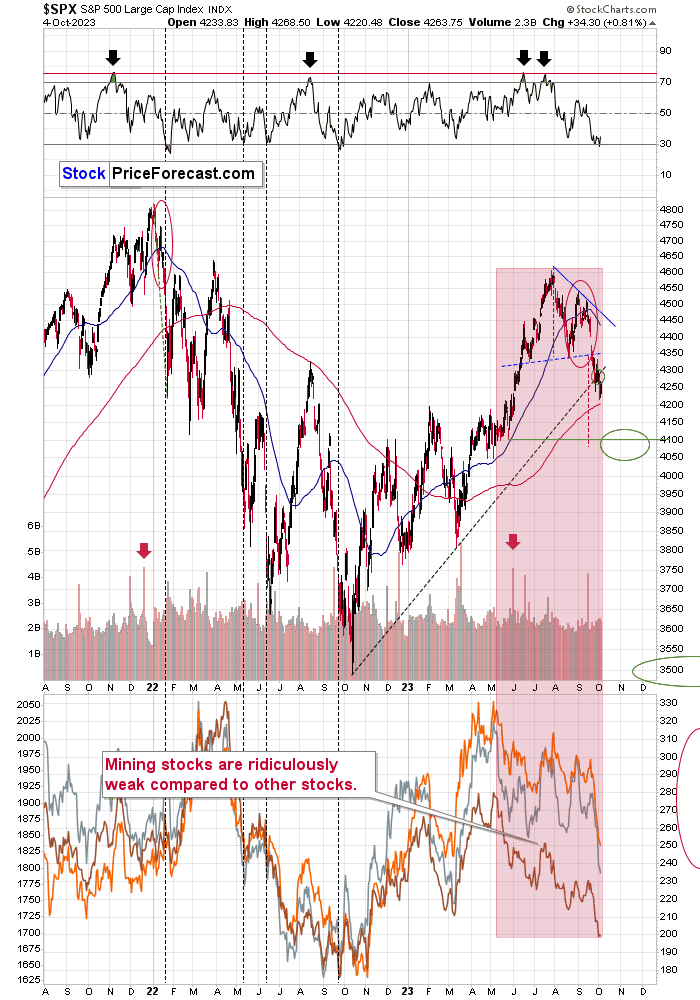
The S&P 500 Index just broke below its rising support line, and it closed there for two consecutive days. This happened right after the index verified the breakdown below the neck level of the head and shoulders pattern that I wrote about (as being potentially formed) a few weeks ago.
The best and most interesting part of all this is that both moves make much more sense together than when being examined independently. You see, the head and shoulders patterns tend to be followed by a small correction – a verification of the breakdown below the neck level.
I previously wrote that the rising medium-term support line would be likely to provide the necessary trigger for that move. That’s exactly what we saw. And now, since we’re already after this correction and this support line has been “taken out”, the natural follow-up to the head and shoulders pattern can emerge.
And the follow-up is that the decline below the neck level is likely to be approximately equal to (or bigger than) the size of the head of the pattern. I marked this technique on the above chart, and it points to a move to about 4,100.
Naturally, this doesn’t imply that the entire medium-term decline is likely to end there, but it does indicate that it’s where stocks are likely to at least take a breather and correct.
What’s the takeaway for the precious metals’ investors and traders? That the next corrective upswing might be just around the corner, but we’re not at it just yet. Also, since the stock market is more correlated with silver and miners (especially junior mining stocks) than it is with gold, the above is particularly important for those two markets.
Speaking of mining stocks, let’s take a look at their chart from the long-term point of view.
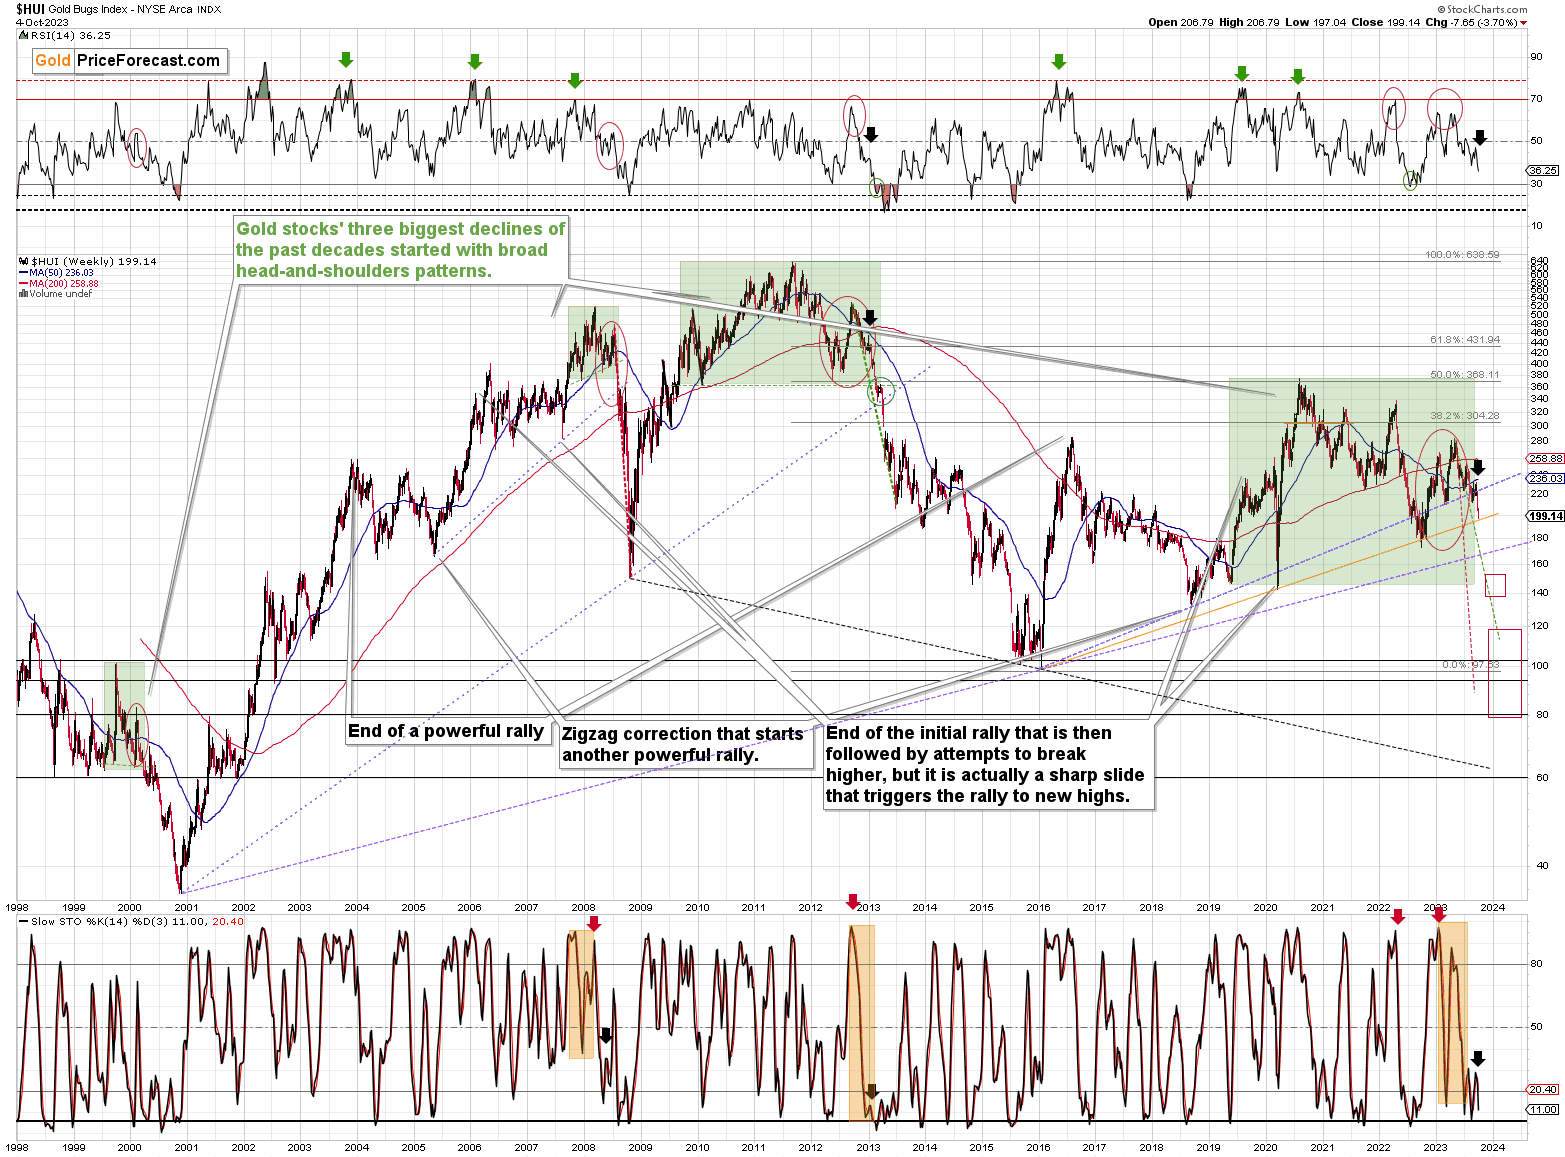
The HUI Index is a proxy for gold stocks, and the reason why I’m featuring it is that indexes are better for assessing long-term trends than ETFs – after all, the latter have fees etc. that impact their valuations in the long run and can distort the technical implications a bit.
On a side note, this effect is very (!) strong in the case of leveraged ETFs, which is why it’s not a good idea to apply technical analysis to leveraged ETFs like JNUG or JDST (to be precise, there might be some very rare exceptions).
The thing that I want to emphasize here is the fact that the HUI Index once again moved to its rising, long-term support line (marked with orange). That’s the same line that stopped the 2022 decline.
To be precise, what happened previously was that the HUI Index moved slightly below this line and then invalidated this move, which was followed by a sizable short-term rally.
I expect this line to hold once again, but this time to trigger only a small rally. And when everyone and their brother will expect gold stocks to soar, like they did in the second half of 2022, gold miners will plunge (after the small corrective upswing).
The upcoming slide is not likely to be a small thing.
No.
The current situation appears to be similar to what we saw in early 2013 (broad head and shoulders pattern marked with green, similar situation in the indicators, extreme underperformance of gold), and based on that, we can expect the corrections to be relatively small and quick and the declines to be enormous.
While we’re looking at the markets from a broader perspective, let’s take a look at the long-term proxy for junior miners – the Toronto Stock Exchange Venture Index.
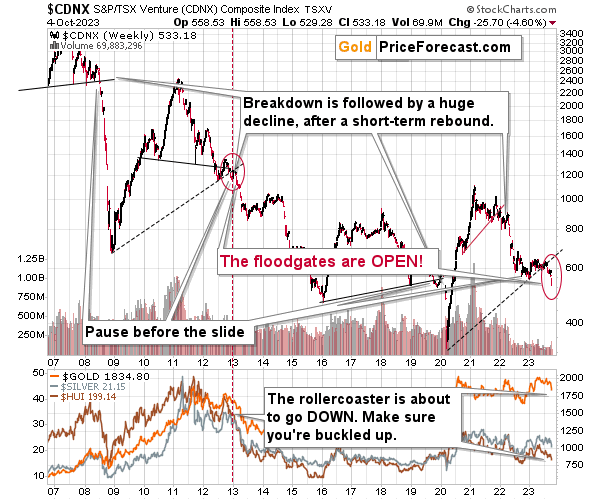
What we see on the above chart might as well be the very definition of a “screaming sell signal”.
What happened recently is a sizable short-term decline. It’s not a big deal on its own.
Now, what makes it a HUGE DEAL is the fact that this move lower happened after about a yearly consolidation, a breakdown below the rising, long-term support line, and in tune with the analogy to… early 2013!
I just mentioned the same period based on a different index! The fact that we see an analogy based on two separate indexes that are both very important makes the link to early 2013 so much stronger!
The action that followed 10 years ago took many (let’s be honest – almost everyone) by surprise. This time, we’re prepared. This time, we’re ready to apply a judo-, jiu-jitsu-, or aikido-like move, and instead of being hurt, we’re taking advantage of that slide.
Still, before the massive slide materializes, it seems that we’ll see at least one corrective upswing, and it seems that it could start at prices that are just slightly lower than the current ones.
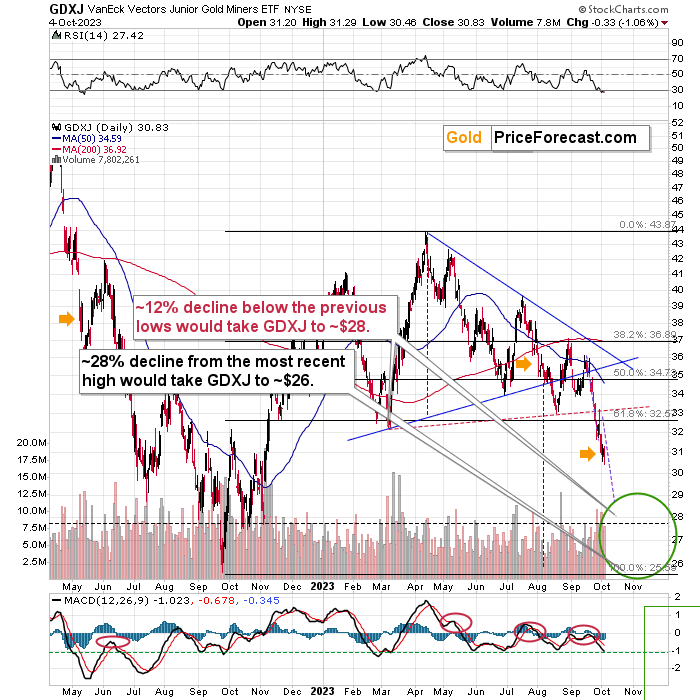
How low can the GDXJ go? Based on the most recent price moves, the upper of the two previously mentioned support levels – close to the $28 level.
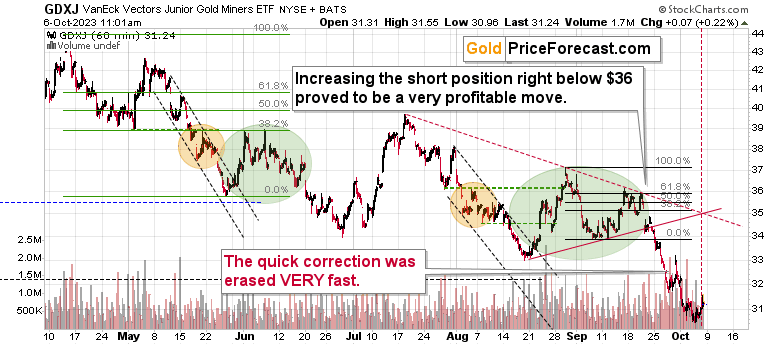
My previous comments on the above chart remain up-to-date:
The GDXJ topped on Friday at $33.20 and then it declined by almost a full dollar, closing the week at $32.23.
In this way, junior miners verified their move to new 2023 lows through:
- weekly close below the previous 2023 lows
- three consecutive daily closes below the previous 2023 lows
- the comeback to the previously broken support line, which was followed by a decline, which verified the line as resistance.
This means that whatever rally was likely to happen based on Wednesday’s and Thursday’s reversals might have already happened.
The slide to new lows can now continue.
Also, please note that I wrote that I didn’t think that it was a good idea to adjust the short position even despite the possibility of seeing an intraday rally here.
Now, the question is, how low would be too low for the mining stocks. In other words – when are they likely to bottom, at least temporarily?
As you can see on the above chart, I marked a downside target area with green ellipse – that’s where the next bottom is likely to form in my opinion – between the levels slightly above $28 and approximately $26.
Why? There’s no significant support above $28 and the support provided by $26 (the 2022 low) is very strong.
The higher of those targets is supported also by the technique that suggests that at decline that follows a consolidation is likely to be similar to the one that preceded it. We just saw a tiny consolidation and I marked the preceding decline with a purple, dashed line. I copied it to the current situation, and it points to price levels below $29 as the next target. This technique doesn’t have to be precise – it can work on a near-to basis, so the support provided by the October and November (2022) lows seems to be a more likely target.
What I’d like to add on top of that is that based on the more short-term chart, it could be the case that this level is reached close to the end of this week or early next week.
The thing is that the triangle-vertex-based reversal point is just around the corner – it points to Friday’s session as the likely day of the reversal. However, since those turning points can work on a near-to basis, I wouldn’t say that the bottom has to take place exactly on that day.
What I would like to say is that the bottom is likely to form rather soon, which is why I’m adjusting the profit-take levels for the current short position.
What’s likely to happen after this bottom?
Of course, there are no certainties, but it seems quite likely that we’ll see a sharp corrective upswing. Why sharp? Because the decline was sharp as well. The $32 level seems to be a good upside target for the corrective upswing (once the bottom is in; not yet), as that’s where the previous 2023 low was, and a move to that level would imply a verification of the breakdown below it.
Moreover, please note that such a move would be symmetrical to the decline that we saw last year in October. Markets sometimes make those symmetrical moves, and sometimes they are like “anniversaries”. Those are not very reliable techniques, but since they are just on top of what seems likely based on other techniques, they simply fit the narrative and make it more likely to happen.
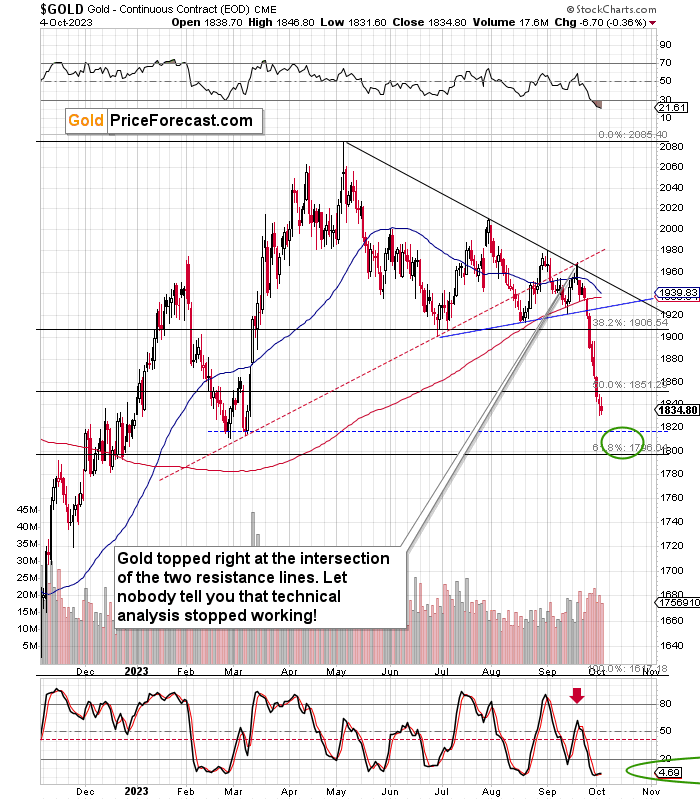
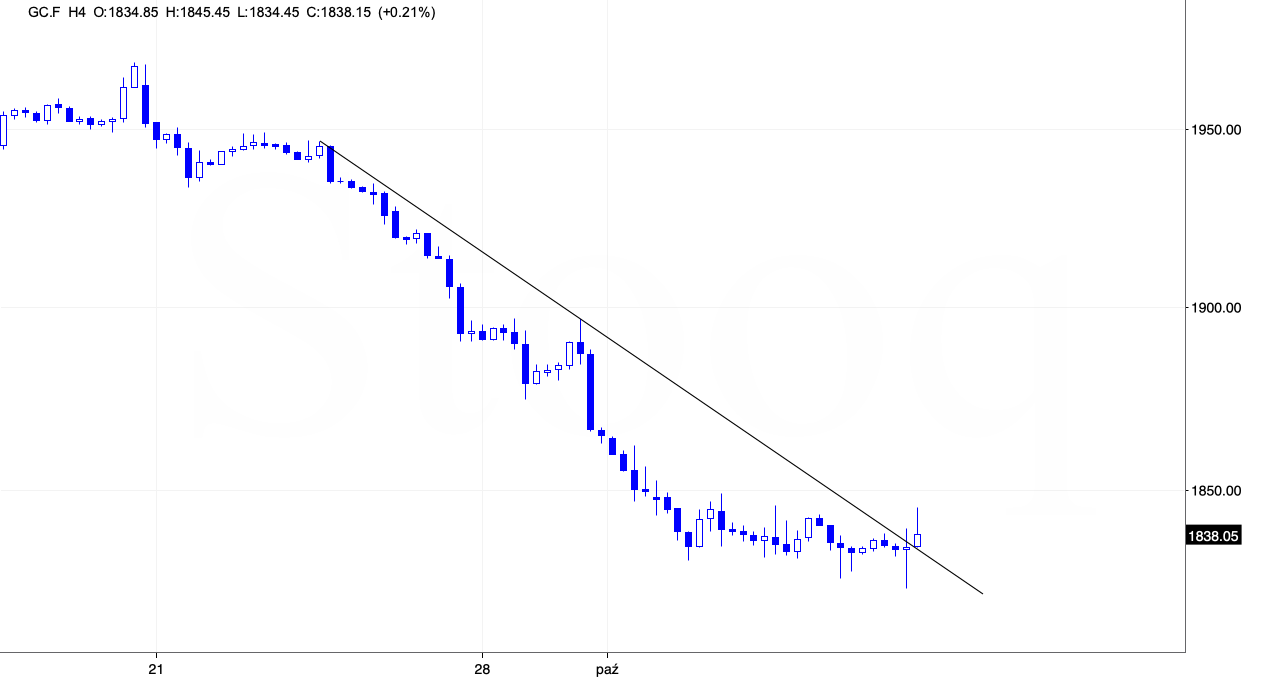
Gold is close to its downside target area, but it hasn’t reached it just yet.
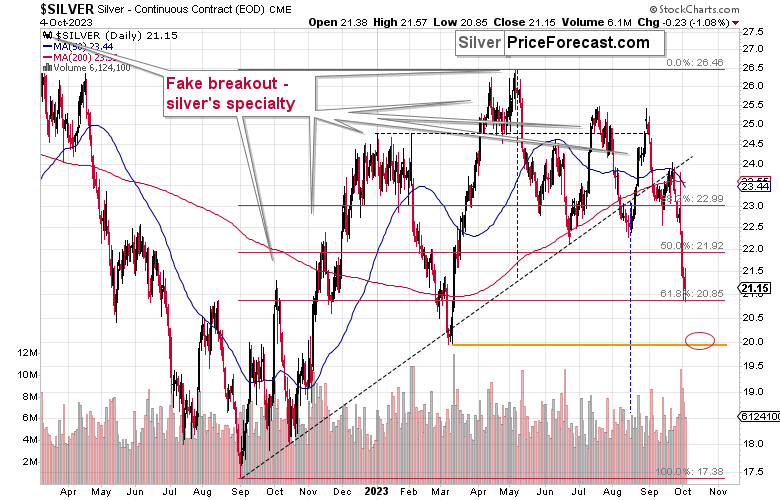
It’s the same with silver. The white metal just touched its 61.8% Fibonacci retracement level, which could mark the bottom, but please note that the 38.2% retracement didn’t really work – silver had to move below it in order to bottom.
So, the previous 2023 low seems to be the more likely downside target. And since the current pace of silver’s decline is very fast, it could indeed take just an extra one, two, or three days for this bottom to be reached. Besides, $20 is a very round number, and those numbers tend to be important support levels simply because more people pay attention to them.
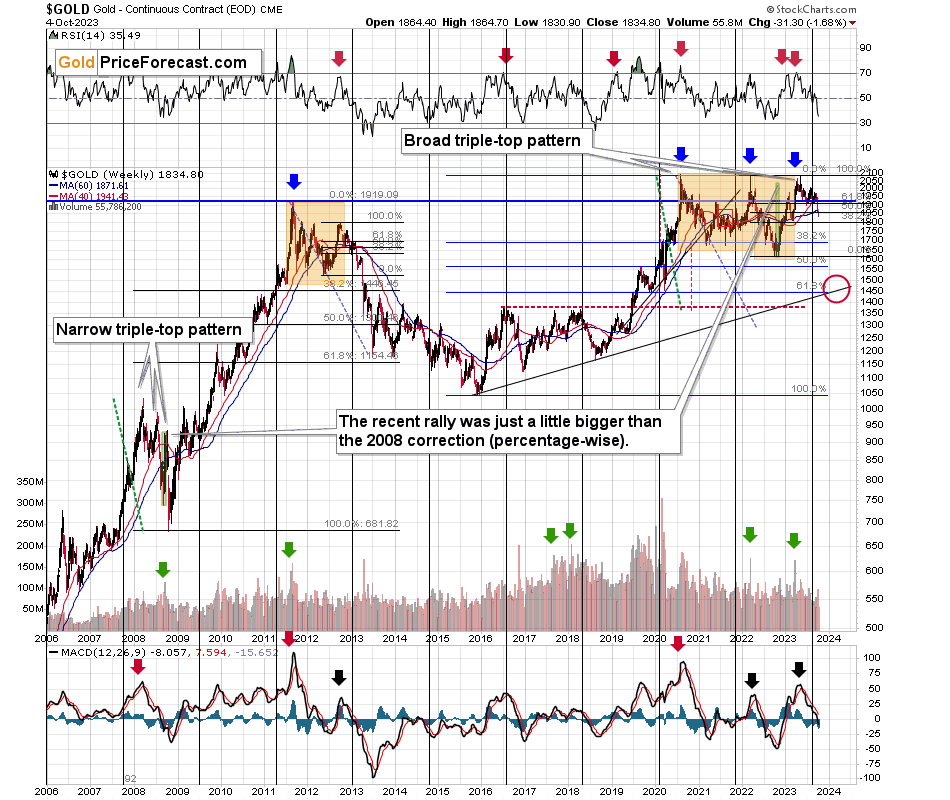
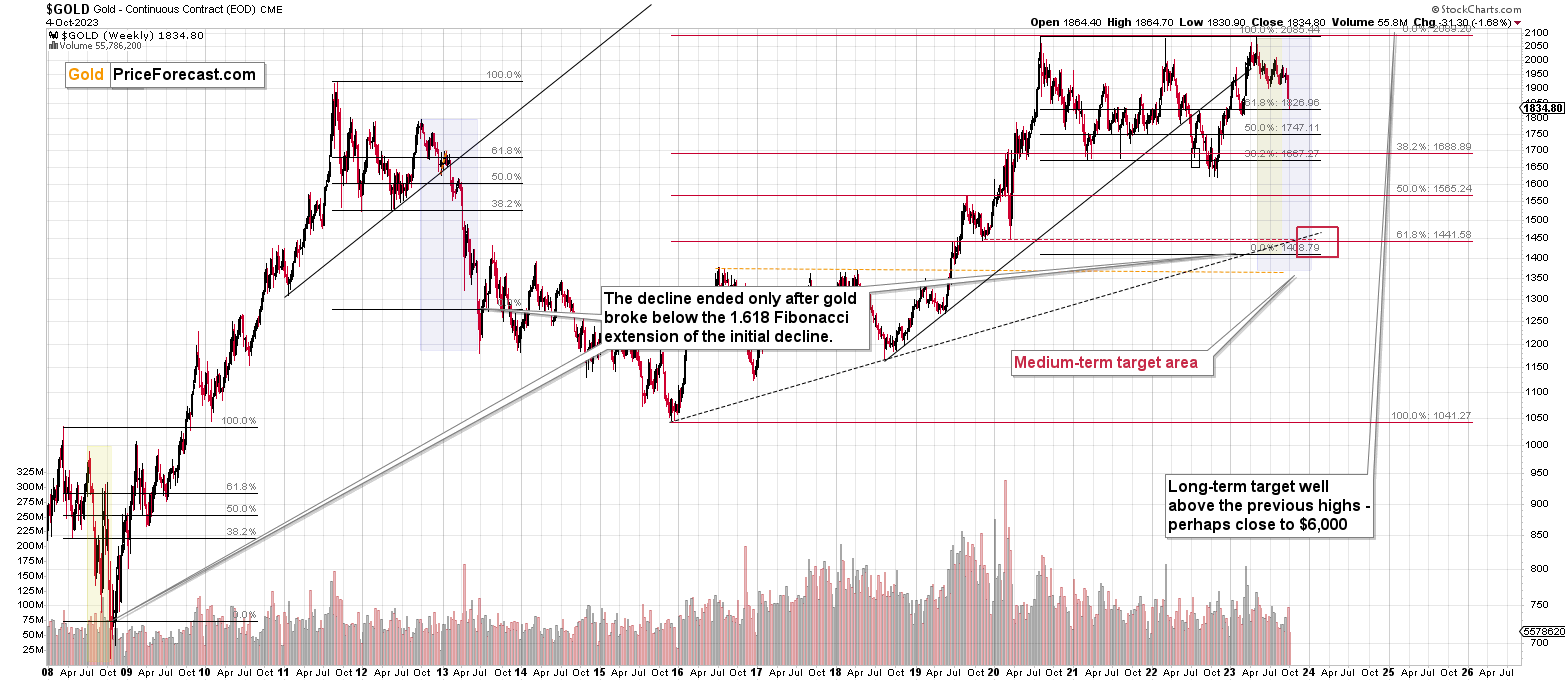
Looking at gold from the long-term perspective tells us that it is moving in tune with the analogy to 2011-2013 (marked with orange), and if the current situation is indeed just like what we saw in early 2013 (which fits the above chart, too), then gold would be likely to form a short-term bottom close to its previous bottom, then correct, and then truly slide.
Before summarizing, I’d like to show you something very important in the copper market.
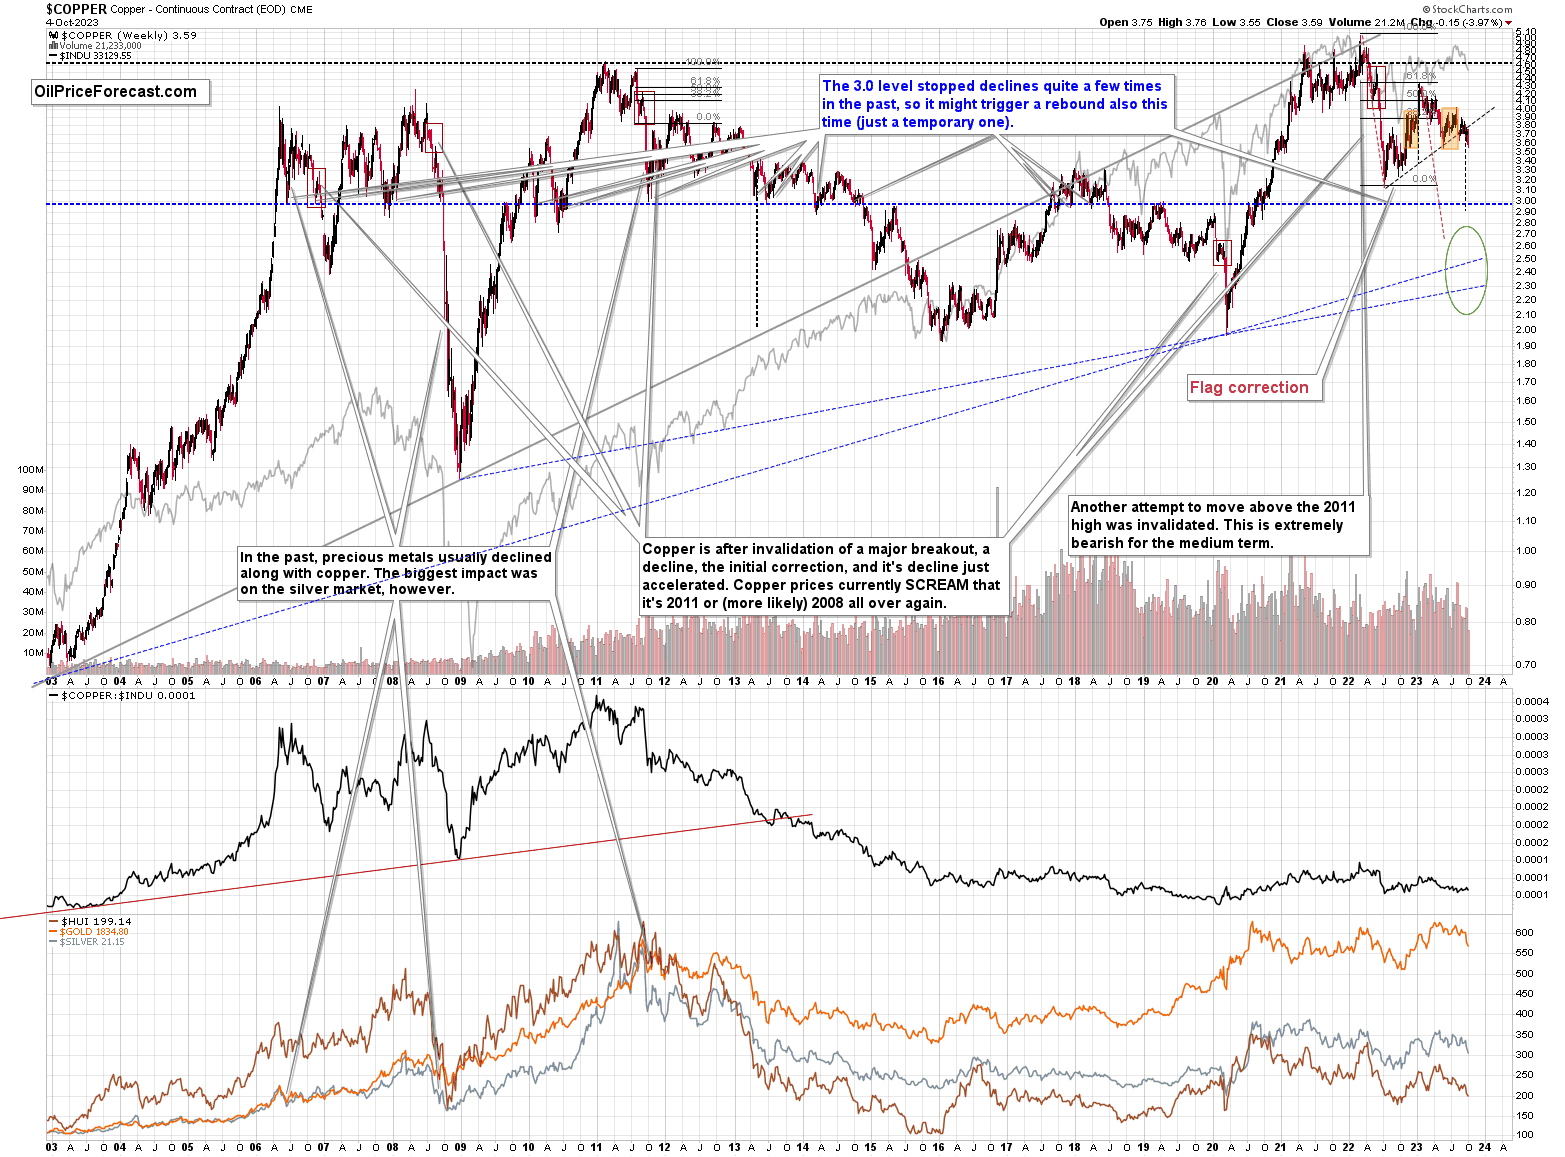
Copper price just broke decisively below its rising support line, which was also the neck level of a head and shoulders pattern. This is a major technical development that’s likely to lead to further declines. The target is at about $2.9. So, yes, copper is likely to move below its 2022 lows in the following weeks/months.
In fact, it’s likely to move much lower, but $2.9 is likely to be its first stop on the way to new lows.
And since both: gold and copper are likely to move lower, then the same is likely to be the case to a major copper and gold producer – FCX.
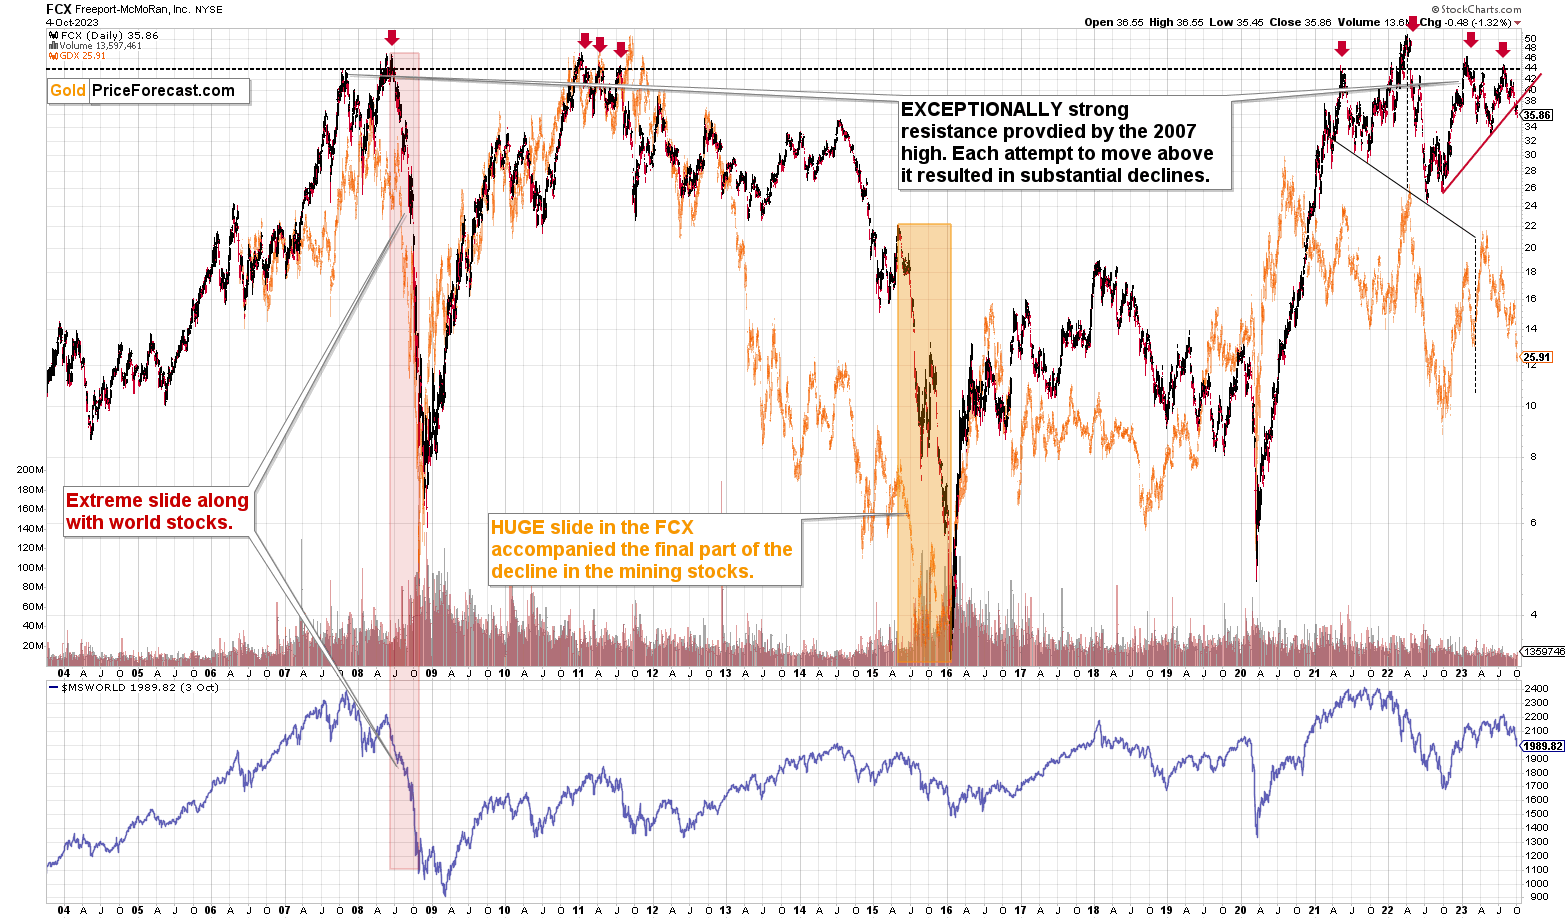
Just like copper itself, FCX is after a major breakdown, and this happened right after it tried to move above its 2007 high.
I warned that this breakout was most likely to fail – and that’s exactly what happened. FCX is likely headed to new yearly lows.
All this means that the profits in our short position are likely to increase further. The profit-take levels for this downswing have been adjusted and I also placed a protective stop-loss – “just in case”. Actually, since this ~”stop-loss” is placed below our entry for the current short position, it’s actually a specific kind of protective profit-take level.
Of course, it’s more likely that the regular profit-take level (close to $28) will be reached, and not the “protective” one.
===
If you’d like to become a partner/investor in Golden Meadow, you’ll find more details in the above link.
Overview of the Upcoming Part of the Decline
- It seems that the recent – and probably final – corrective upswing in the precious metals sector is over.
- If we see a situation where miners slide in a meaningful and volatile way while silver doesn’t (it just declines moderately), I plan to – once again – switch from short positions in miners to short positions in silver. At this time, it’s too early to say at what price levels this could take place and if we get this kind of opportunity at all.
- I plan to switch from the short positions in junior mining stocks or silver (whichever I’ll have at that moment) to long positions in junior mining stocks when gold / mining stocks move to their 2020 lows (approximately). While I’m probably not going to write about it at this stage yet, this is when some investors might consider getting back in with their long-term investing capital (or perhaps 1/3 or 1/2 thereof).
- I plan to return to short positions in junior mining stocks after a rebound – and the rebound could take gold from about $1,450 to about $1,550, and it could take the GDXJ from about $20 to about $24. In other words, I’m currently planning to go long when GDXJ is close to $20 (which might take place when gold is close to $1,450), and I’m planning to exit this long position and re-enter the short position once we see a corrective rally to $24 in the GDXJ (which might take place when gold is close to $1,550).
- I plan to exit all remaining short positions once gold shows substantial strength relative to the USD Index while the latter is still rallying. This may be the case with gold prices close to $1,400 and GDXJ close to $15 . This moment (when gold performs very strongly against the rallying USD and miners are strong relative to gold after its substantial decline) is likely to be the best entry point for long-term investments, in my view. This can also happen with gold close to $1,400, but at the moment it’s too early to say with certainty.
- The above is based on the information available today, and it might change in the following days/weeks.
You will find my general overview of the outlook for gold on the chart below:
Please note that the above timing details are relatively broad and “for general overview only” – so that you know more or less what I think and how volatile I think the moves are likely to be – on an approximate basis. These time targets are not binding nor clear enough for me to think that they should be used for purchasing options, warrants, or similar instruments.
Letters to the Editor
Please post your questions in the comments feed below the articles, if they are about issues raised within the article (or in the recent issues). If they are about other, more universal matters, I encourage you to use the Ask the Community space (I’m also part of the community), so that more people can contribute to the reply and enjoy the answers. Of course, let’s keep the target-related discussions in the premium space (where you’re reading this).
Summary
To summarize, the medium-term trend in the precious metals sector remains clearly down, and it seems that the corrective upswing is already over and the profits on our current short position are going to increase. We just caught the 10th profitable trade in a row – congratulations. The outlook for the short positions in junior miners and in the FCX remains very favorable.
===
Finally, since 10th profitable trade in a row is such a great piece of news (and the same goes for the fact that the current short position is already profitable), here’s… Even more great news! The possibility to extend your subscription for up to three years (at least by one year) with a 20% discount from the current prices is still open.
Locking in those is a great idea not only because it’s perfect time to be ready for what’s next in the precious metals market, but also because the inflation might persist longer than expected and prices of everything (including our subscriptions) are going to go up in the future as well. Please reach out to our support – they will be happy to assist you and make sure that your subscription days are properly extended at those promotional terms. So, for how many years would you like to lock-in your subscription?
To summarize:
Short-term outlook for the precious metals sector (our opinion on the next 1-6 weeks): Bearish
Medium-term outlook for the precious metals sector (our opinion for the period between 1.5 and 6 months): Bearish initially, then possibly Bullish
Long-term outlook for the precious metals sector (our opinion for the period between 6 and 24 months from now): Bullish
Very long-term outlook for the precious metals sector (our opinion for the period starting 2 years from now): Bullish
As a reminder, Gold Investment Updates are posted approximately once per week. We are usually posting them on Monday, but we can’t promise that it will be the case each week.
Our preferred ways to invest in and to trade gold along with the reasoning can be found in the how to buy gold section. Additionally, our preferred ETFs and ETNs can be found in our Gold & Silver ETF Ranking.
Moreover, Gold & Silver Trading Alerts are posted before or on each trading day (we usually post them before the opening bell, but we don’t promise doing that each day). If there’s anything urgent, we will send you an additional small alert before posting the main one.
Thank you.
Przemyslaw K. Radomski, CFA
Founder, Editor-in-chief

