

Briefly: gold and the rest of the precious metals market are likely to decline in the next several weeks/months and then start another powerful rally. Gold’s strong bullish reversal/rally despite the USD Index’s continuous strength will likely be the signal confirming that the bottom is in.
Welcome to this week's flagship Gold Investment Update.
Predicated on last week’s price moves, our most recently featured medium-term outlook remains the same as the price moves align with our expectations (and we not only took profits from the previous short position, but we profited on the rebound and made money shorting the GDXJ ETF once again). On that account, there are parts of the previous analysis that didn’t change at all in the earlier days and are written in italics.
This week was all about the Israel-Hamas war, as the risk-off event lowered U.S. Treasury yields, which helped boost the PMs. And while the crisis is unfortunate from a human and market perspective, we still exited our short position in the green. Therefore, while we think that patience is prudent right now, another long or short opportunity should materialize soon.
We’ll begin today’s alert by dissecting the fundamentals and then dive into the technical aspects that have proven so prescient over the last several months.
Scary Sights Ahead for Gold
With inflation outperformance amplifying U.S. Treasury yields and the USD Index on Oct. 12, the PMs remained under pressure from their familiar fundamental foes. Moreover, while gold bounced due to geopolitical concerns in the Middle East, the fundamentals continue to follow our medium-term roadmap.
For example, investment heavyweight PIMCO released its Cyclical Outlook report on Oct. 11. And with the firm sharing our view that inflation is old news and weak growth is the next bearish catalyst, an excerpt read:
“We forecast core inflation in the 2.5%–3% area in the U.S. and Europe at the end of 2024. We anticipate that falling growth and rising unemployment will lead to more disinflation, helped also by other factors.”
Please see below:
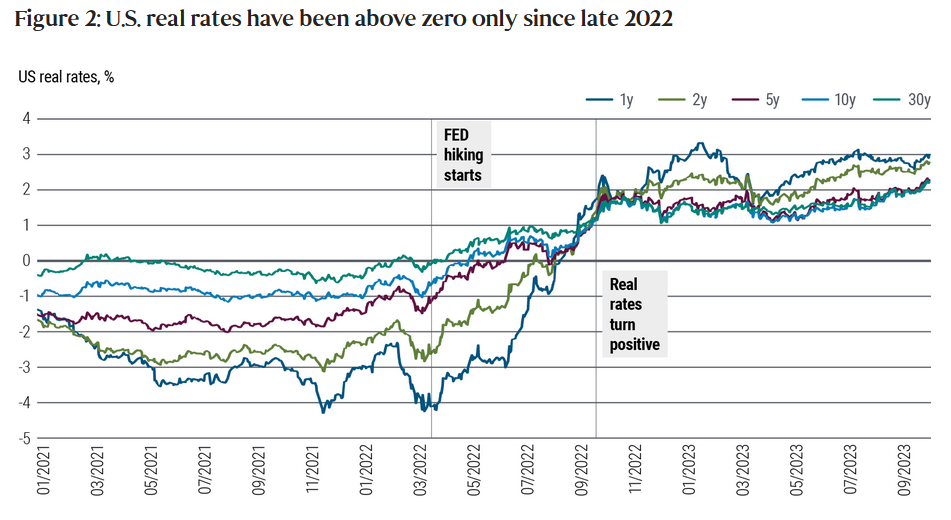
To explain, the colored lines above show how U.S. real yields remain positive across the curve and most recently made new highs when the rate surge unfolded. Moreover, we warned that non-transitory inflation would incite the Fed’s rate-hike campaign, which ultimately led to the uprising and weakness for assets like silver.
Furthermore, higher real yields have economic consequences, and those developments should cause problems in the months ahead.
PIMCO’s report added:
“We analyzed 140 tightening cycles across developed markets from the 1960s through today. When central banks hiked policy rates by 400 basis points (bps) or more – as several have done this cycle, including the U.S. Federal Reserve (Fed), the European Central Bank (ECB), and the BOE – almost all such instances ended in recession.”
Thus, while we warned that history is not on the soft landing bulls’ side, most assets are priced as if inflation will dissipate with little economic carnage. And if (when) this narrative fails, the USD Index should soar, while the PMs should suffer substantial drawdowns.
Far From a Home Run
The housing industry is already sounding the recession alarm. We warned that higher long-term interest rates (not the FFR) are responsible for negative economic growth as mortgage, auto, and other credit vehicles become more expensive.
And with the National Association of Home Builders, the Mortgage Bankers Association, and the National Association of Realtors penning a letter to Fed Chairman Jerome Powell on Oct. 9 urging him to stop raising rates, it’s another indicator of the stress hiding in plain sight. The letter stated:
“According to MBA’s latest Weekly Applications Survey data, mortgage rates have now reached a 23-year high, dragging application activity down to a low last seen in 1996. The speed and magnitude of these rate increases, and resulting dislocation in our industry, is painful and unprecedented in the absence of larger economic turmoil….
“The uncertainty-induced mortgage-to-Treasury spread is costing today’s homebuyers an extra $245 in monthly payment on a standard $300,000 mortgage. Further rate increases and a persistently widespread pose broader risks to economic growth, heightening the likelihood and magnitude of a recession.”
Please see below:
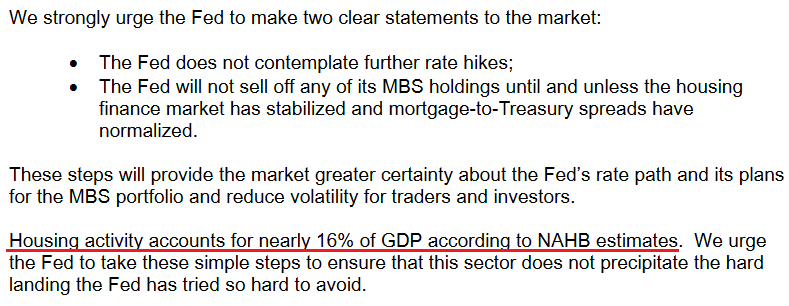
So, while we warned these realities would occur, there is little the Fed can do to remedy the situation. First, it does not control the long end of the yield curve. Second, turning dovish will only exacerbate inflation. As a result, the longer long-term rates stay high, the more they will stress consumers and economic growth and increase the chances of a recession. As such, oil could be in big trouble over the medium term.
Finally, the FOMC released the minutes from its Sep. 19-20 monetary policy meeting. And while the commentary was balanced, an important statement read:
“All participants agreed that policy should remain restrictive for some time until the Committee is confident that inflation is moving down sustainably toward its objective.”
In other words, the Fed must remain hawkish to avoid another inflation spike, and economic growth should be the main casualty of their persistence. And as history shows, silver and mining stocks typically suffer the most when economic-induced volatility erupts.
Overall, another interest rate spike occurred on Oct. 12, and a sea of red confronted several risk assets. Yet, this means long-term interest rates will continue to suffocate the real economy, and the S&P 500 should crumble when the full effects become obvious.
Yields Pop and Silver Drops
While the crowd remains fixated on inflation, we’ve moved on from that fundamental thesis. In 2021, when the consensus assumed inflation was transitory, we warned it would strike with a vengeance. And now, while the consensus assumes that long-term interest rates can rise indefinitely without any economic scarring, we’re fading that narrative, too. As it stands, silver’s next major slide could occur alongside lower, not higher, interest rates.
As evidence, the NFIB released its Small Business Optimism Index on Oct. 12. And with the headline metric declining from 91.3 in August to 90.8 in September, early signs of demand destruction are present. NFIB Chief Economist Bill Dunkelberg said:
“Owners remain pessimistic about future business conditions, which has contributed to the low optimism they have regarding the economy. Sales growth among small businesses have slowed and the bottom line is being squeezed, leaving owners few options beyond raising selling prices for financial relief.”
Thus, while we warned on numerous occasions that higher long-term interest rates are a much different animal than a higher FFR, 2023’s fundamentals contrast 2021 and 2022.
Please see below:
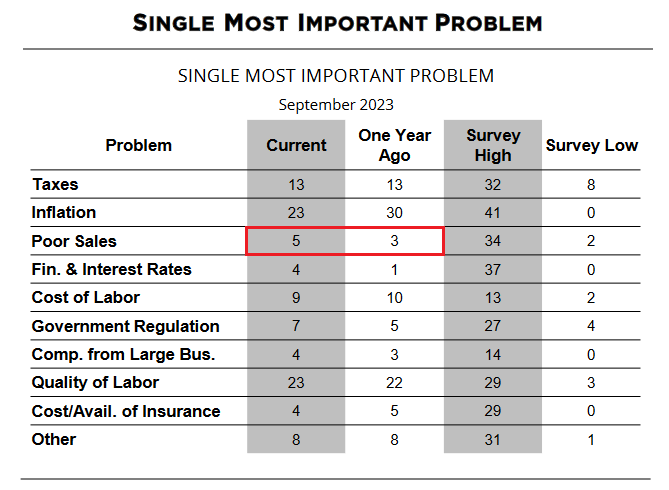
To explain, we faded the recession narratives in 2021 and 2022 because (in part) NFIB respondents’ ‘single most important problems’ were inflation and the cost of labor, while poor sales were non-existent.
But that relationship has flipped. Fewer participants are worried about output and wage inflation than in September 2022, while more are worried about poor sales. Furthermore, the divergence should only worsen with long-term interest rates increasing, and a potential recession is bearish for gold.
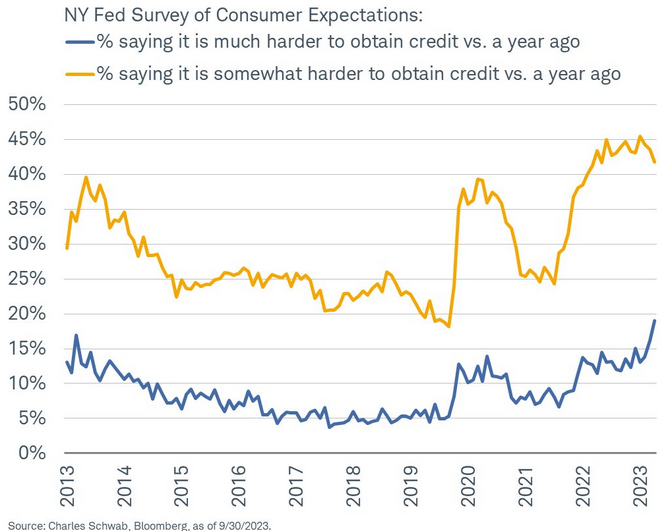
To that point, the recent spike in long-term rates has made it more difficult for Americans to obtain credit. The New York Fed’s latest Survey of Consumer Expenditures (SCE) showed that the percentage of respondents claiming it’s much harder to borrow money now than a year ago hit a survey high (the blue line below).
Please see below:
Credit Concerns
While ominous metrics are noticeable beneath the surface, the crowd continues to assume that little economic damage lies ahead. And with the crude oil price still relatively uplifted, demand destruction is considered a low-probability event. However, with delinquency rates rising dramatically across riskier lenders, higher interest rates should only exacerbate the problem.
Please see below:
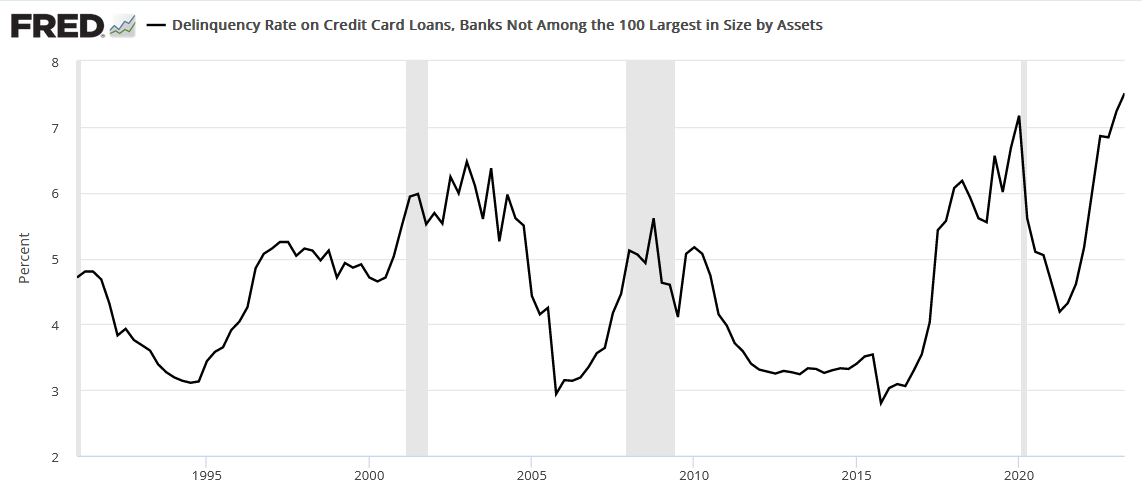
To explain, the delinquency rate on credit card loans issued by banks outside of the top 100 hit an all-time high dating back to 1991. Moreover, smaller banks often make loans to less creditworthy borrowers, which highlights the stress that should continue as the economy weakens. And if (when) market volatility strikes, it should boost the USD Index.
Finally, while interest rates are the main problem, it’s essential not to overlook the effects of quantitative tightening (QT). While the policy has become an afterthought, global central banks continue to drain liquidity from the system, and the development should have profound consequences in 2024.
Please see below:
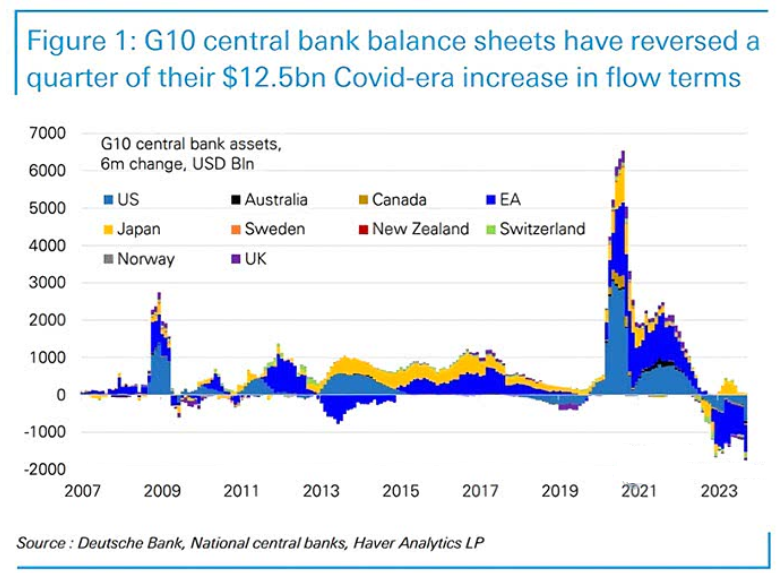
To explain, the various bars above highlight the increases and decreases in G10 central banks’ balance sheets. If you analyze the right side of the chart, you can see that a sustained drawdown is present. Moreover, the drought should continue until inflation magically disappears or a recession unfolds. And if history is any indication, the latter is much more likely than the former.
Overall, the fundamental landscape remains aligned with our expectations. Recessions occur due to the cumulative effect of various cuts, similar to chopping down a tree with an axe. And if (when) a crash eventually occurs, the S&P 500 should come under heavy pressure, and silver and mining stocks should experience significant drawdowns.
The Bottom Line
Rates roared again on Oct. 12, and risk assets ran in the opposite direction. But, while the PMs have suffered recently, their final lows are likely still ahead. Moreover, asset prices rarely move in a straight line, which means that risk is elevated when technical, economic, and geopolitical crosscurrents are present. Therefore, it’s prudent to wait until the outlook is clearer before deploying our capital.
In conclusion, the PMs declined on Oct. 12 as the bond market sell-off rippled through the system. Yet, plenty of opportunities should arise as volatility increases during the fall and winter months.
Technically Speaking
The current outlook remains rather bullish for the short term and extremely bearish for the medium term, which means that yesterday’s technical comments remain up-to-date, and thus, I’m quoting yesterday’s analysis in its entirety. There is one chart that I would like to update you on beforehand, though, and that’s the hourly chart of the GDXJ ETF.
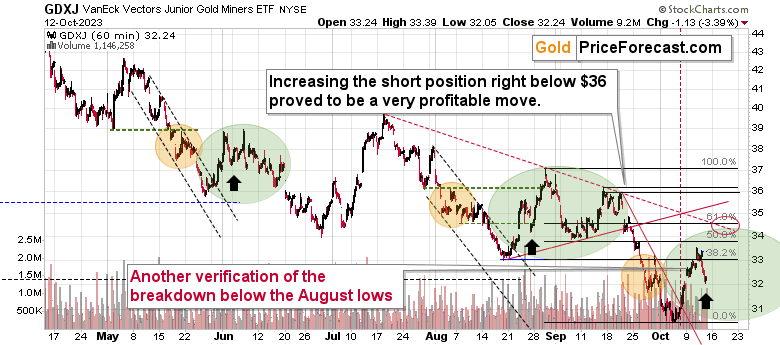
The GDXJ ETF declined by over 3% yesterday, which might seem bearish, but at this time – given Wednesday’s invalidations in miners and stocks – it’s not clear if this breakdown can be trusted.
The above chart features an additional reason for this lack of trust. The thing is that the current quick decline is extremely similar to the declines that we saw in the middle of the previous short-term corrective upswings.
I marked all of them with green ellipses. They all followed a bottom that was preceded by decline, which in turn was preceded by a consolidation that I marked with orange. The situations are simply alike. Yesterday’s decline was just like the declines that happened in the middle of the previous corrective upswings, and I marked that with black arrows.
This has bullish, not bearish implications. Consequently, the gist of yesterday’s analysis remains up-to-date:
“
The precious metals sector and the stock market rallied once again yesterday, invalidating critical breakdowns. How high can they rally now?
Let’s jump right into charts.
The GDXJ ETF – a proxy for junior mining stocks – moved considerably higher this week, and it’s no wonder – the conflict in the Middle East keeps getting worse. The key technical detail arrived yesterday.
Namely, juniors moved and closed above their rising red resistance line and their August lows. Invalidation of the breakdown below the neck level of the head-and-shoulders formation is generally a buy signal.
Consequently, the outlook for the very short term (next 1-2 weeks) just became bullish.
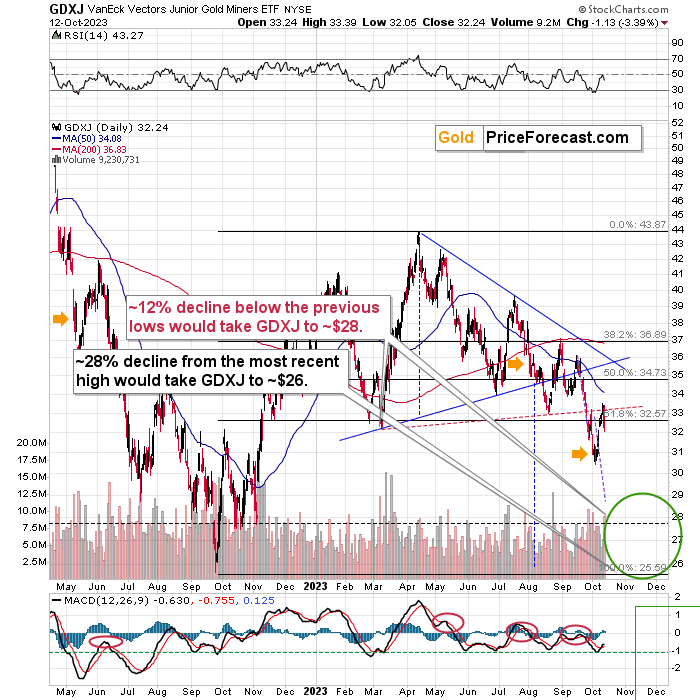
What does it change for the medium-term outlook? Absolutely nothing. Just like mining stocks were likely to slide, they are likely to slide in the following months, regardless of Wednesday’s invalidation.
The only thing that changed is the near-term outlook. Instead of seeing a slide all the way down to $28, a move higher now became the likely outcome. So, how high can the GDXJ go before it returns to its massive, medium-term downtrend?
Based on the above chart, it could rally to about $35.7 because that’s where the two blue resistance lines cross. And since the vertex of the triangle created by those lines is on Oct. 20, it would seem quite natural if the reversal takes place then.
That’s one of the targets. Let’s zoom in and check what other targets we have based on more short-term indications.
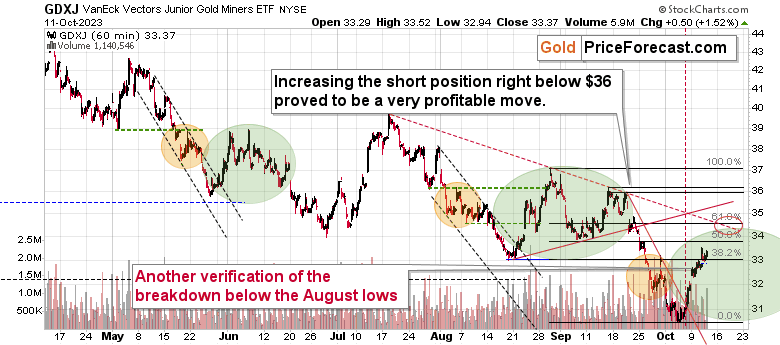
Based on GDXJ’s hourly chart, it seems that they are between $34 and $35 (in particular, the middle thereof – the $34.5 level). That’s where we, approximately, have the 61.8% Fibonacci retracement based on the September – October decline and where the declining, short-term resistance line currently is. Additional resistance levels are at about $35.5 (the rising red resistance line) and at $36 – at the late-September highs.
Two targets stand out: the ~$34.5 level and the ~$35.5 - $35.7 area.
Since we also have the triangle-vertex-based reversal point on Oct. 20, the price at which the GDXJ will be trading on this day (or close to it), will likely serve as the final price for this rally.
So, if the GDXJ trades at about $34.5 in a few days, then it might not be the final top (unless we see other major sell signals, like silver’s strong performance of an intraday reversal that takes place on very strong volume). But if it does the same on Oct. 19, it will probably be the top. Of course, we’ll keep you – our subscribers – informed.
Having said that, let’s move to gold.
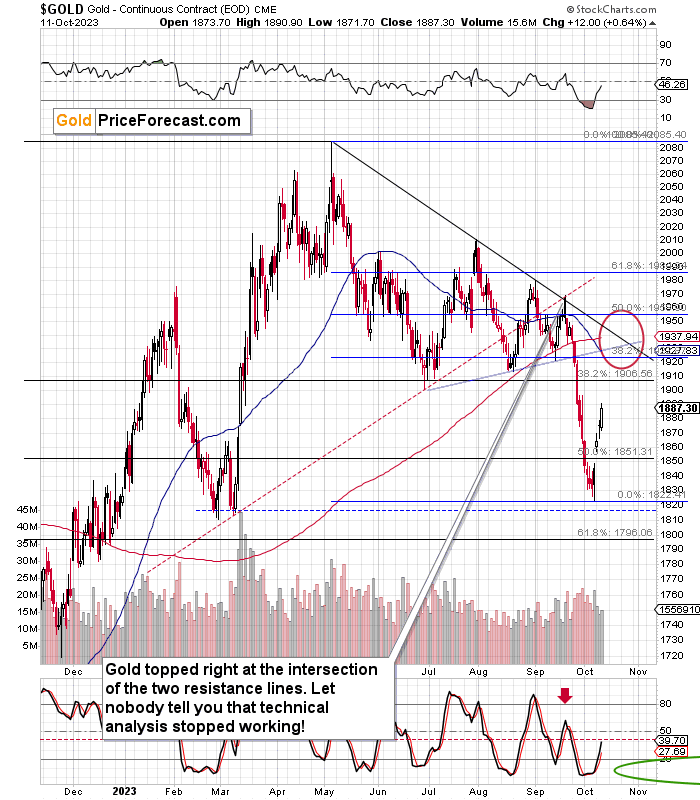
Gold soared visibly, as it’s the part of the precious metals market that is viewed as a safe haven. Silver and miners are connected to gold, so they move similarly, but it is the yellow metal that’s been associated with the ability to protect one against major turmoil.
How high can gold go here? I’d say that the $1,900 - $1,920 area is quite likely to be where gold tops, but I wouldn’t rule out a scenario in which gold has to move to almost $1,960 before it reverses. It will depend on how the situation develops in the Middle East. Mining stocks are likely to be less vulnerable to it, especially as the rally continues. Please remember that miners tend to underperform gold when the rally is close to its end (while silver tends to outperform at those times).
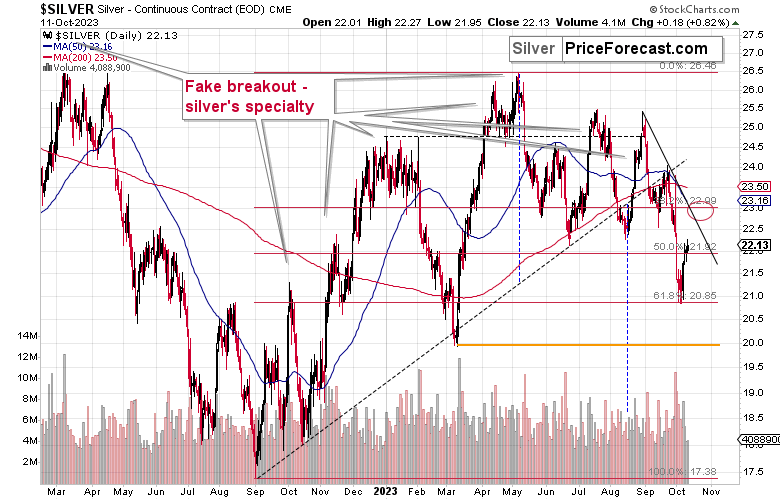
The upside target for silver is not as clear as the above picture might suggest.
On the one hand, silver has a combination of resistance levels at about $23, but on the other hand, silver is known for its fake breakouts. Consequently, it might be the case that silver breaks above $23, and it will be the shorting opportunity for the entire precious metals sector.
Now, as the title of today’s analysis suggests, something important happened in the general stock market.
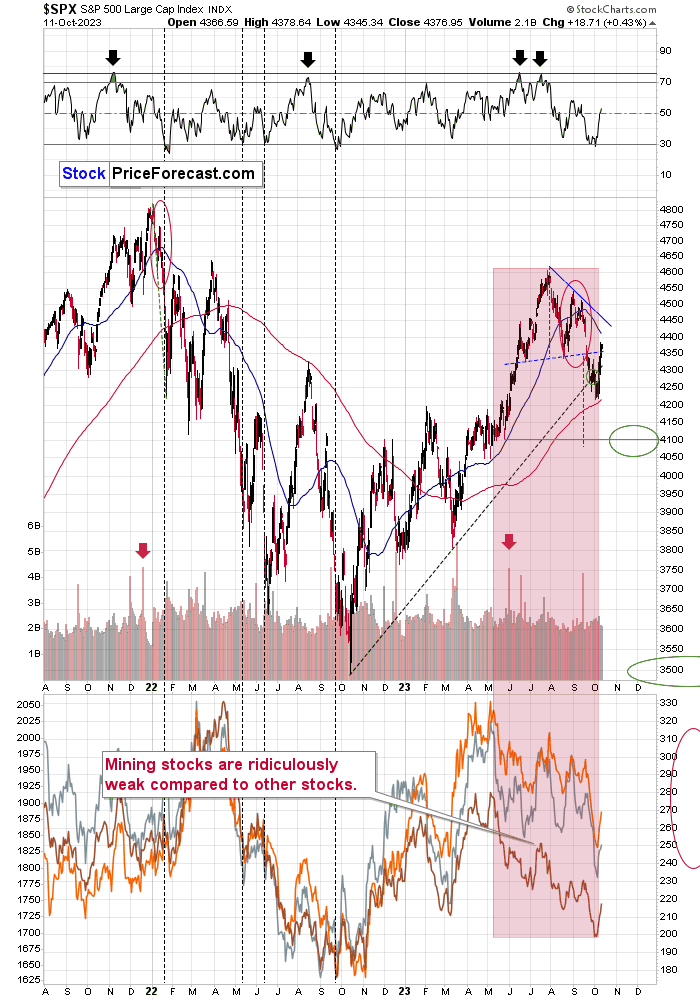
The S&P 500 Index just invalidated its breakdown below the neck level of the head and shoulders pattern. This is a bullish indication, and it’s a sign pointing to higher stock prices.
I don’t view this as a really major bottom because the interest rates are still high, and they are likely to remain high, thus creating a difficult economic environment, which is likely to lead to a bigger decline in stocks.
However, just because something is likely to happen (like silver soaring above $100) doesn’t mean that it’s likely to happen immediately or shortly (the above scenario is still in the cards for silver, it’s just not likely to happen this year).
In the case of stocks, this means that in the next several days, we’re likely to see higher stock prices. They might top close to 4,450, as that’s where see the declining blue resistance line. This would fit the scenario in which mining stocks (and the rest of the precious metals sector also moved higher). As we recently took profits from our short positions in junior miners, it seems that the above would provide us with an opportunity to re-enter those positions at higher prices.
Don’t let the short-term rally fool you – the main trend in stocks remains down, and the world stock chart confirms it.
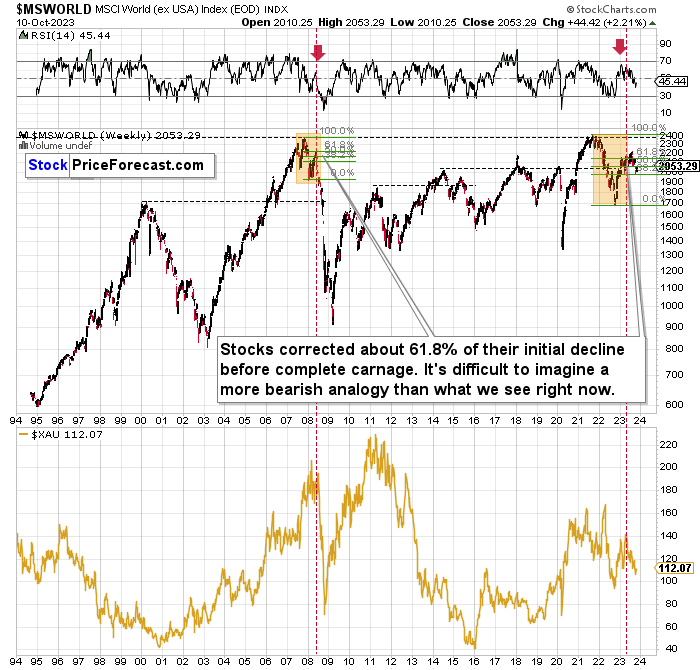
The situation right now is just like it was in 2008, right before the enormous, very volatile slide. The price itself (its shape) and RSI confirm that. The implications for mining stocks (visible on the lower part of the above chart) remain extremely bearish. The main difference between the two situations is that this time, miners start from much lower levels (even though gold is much higher).
Also, while we’re focusing on the big picture, let’s take a look at what the junior mining stocks are doing from the really long-term point of view.
Enter the Toronto Stock Exchange Venture Index. That’s also a proxy for junior miners because so many juniors are included in this index.
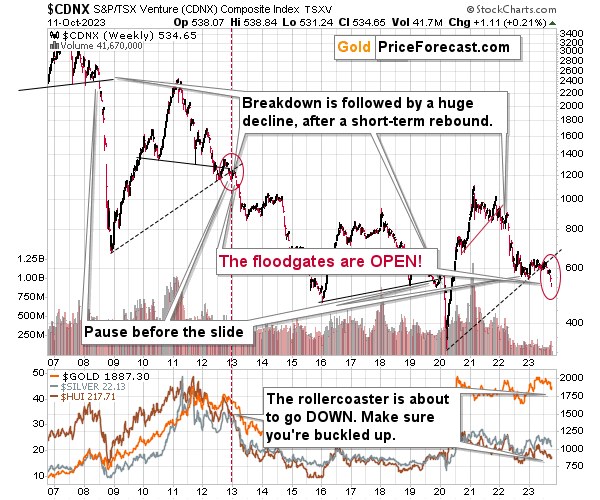
In short, the index is in a freefall. After the breakdown below the rising, long-term support line that happened earlier this year, juniors plunged. The same happened in early 2013.
The mining stocks then declined in the medium term while correcting every now and then. That’s exactly what we see now, and it puts the current move higher in the proper perspective.
This is not a change in the big downtrend – it’s part thereof.
Also, if you look at the long-term picture featuring the ratio between gold stocks and the general stock market, you’ll see that the recent rally was… Pretty much absent.
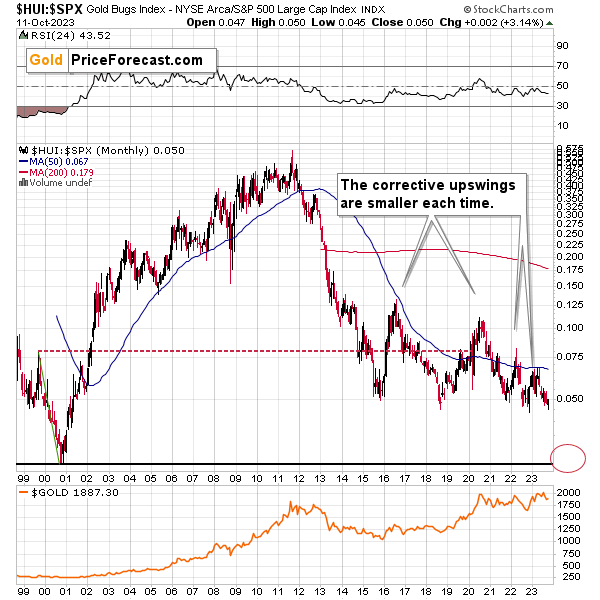
The HUI to S&P 500 ratio is on the verge of a massive breakdown. The corrections have been smaller and smaller, and this time, it seems that the ratio is ready to fall substantially once again. If it slides similarly to how it declined in 2008, we’re likely to see it at the levels of its all-time low – at about 0.025.
The implications of mining stocks are extremely bearish for the following months – regardless of what happens this and next week (actually, a rally in the precious metals sector in the very short term is quite likely here). It’s great to have a plan on when to short the market again, though – and we do have it.
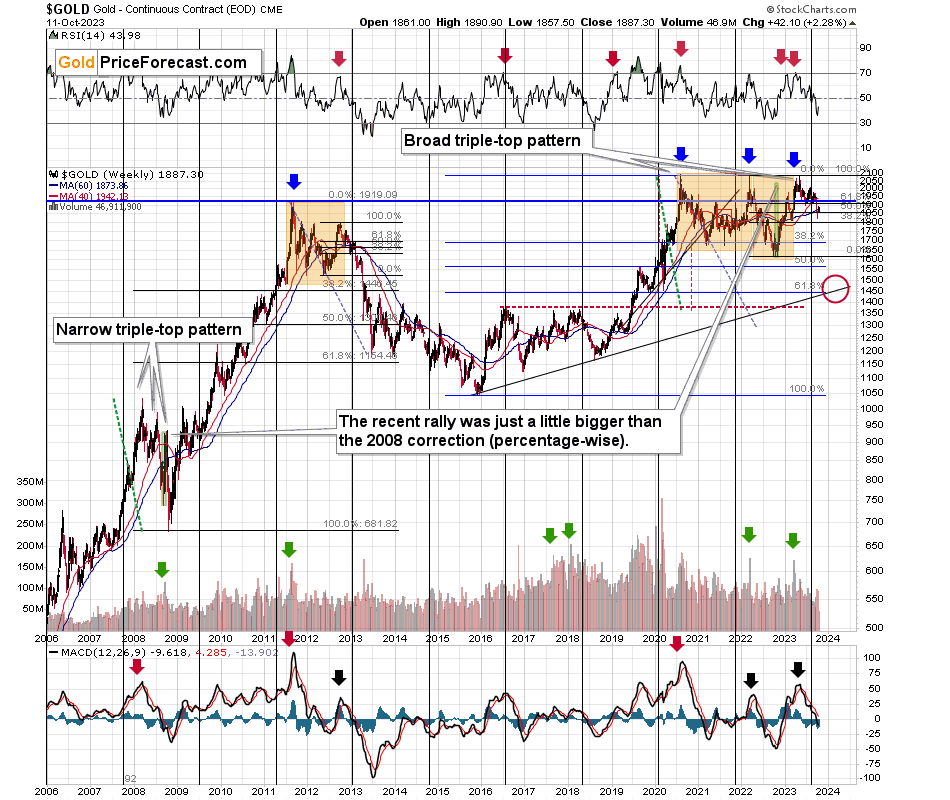
From the long-term point of view, the analogy in gold between now and 2013 remains intact. There were short-term corrections in early 2013, before the biggest part of the slide, so seeing a corrective upswing right now is normal.
Having said that, let’s take a look at the USD Index.
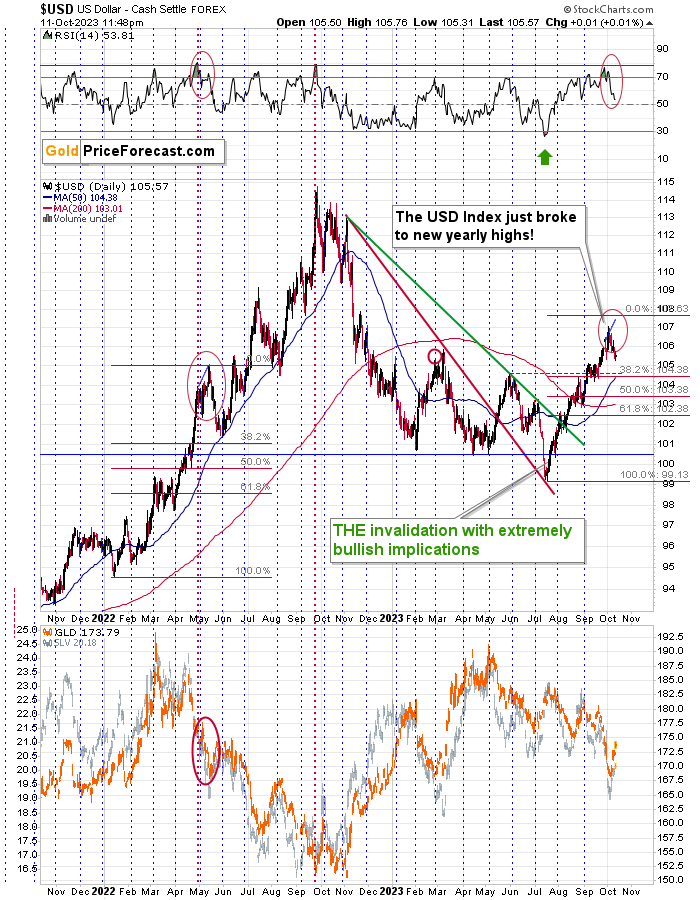
Based on how far the USDX declined and how long the decline is taking place, it seems that this is already the main correction within the downtrend, not the quick pullback that would be analogous to what we saw in early May 2022. Consequently, the USDX might decline to about 104.5 (the 38.2% Fibonacci retracement, the May/June high, and September lows). This would fit another very short-term upswing in the precious metals market.
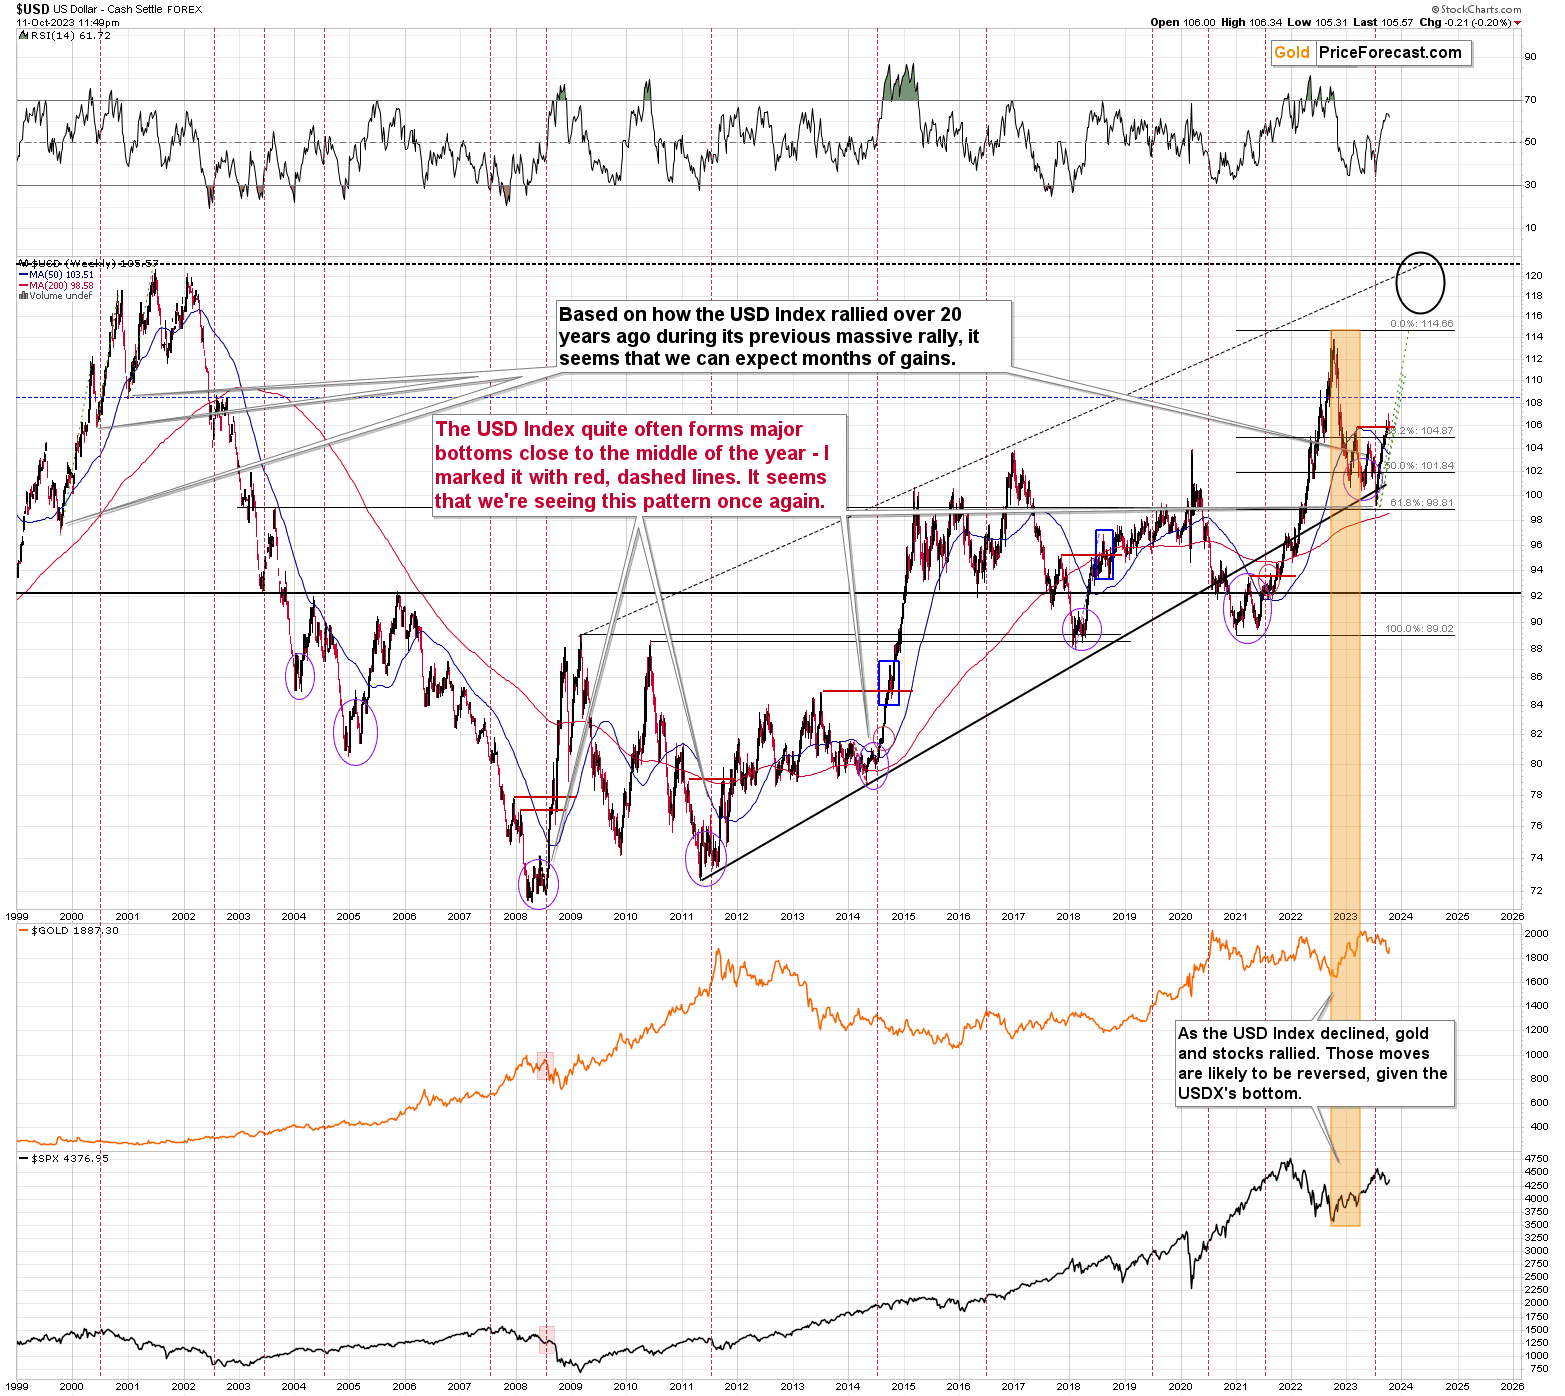
From the long-term point of view, we see that the USD Index has been rallying very sharply recently, so seeing a pullback here is natural – it doesn’t change the main medium-term trend, which remains up.
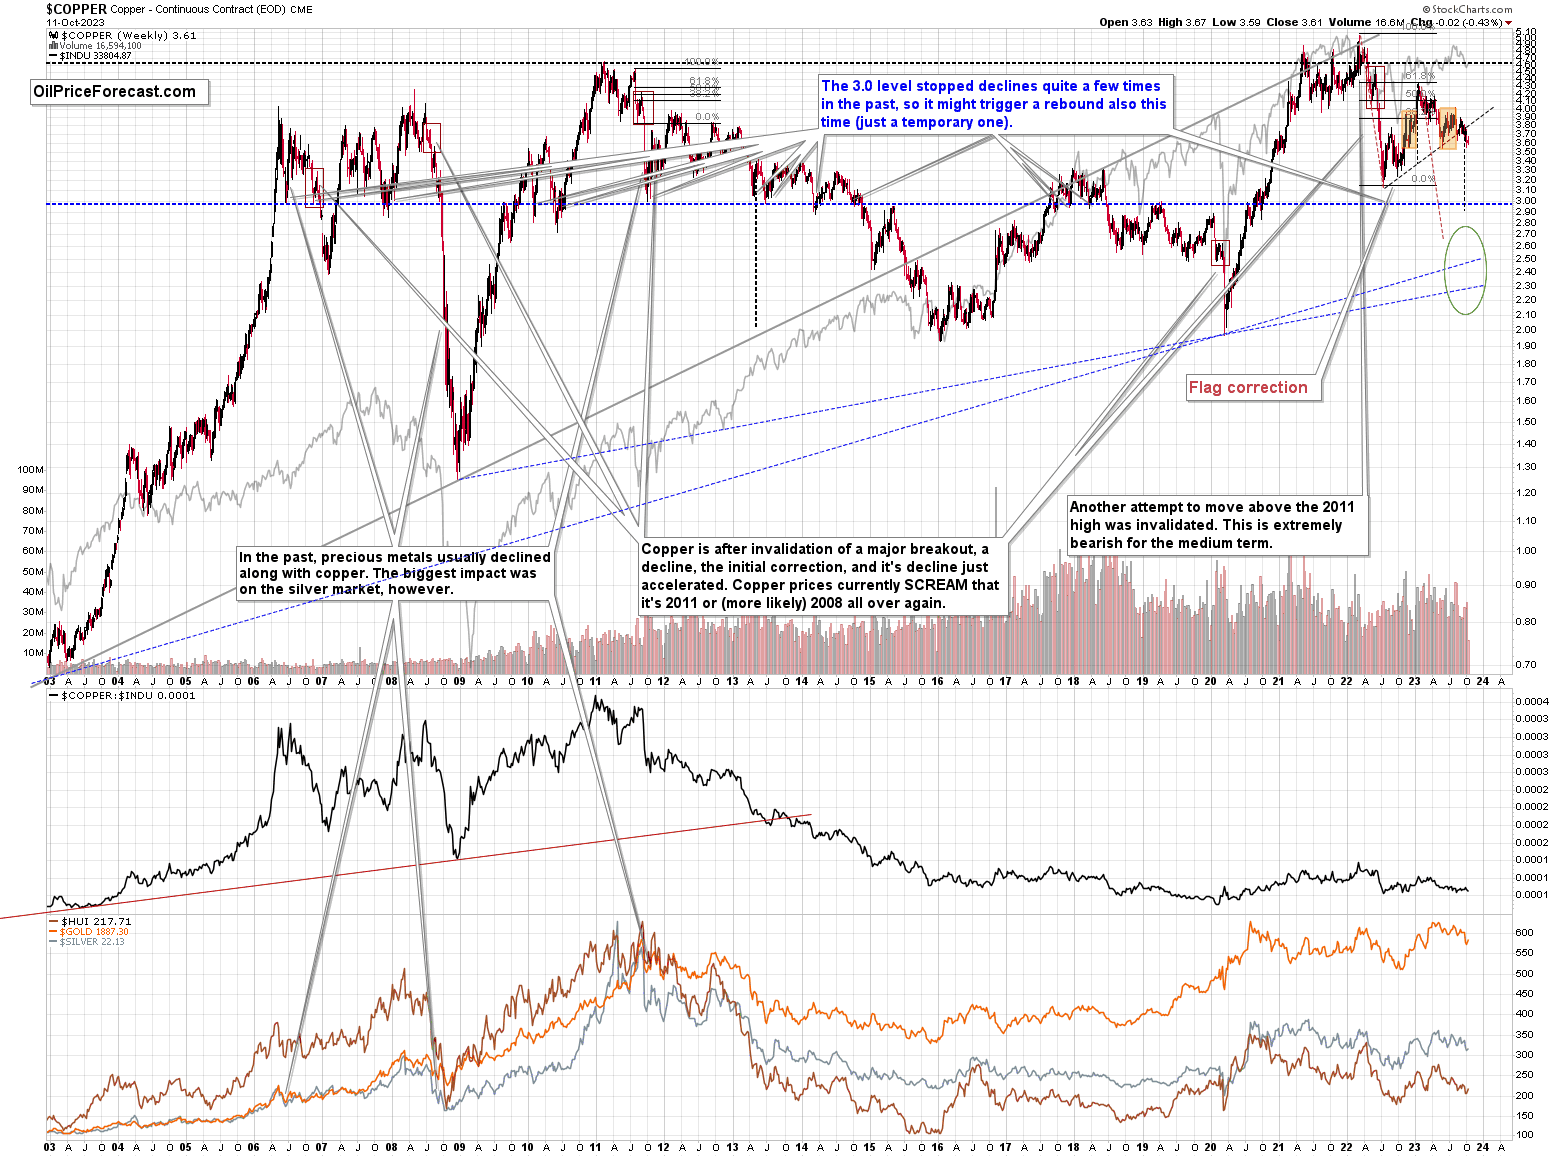
Meanwhile, copper moved a bit higher recently, but very insignificantly so. It remains below its rising resistance line, and since the breakdown below it was already confirmed, the outlook remains bearish.
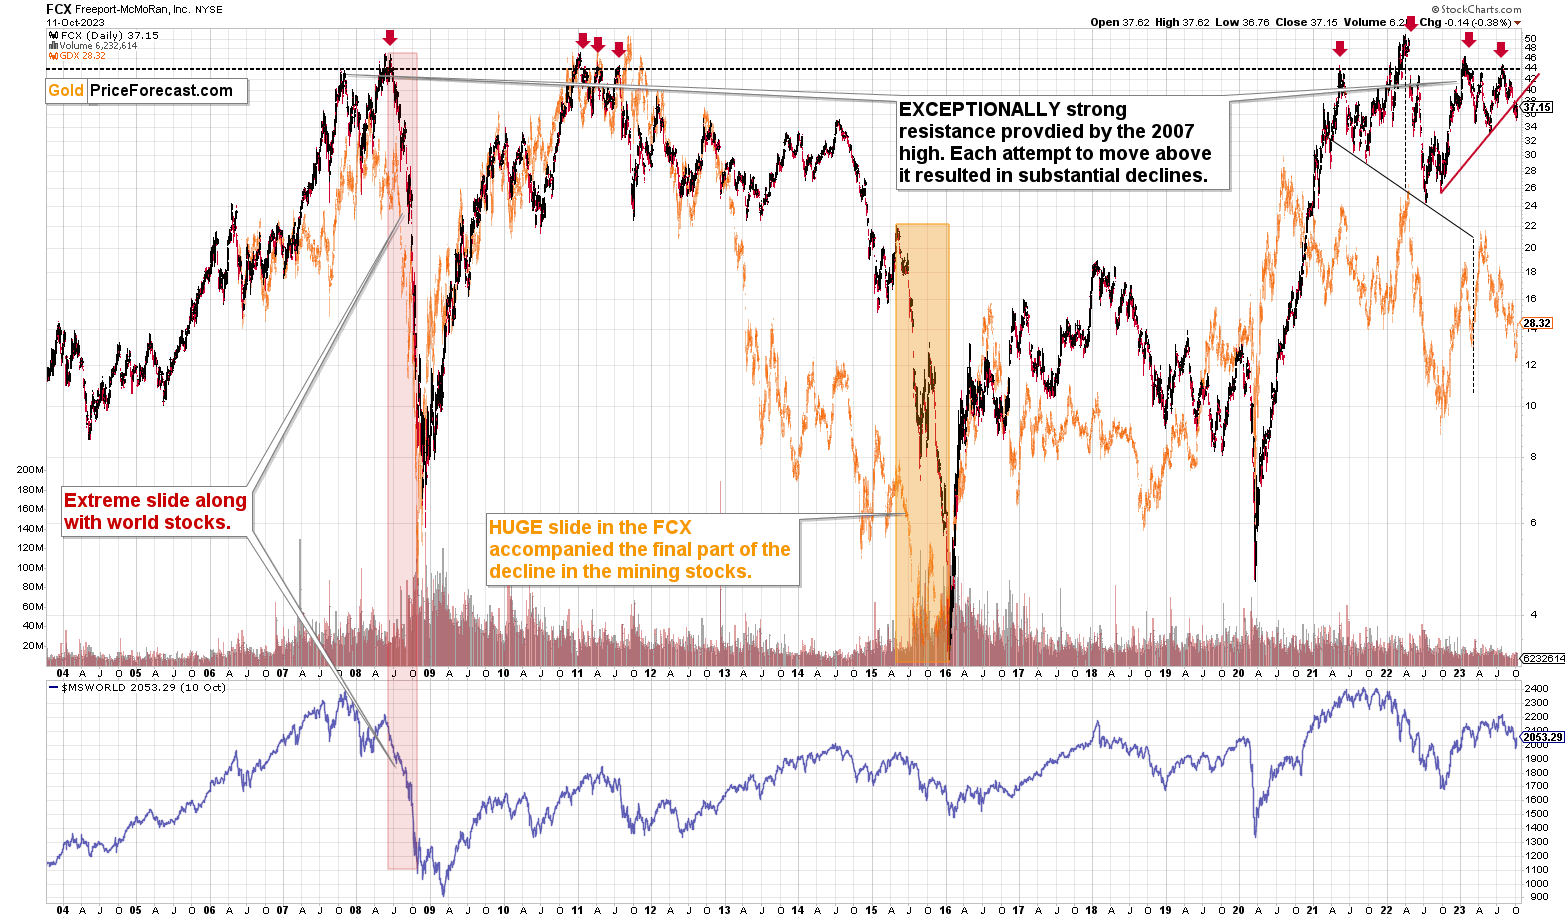
The same goes for the big copper and gold producer – FCX. It corrected a bit after breaking below the rising, red resistance line, but the breakdown wasn’t invalidated. The outlook remains clearly bearish.
What does it all mean for the precious metals market? That the extremely bearish outlook remains in place for the medium term, and thanks to the bullish outlook for the very short term, it seems that we’ll be able to re-enter our short positions at higher levels, which would imply increasing our overall profits from the medium-term decline.
“
As always, we’ll keep you – our subscribers – informed.
===
If you’d like to become a partner/investor in Golden Meadow, you’ll find more details in the above link.
Overview of the Upcoming Part of the Decline
- It seems that the recent – and probably final – corrective upswing in the precious metals sector is over.
- If we see a situation where miners slide in a meaningful and volatile way while silver doesn’t (it just declines moderately), I plan to – once again – switch from short positions in miners to short positions in silver. At this time, it’s too early to say at what price levels this could take place and if we get this kind of opportunity at all.
- I plan to switch from the short positions in junior mining stocks or silver (whichever I’ll have at that moment) to long positions in junior mining stocks when gold / mining stocks move to their 2020 lows (approximately). While I’m probably not going to write about it at this stage yet, this is when some investors might consider getting back in with their long-term investing capital (or perhaps 1/3 or 1/2 thereof).
- I plan to return to short positions in junior mining stocks after a rebound – and the rebound could take gold from about $1,450 to about $1,550, and it could take the GDXJ from about $20 to about $24. In other words, I’m currently planning to go long when GDXJ is close to $20 (which might take place when gold is close to $1,450), and I’m planning to exit this long position and re-enter the short position once we see a corrective rally to $24 in the GDXJ (which might take place when gold is close to $1,550).
- I plan to exit all remaining short positions once gold shows substantial strength relative to the USD Index while the latter is still rallying. This may be the case with gold prices close to $1,400 and GDXJ close to $15 . This moment (when gold performs very strongly against the rallying USD and miners are strong relative to gold after its substantial decline) is likely to be the best entry point for long-term investments, in my view. This can also happen with gold close to $1,400, but at the moment it’s too early to say with certainty.
- The above is based on the information available today, and it might change in the following days/weeks.
You will find my general overview of the outlook for gold on the chart below:
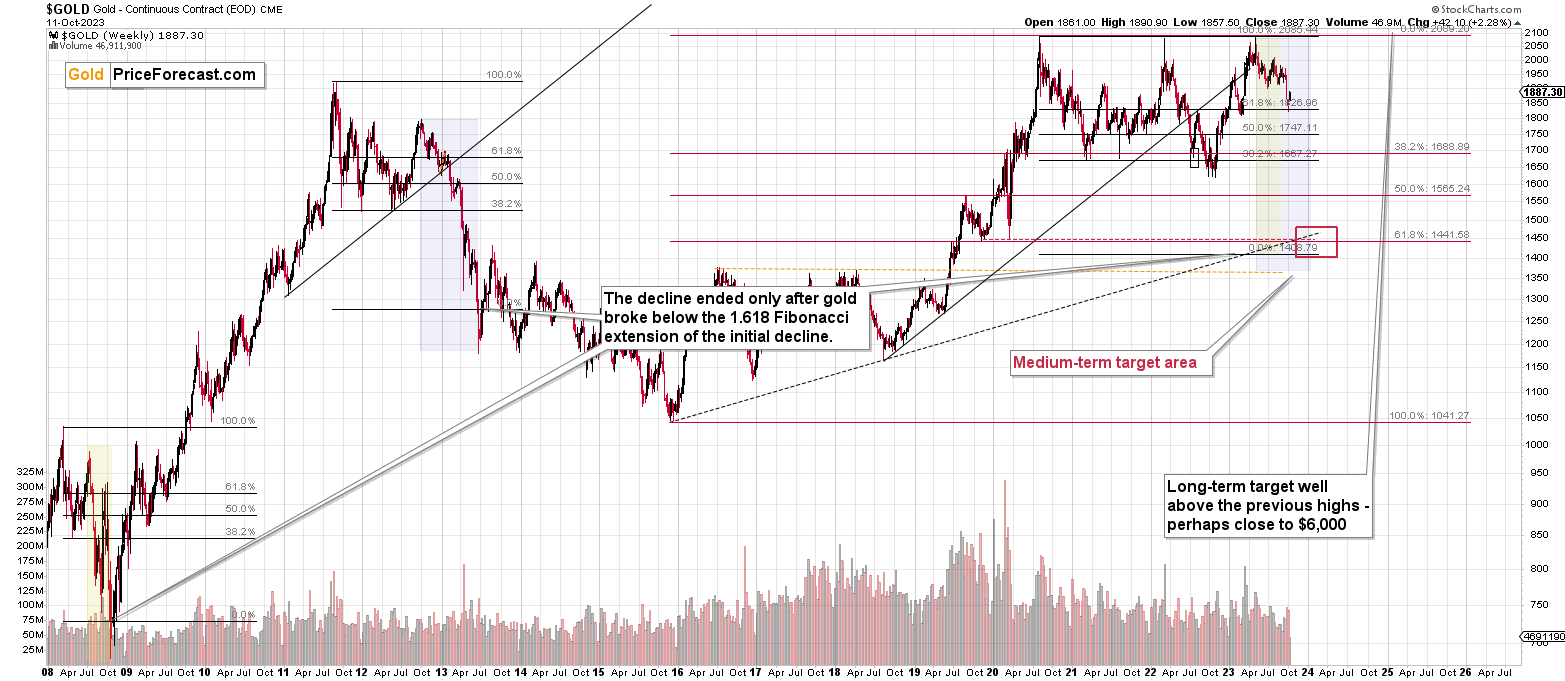
Please note that the above timing details are relatively broad and “for general overview only” – so that you know more or less what I think and how volatile I think the moves are likely to be – on an approximate basis. These time targets are not binding nor clear enough for me to think that they should be used for purchasing options, warrants, or similar instruments.
Letters to the Editor
Please post your questions in the comments feed below the articles, if they are about issues raised within the article (or in the recent issues). If they are about other, more universal matters, I encourage you to use the Ask the Community space (I’m also part of the community), so that more people can contribute to the reply and enjoy the answers. Of course, let’s keep the target-related discussions in the premium space (where you’re reading this).
Summary
To summarize, the medium-term trend in the precious metals sector remains clearly down, and it seems that the corrective upswing is already over and the profits on our current short position are going to increase. We just caught the 10th profitable trade in a row – congratulations. The outlook for the short positions in junior miners and in the FCX remains very favorable.
===
Finally, since 10th profitable trade in a row is such a great piece of news (and the same goes for the fact that the current short position is already profitable), here’s… Even more great news! The possibility to extend your subscription for up to three years (at least by one year) with a 20% discount from the current prices is still open.
Locking in those is a great idea not only because it’s perfect time to be ready for what’s next in the precious metals market, but also because the inflation might persist longer than expected and prices of everything (including our subscriptions) are going to go up in the future as well. Please reach out to our support – they will be happy to assist you and make sure that your subscription days are properly extended at those promotional terms. So, for how many years would you like to lock-in your subscription?
To summarize:
Short-term outlook for the precious metals sector (our opinion on the next 1-6 weeks): Bearish
Medium-term outlook for the precious metals sector (our opinion for the period between 1.5 and 6 months): Bearish initially, then possibly Bullish
Long-term outlook for the precious metals sector (our opinion for the period between 6 and 24 months from now): Bullish
Very long-term outlook for the precious metals sector (our opinion for the period starting 2 years from now): Bullish
As a reminder, Gold Investment Updates are posted approximately once per week. We are usually posting them on Monday, but we can’t promise that it will be the case each week.
Our preferred ways to invest in and to trade gold along with the reasoning can be found in the how to buy gold section. Additionally, our preferred ETFs and ETNs can be found in our Gold & Silver ETF Ranking.
Moreover, Gold & Silver Trading Alerts are posted before or on each trading day (we usually post them before the opening bell, but we don’t promise doing that each day). If there’s anything urgent, we will send you an additional small alert before posting the main one.
Thank you.
Przemyslaw K. Radomski, CFA
Founder, Editor-in-chief

