

Briefly: gold and the rest of the precious metals market are likely to decline in the next several weeks/months and then start another powerful rally. Gold’s strong bullish reversal/rally despite the USD Index’s continuous strength will likely be the signal confirming that the bottom is in.
Welcome to this week's Gold Investment Update.
Predicated on last week’s price moves, our most recently featured medium-term outlook remains the same as the price moves align with our expectations. On that account, there are parts of the previous analysis that didn’t change at all in the earlier days and are written in italics.
Rising rates stole the show once again, as the bond market sell-off continued this week. Yet, while the general stock market suffered, the PMs remained relatively uplifted, as the Israel-Hamas war boosts their appeal. Conversely, the medium-term technicals and fundamentals signal profound trouble, and positioning for more downside should prove profitable in the months ahead.
We’ll begin today’s alert by dissecting the fundamentals, and then dive into the technical aspects that have proven so prescient over the last several months.
Gold’s Second War
The PMs are back in style, as market participants have flocked to gold amid the ongoing Middle East conflict. And despite the surprise, we recently closed our GDXJ ETF short position for a profit, as the technicals have proven superior over the last several months.
Furthermore, with another short opportunity likely on the horizon, the junior miners are making a familiar mistake.
Please see below:
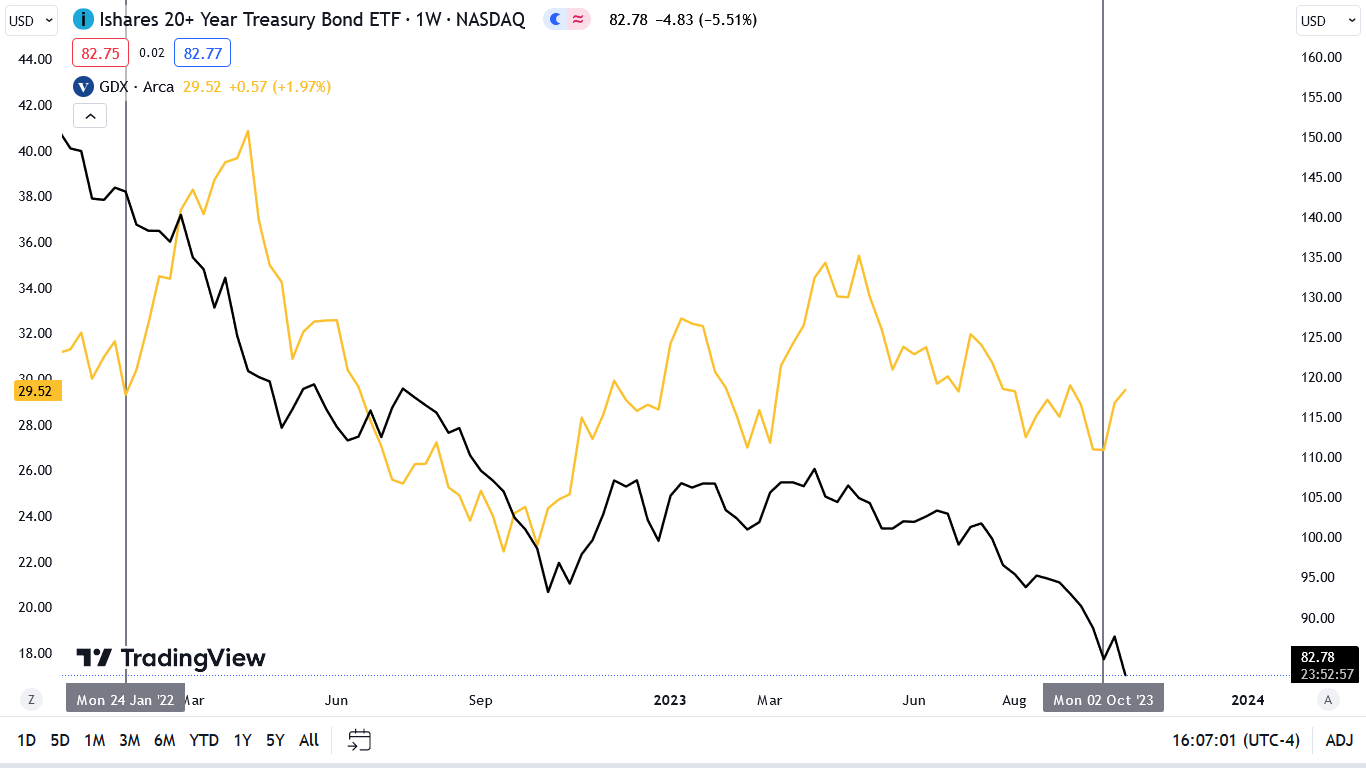
To explain, the gold line above tracks the weekly movement of the GDXJ ETF, while the black line above tracks the weekly movement of the iShares 20+ Year Treasury Bond (TLT) ETF. If you analyze the left side of the chart, you can see that the GDXJ ETF soared during the Russia-Ukraine conflict while the TLT ETF continued its medium-term downtrend. And with the divergence a bad omen for silver and the junior miners, they eventually reversed and declined precipitously.
Similarly, the price action on the right side of the chart shows how the recent GDXJ ETF rally has occurred alongside another TLT ETF crash. Consequently, while the former may have some more upside, it could be a long way down if (when) the decoupling reverses.
To that point, we warned on several occasions that Fed Chairman Jerome Powell would remain hawkish, which supports higher real yields and a stronger USD Index. And with the central bank chief reiterating that stance on Oct. 19, the PMs’ bear markets should have plenty of room to run. He said:
“While the path is likely to be bumpy and take some time, my colleagues and I are united in our commitment to bringing inflation down sustainably to 2%…. Does it feel like policy is too tight right now? I would have to say no,” even though “higher interest rates are difficult for everybody.”
He added:
“We’re very far from the effective lower bound, and the economy is handling it just fine.”
Thus, while Powell believes the economy is invincible right now, we think that notion is short-sighted. In reality, long-term interest rates have risen dramatically, and the forthcoming pain should lead to a Minsky Moment.
Recession Signals
Although the crowd and the Fed have dismissed the ominous data, there are plenty of scars outside unemployment claims. For example, The Conference Board’s Leading Economic Index (LEI) declined by 0.7% month-over-month (MoM) in September, which was worse than the 0.5% MoM decline in August. Justyna Zabinska-La Monica, Senior Manager, Business Cycle Indicators, at The Conference Board, said:
“In September, negative or flat contributions from nine of the index’s ten components more than offset fewer initial claims for unemployment insurance…. So far, the US economy has shown considerable resilience despite pressures from rising interest rates and high inflation. Nonetheless, The Conference Board forecasts that this trend will not be sustained for much longer, and a shallow recession is likely in the first half of 2024.”
Consequently, while we may disagree on the magnitude of the economic slowdown, the rapid rate rise should have drastic consequences for crude oil and the PMs.
Please see below:
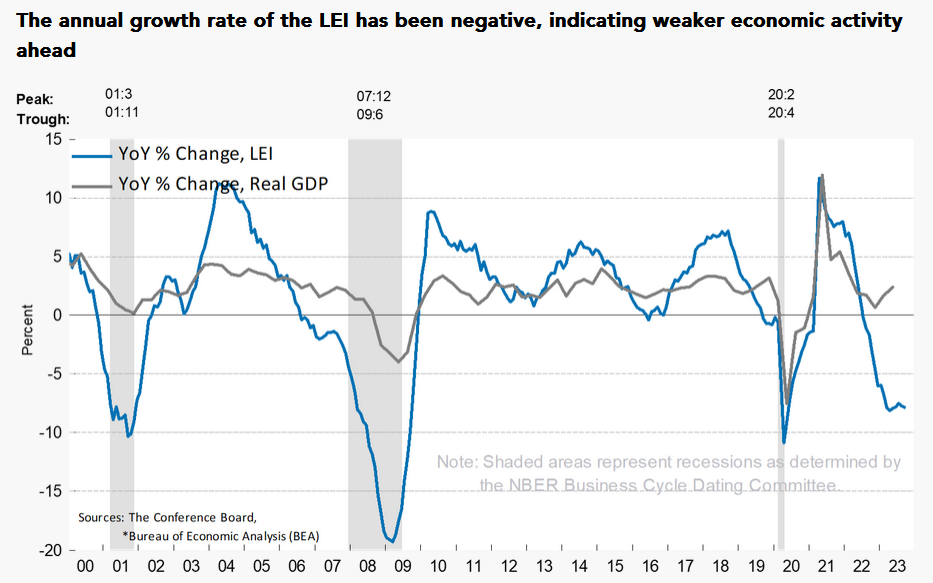
To explain, the blue line above tracks the year-over-year (YoY) percentage change in the LEI, while the gray line above tracks the YoY percentage change in real GDP. If you analyze the right side of the chart, you can see that the blue line has dipped again and remains near recession levels. As such, it’s likely only a matter of time before real GDP follows suit.
Finally, the large U.S. banks reported earnings recently, and executives’ message was noticeably different from 2021 and 2022. Wells Fargo CEO Charlie Scharf said:
“While the economy has continued to be resilient, we are seeing the impact of the slowing economy with loan balances declining and charge-offs continuing to deteriorate modestly.”
In addition, Citigroup CEO Jane Fraser said the deceleration in spending indicated “an increasingly cautious consumer.”
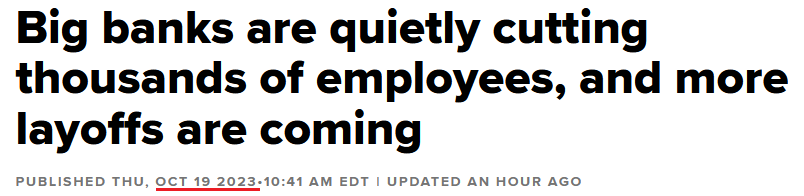
Likewise, because actions speak louder than words, the five largest U.S. banks have cut a combined 20,000 jobs so far this year, and the pain should only intensify in the months ahead.
Overall, the crowd and Powell think the surge in long-term rates is no big deal. However, history shows that rates rise and rise until an ‘uh oh’ event occurs. And with the damage starting to show, don’t be surprised if a panicked yield reversal coincides with a sharp drawdown of the PMs and major pain for the S&P 500.
Silver Should Be Scared of a Slowdown
While silver has benefited from the Middle East conflict, history shows the white metal can’t escape the ominous fundamentals of higher real yields, a stronger USD Index, and panic selling that occurs during recessions.
Furthermore, with economic pain hiding in plain sight, the crowds’ belief that higher long-term rates don’t matter should end in tears. For example, the National Association of Homebuilders (NAHB) released its Housing Market Index (HMI) on Oct. 17. The report stated:
“Stubbornly high mortgage rates that have climbed to a 23-year high and have remained above 7% for the past two months continue to take a heavy toll on builder confidence, as sentiment levels have dropped to the lowest point since January 2023.”
Please see below:
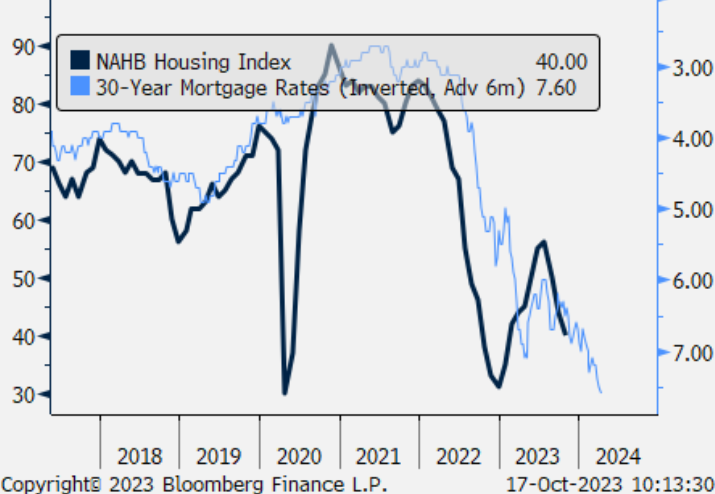
To explain, the black line above tracks the HMI, while the blue line above tracks the inverted (down means up) U.S. 30-year mortgage rate. If you analyze the right side of the chart, you can see that the latter implies more downside for the former.
Likewise, the U.S. 30-Year Treasury yield closed at a new cycle high on Oct. 19, which means the mortgage rate is even higher now. Consequently, the pain confronting the U.S. housing market should spread to other areas of the economy, and gold could sell off when the crowd realizes the ramifications.
Labor Concerns
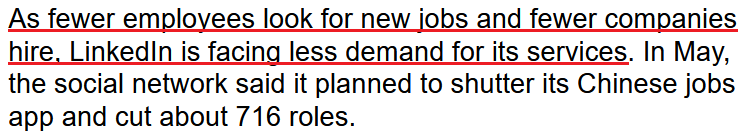
While U.S. unemployment claims sunk below 200,000 on Oct. 19, the labor market is weaker than it appears. LinkedIn has cut nearly 1,400 positions in 2023, and another round of layoffs was announced on Oct. 17.
Please see below:
Similarly, Indeed noted on Oct. 2 that the Christmas rush is nothing like 2021 and 2022, as “there are fewer [seasonal] jobs available this year than in years past, and less urgency to fill those that are available.” The report added:
“For the first time in the post-pandemic era, the number of seasonal/holiday job postings on Indeed has fallen below pre-pandemic levels. As of late September, seasonal job postings were down 3% from the same time in 2019, and 6% below levels from the same period a year ago.”
Please see below:
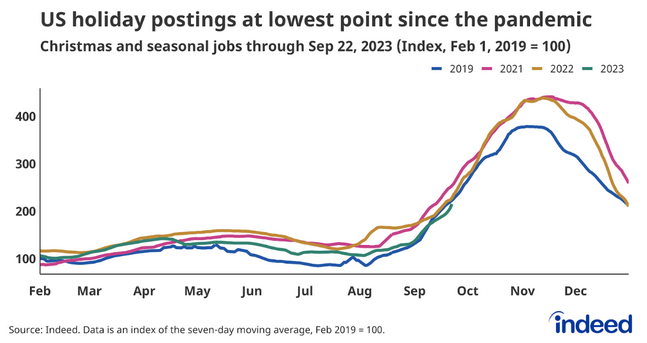
To explain, the pink and brown lines above are higher than the blue line, which means that seasonal job postings outperformed in 2021 and 2022 relative to 2019. As a result, the data highlights why we faded the recession narratives back then, as employee demand was bullish for wage inflation and consumption.
In contrast, the green line above is below the blue line, which means that 2023’s postings are weaker than 2019 and this is bearish for wage inflation and consumption. Similarly, the rapid rate rise should lead to further weakness in the months ahead, and the USD Index should benefit from the volatility.
As another warning sign, Bank of America found that unemployment claims may look much worse in the months ahead.
Please see below:
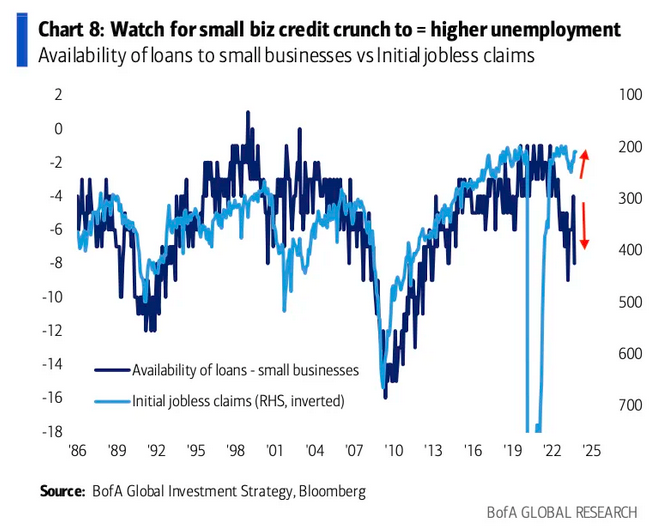
To explain, the dark blue line above tracks the availability of loans to small businesses, while the light blue line above tracks the inverted (down means up) initial jobless claims. If you analyze the relationship, you can see that unemployment claims often rise when banks stop lending to smaller firms. And with the two lines diverging on the right side of the chart, it’s likely only a matter of time before jobless claims, and economically sensitive assets like crude oil, bear the brunt of higher interest rates.
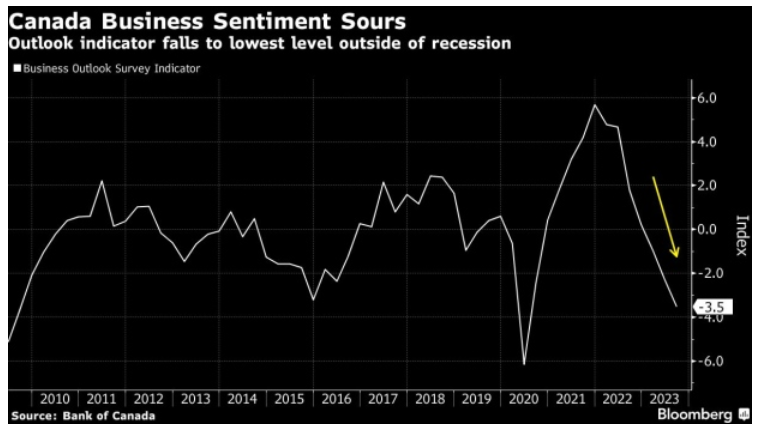
Finally, The Bank of Canada (Boc) revealed on Oct. 16 that Canadian business sentiment suffered its seventh consecutive quarterly decline and is gunning for its 2020 lows. And with Canada sending the bulk of its exports to the U.S., a slowdown is bad news for America.
Overall, the crowds’ 2023 belief that long-term rates can rise indefinitely without any carnage is like their 2021 belief that inflation is transitory. In reality, plenty of pain is present, and the current fundamental backdrop is nothing like 2021 or 2022, in our opinion. As a result, the S&P 500 should come under heavy pressure in the months ahead, and the PMs are unlikely to sidestep the volatility.
The Bottom Line
The bond market remains unhinged as higher long-term interest rates have pelted the financial markets. And with the economic ramifications yet to come, a major bout of panic should unfold when the damage becomes obvious. Consequently, we expect more precious metals downside before long-term buying opportunities emerge.
In conclusion, the PMs were mixed on Oct. 19, even though geopolitical concerns dominated the narrative. Yet, the weak domestic outlook should reign supreme as time passes, and opening another short position should prove profitable once again.
Technically Speaking
I warned the PMs were ripe for rallies due to the Middle East conflict. And after closing our 11th-straight profitable trade, the GDXJ ETF ended the Oct. 19 session higher than our exit price. As a result, we preserved our capital, which can be put to work if (when) the junior miners’ index reaches the next prudent shorting level.
[EDIT: We just re-opened the short position, and I discussed it in today’s intraday Gold Trading Alert.]
To understand why, please read my comments from yesterday. They highlight the outlooks for several assets and how to plan our strategy in the days ahead.
The price of gold soared once again yesterday, but there are important signs suggesting that this rally is close to being over.
The current action in the precious metal sector continues to be determined by the increasing concern/interest in war, so that’s what I’m going to start today’s chart analysis with.
The below chart features the interest in war in Google News in the U.S.
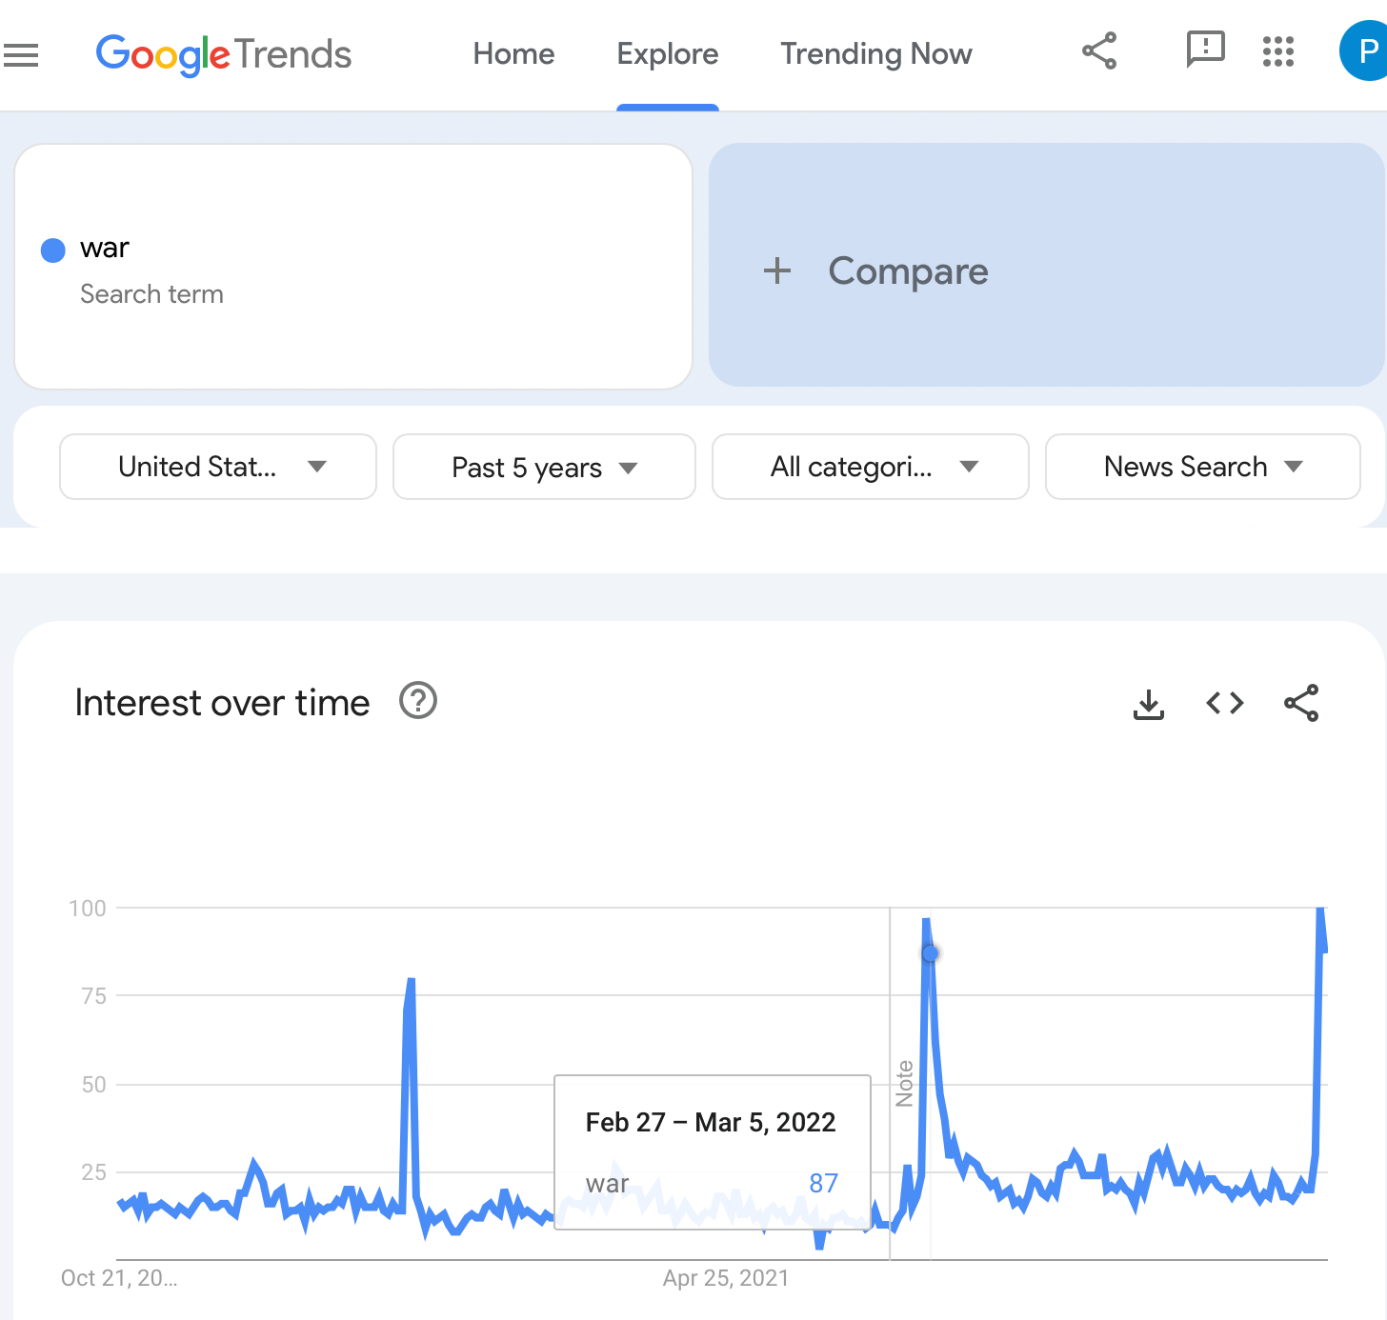
The current situation is analogous to what we saw right before and right after the Russian invasion in 2022.
Now, since the market generally “buys the rumor and sells the fact”, gold is rallying primarily based on increasing fear or uncertainty, which is connected to, but no the same thing as actual events.
This concern can be measured by how frequently the term “war” is being searched in Google (in particular, in Google News – this part of Google’s service is used to get… well, news, which helps to isolate the concern with the current conflict).
The key thing that is happening this week is that after last week’s peak, it seems that this week’s interest is about to decline a bit. We still have just partial data as the week is not over yet, but it’s enough to see how analogous the situation is to the Feb 27 – Mar 5, 2022 week.
And guess what happened in gold at that time…
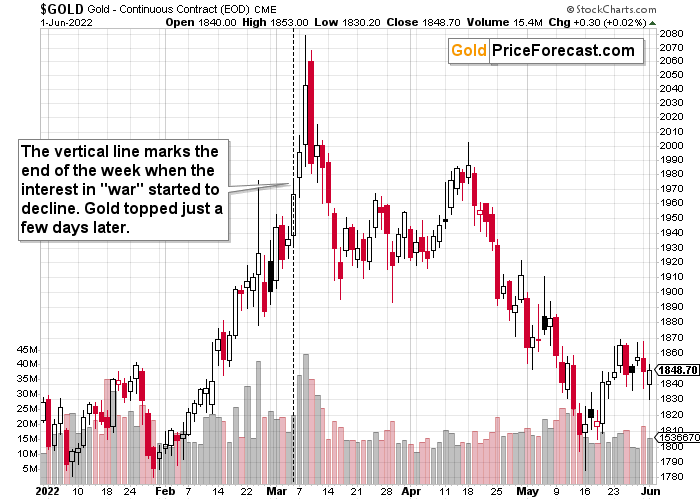
Just a brief gold price analysis reveals that it peaked but not exactly when the concerns did. Gold price continued to move higher after that lower-interest week for a few more days, and then it topped.
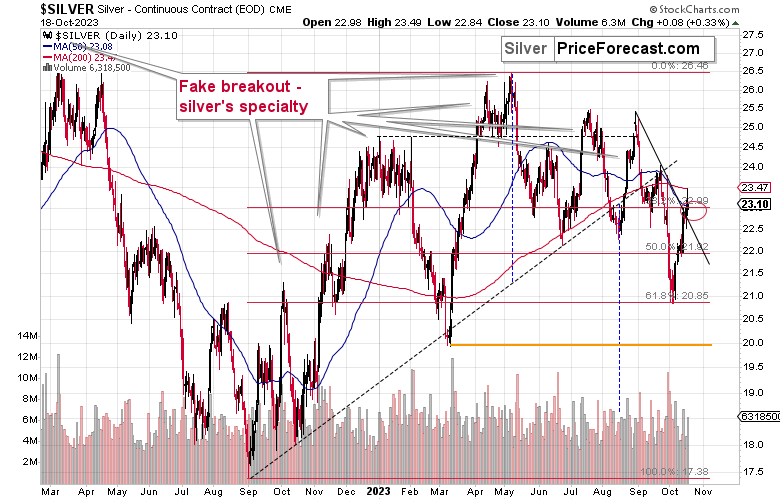
This is in tune with what I’ve been expecting the precious metals market to do right now – to move higher in the short run but then top and resume its medium-term downtrend.
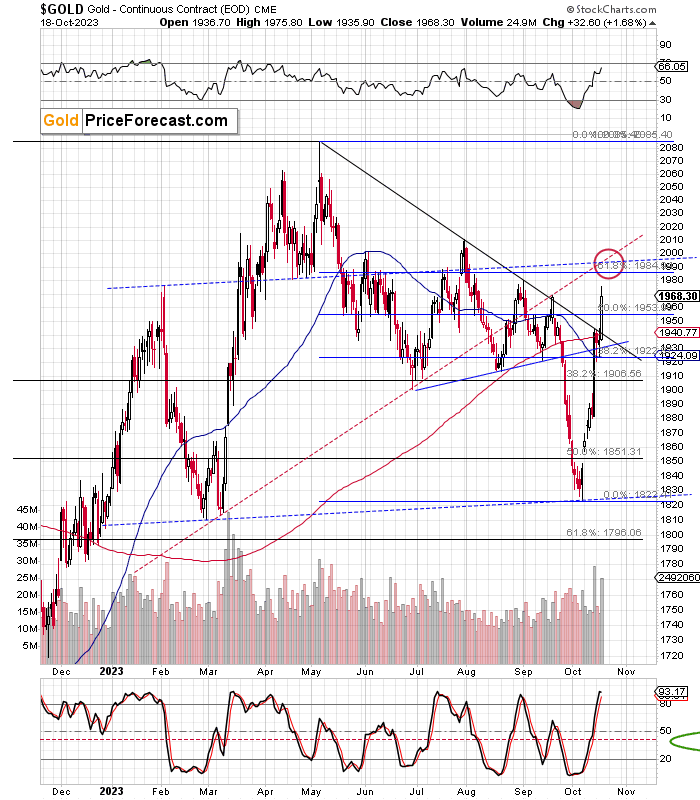
As you can see on the above chart, gold is currently soaring – just like it’s been soaring back in early 2022. If it is to continue to rally for a couple of days, it could move close to the $2,000 level before topping, providing a great shorting opportunity (we took profits from the previous short position before this rally picked up pace).
This would make the current rally symmetrical to the early-2023 decline, and it would make the entire 2023 (so far) one big head-and-shoulders pattern. Of course, that pattern would need to be confirmed by gold’s decline, but we already know that this is likely to happen based on the current sentiment analysis.
The triangle-vertex-based reversal is due in several days, so gold might indeed have some room to rally.
Interestingly, gold moved higher despite the fact that the USD Index moved higher, too.
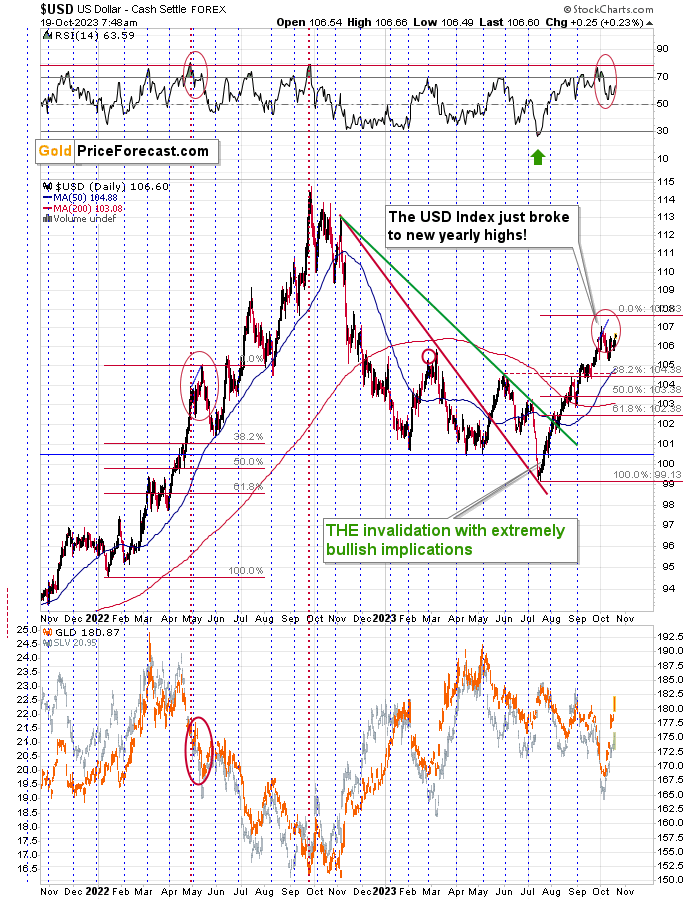
Why did this take place? Because both gold and the U.S. dollar are viewed as safe-haven assets, and given the concerns regarding war in the Middle East, both are bought.
Whether the USD Index moves lower from here or higher doesn’t necessarily matter, as investors’ focus is on something else. Once the “war concern” peaks and then declines, in all likelihood, the USD Index will once again become an important driver of gold prices.
For now, the outlook for gold remains bullish, but it’s likely to change soon.
While gold moved higher, silver rallied too but we didn’t see a massive outperformance of the latter.
This means that the precious metals sector might not have topped yet, as the white metal tends to outperform the yellow one right before turnarounds.
Now, GDXJ’s very weak performance yesterday might suggest that the top is already in, and… It might be in for the GDXJ, but I still think that we’ll see a move even higher in the near term – or at least back to yesterday’s intraday high.
One of the reasons is the situation in gold that I already outlined above. The second reason is that junior miners’ triangle-vertex-based reversal point is very close, so miners might top before gold does. This is quite likely, as miners are likely to underperform gold close to the top (which we just saw).
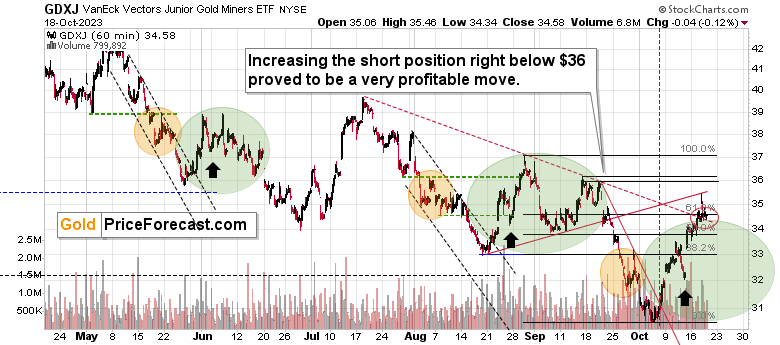
Zooming in allows us to see that the GDXJ declined after moving to the rising red resistance line, but it then closed above the declining red support line, thus verifying it as support.
Yesterday’s weak performance of mining stocks might be at least partially explained by the weak performance of the general stock market.
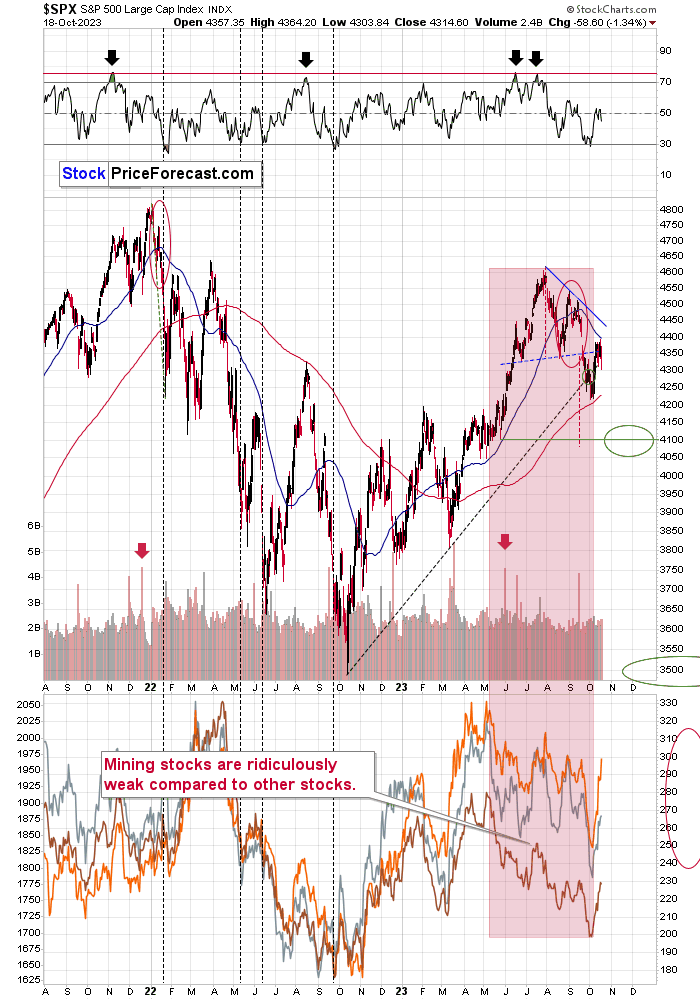
The latter is moving back and forth, and yesterday’s session took the S&P 500 Index 1.34% lower. This movement is around two rising support lines, which makes those moves particularly important.
If stocks break lower from this consolidation, the breakdowns will be confirmed, and the road to new lows will be open.
That’s quite likely to happen within the next days and, if not, then weeks.
If stocks decline but gold rallies, we might see some erratic performance in mining stocks – similar to what we saw on Wednesday. In this case, miners could rally on the intraday basis once again and then decline before the closing bell.
The important thing is that all this is short-term smoke and mirrors. The medium-term trend remains extremely bearish, and even a brief look at world stocks confirms that.
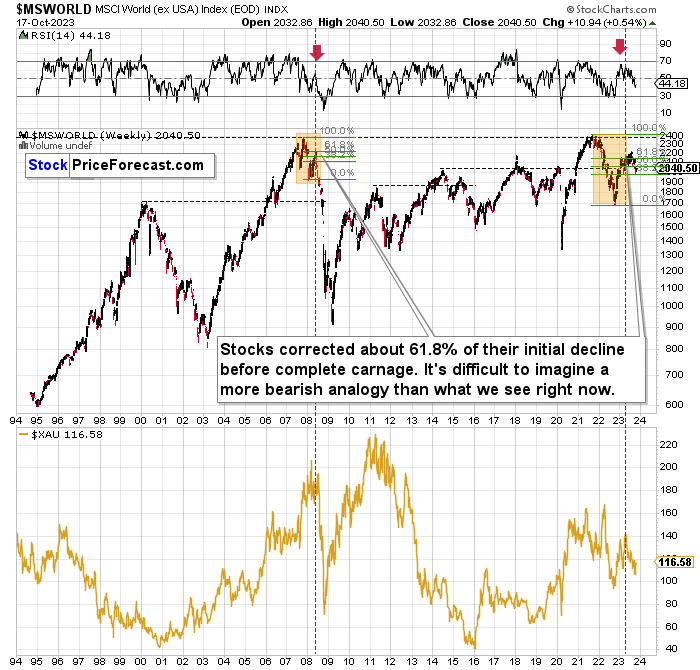
The situation right now is just like it was in 2008, right before the enormous, very volatile slide. The price itself (its shape) and RSI confirm that. The implications for mining stocks (visible on the lower part of the above chart) remain extremely bearish. The main difference between the two situations is that this time, miners start from much lower levels (even though gold is much higher).
Also, while we’re focusing on the big picture, let’s take a look at what the junior mining stocks are doing from the really long-term point of view.
Enter the Toronto Stock Exchange Venture Index. That’s also a proxy for junior miners because so many juniors are included in this index.
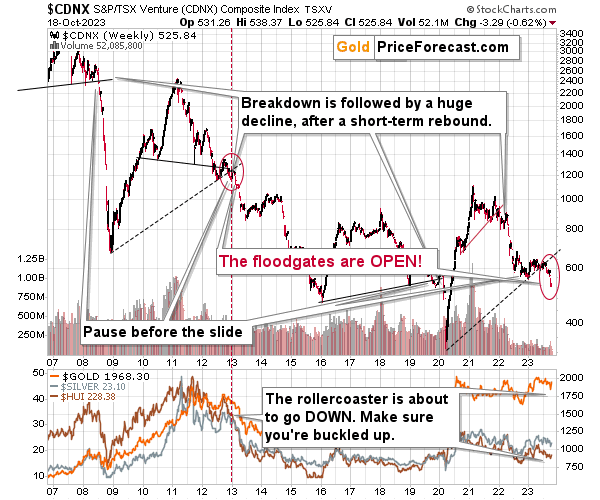
In short, the index is in a freefall. Juniors plunged after the breakdown below the rising, long-term support line that happened earlier this year. The same happened in early 2013.
The mining stocks then declined in the medium term while correcting every now and then. That’s exactly what we see now, and it puts the current move higher in the proper perspective.
This is not a change in the big downtrend – it’s part thereof.
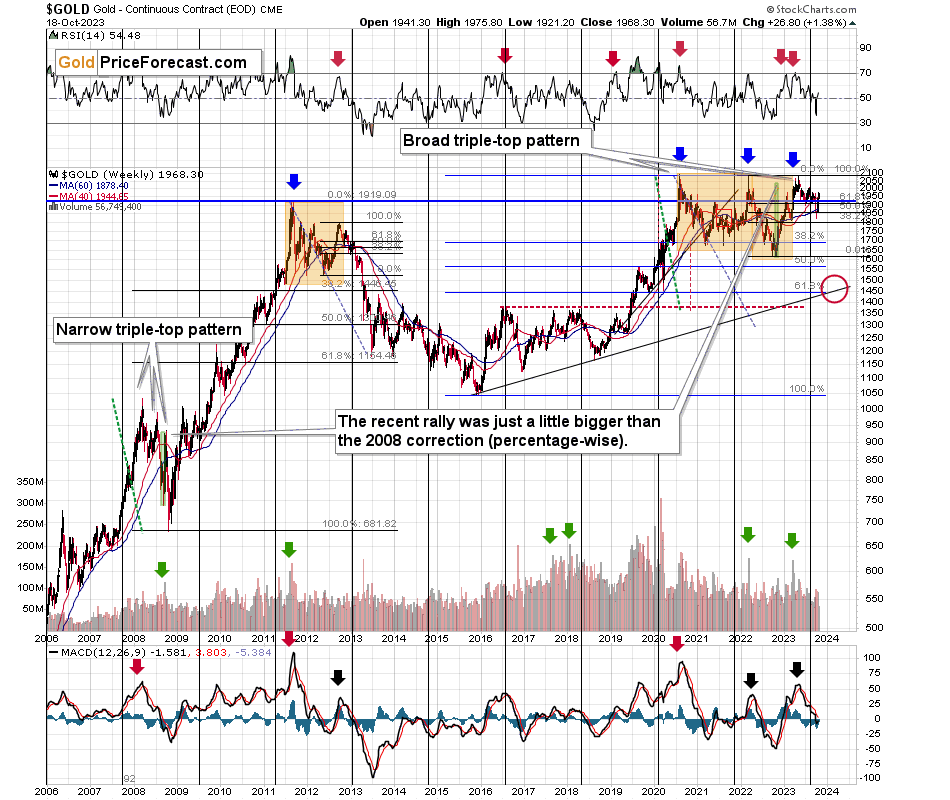
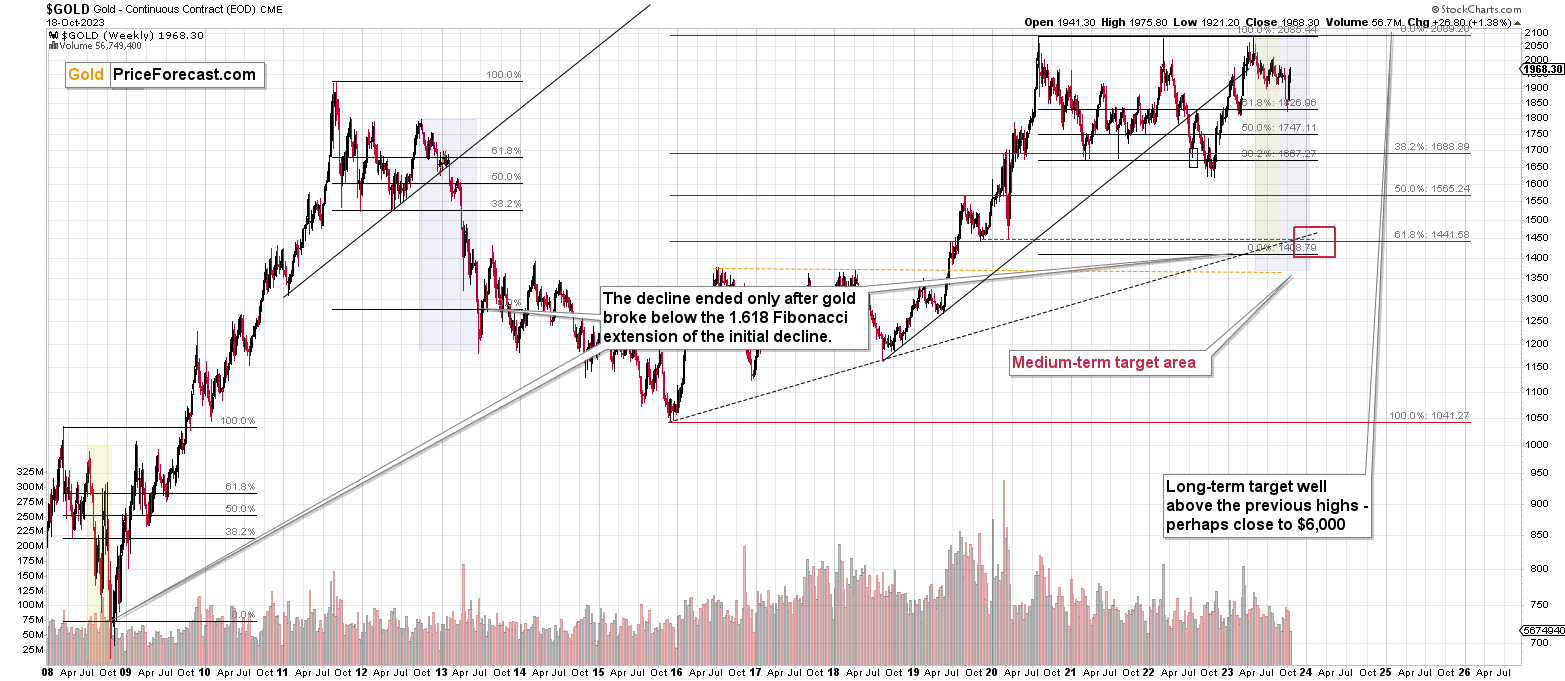
From the long-term point of view, the analogy in gold between now and 2013 remains intact, with the small exception that the current rally includes a war-premium bonus, so it’s natural that it’s bigger than the previous ones and somewhat bigger than the ones that we saw in 2013.
And since it seems that the peak fear is already behind us… The rally is likely to start reversing soon. In consequence, the link between 2013 and now is likely to return with full force, pushing gold prices lower.
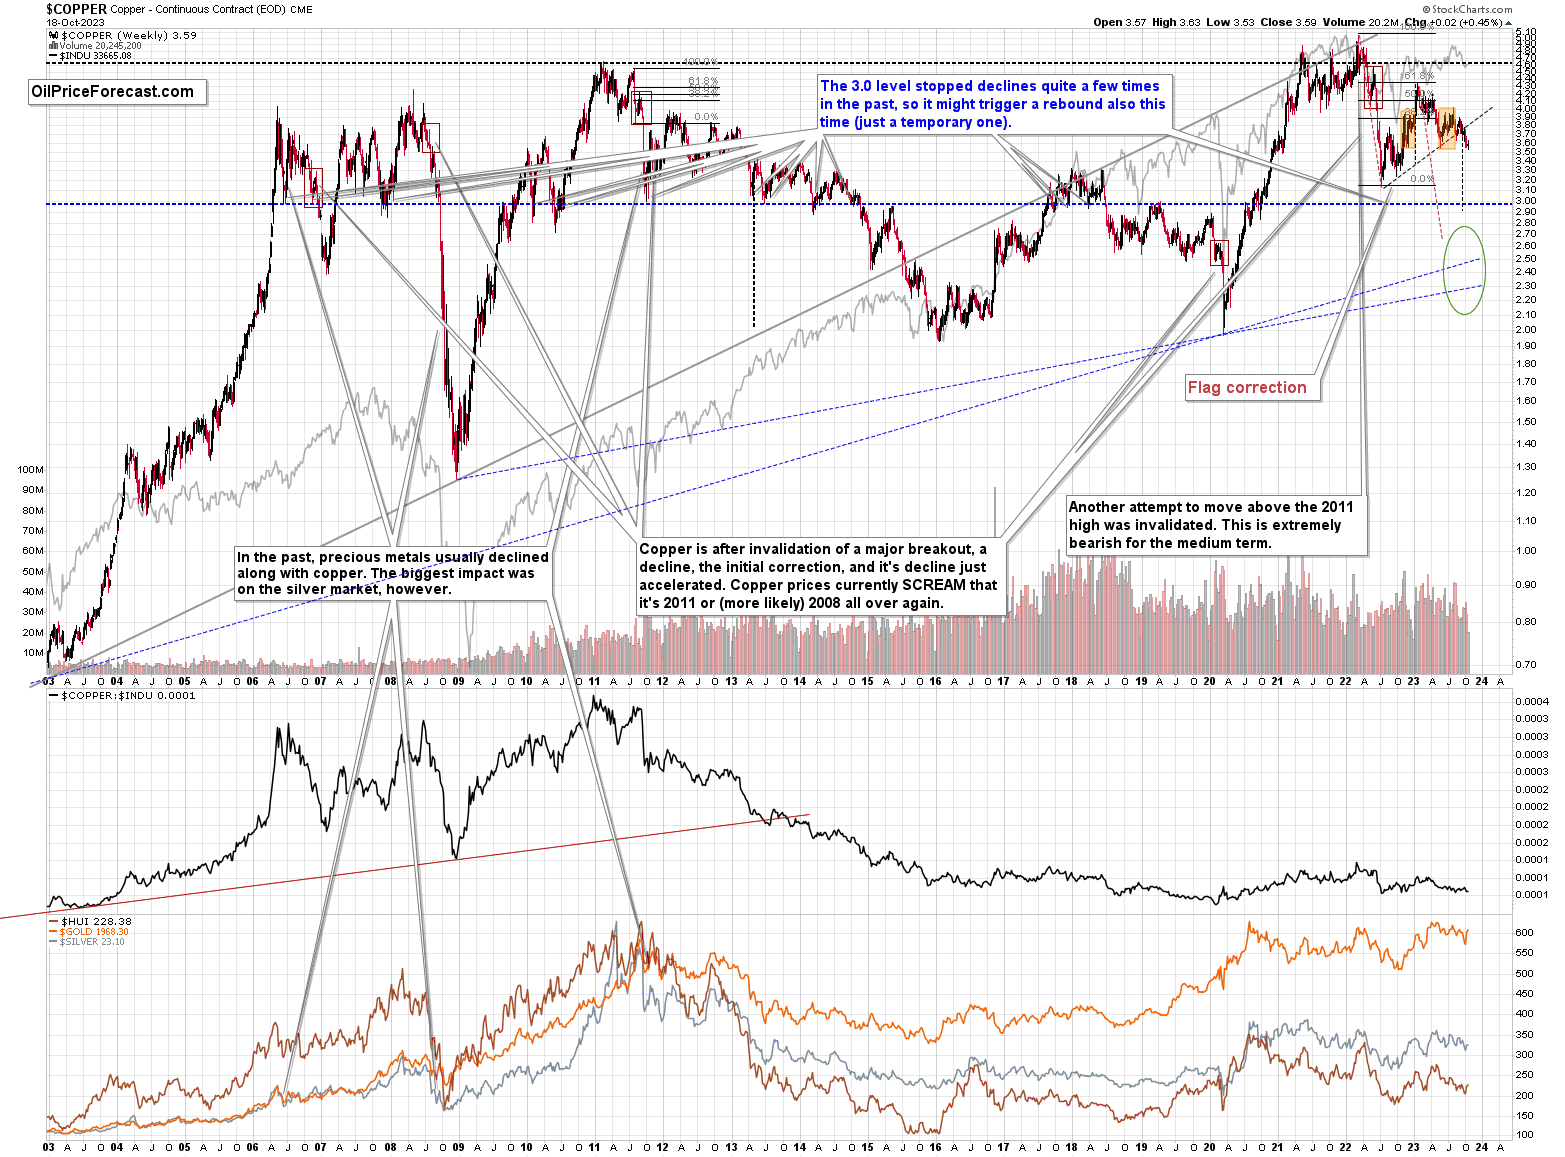
Meanwhile, copper moved a bit higher recently, but very insignificantly so. It remains below its rising resistance line, and since the breakdown below it was already confirmed, the outlook remains bearish.
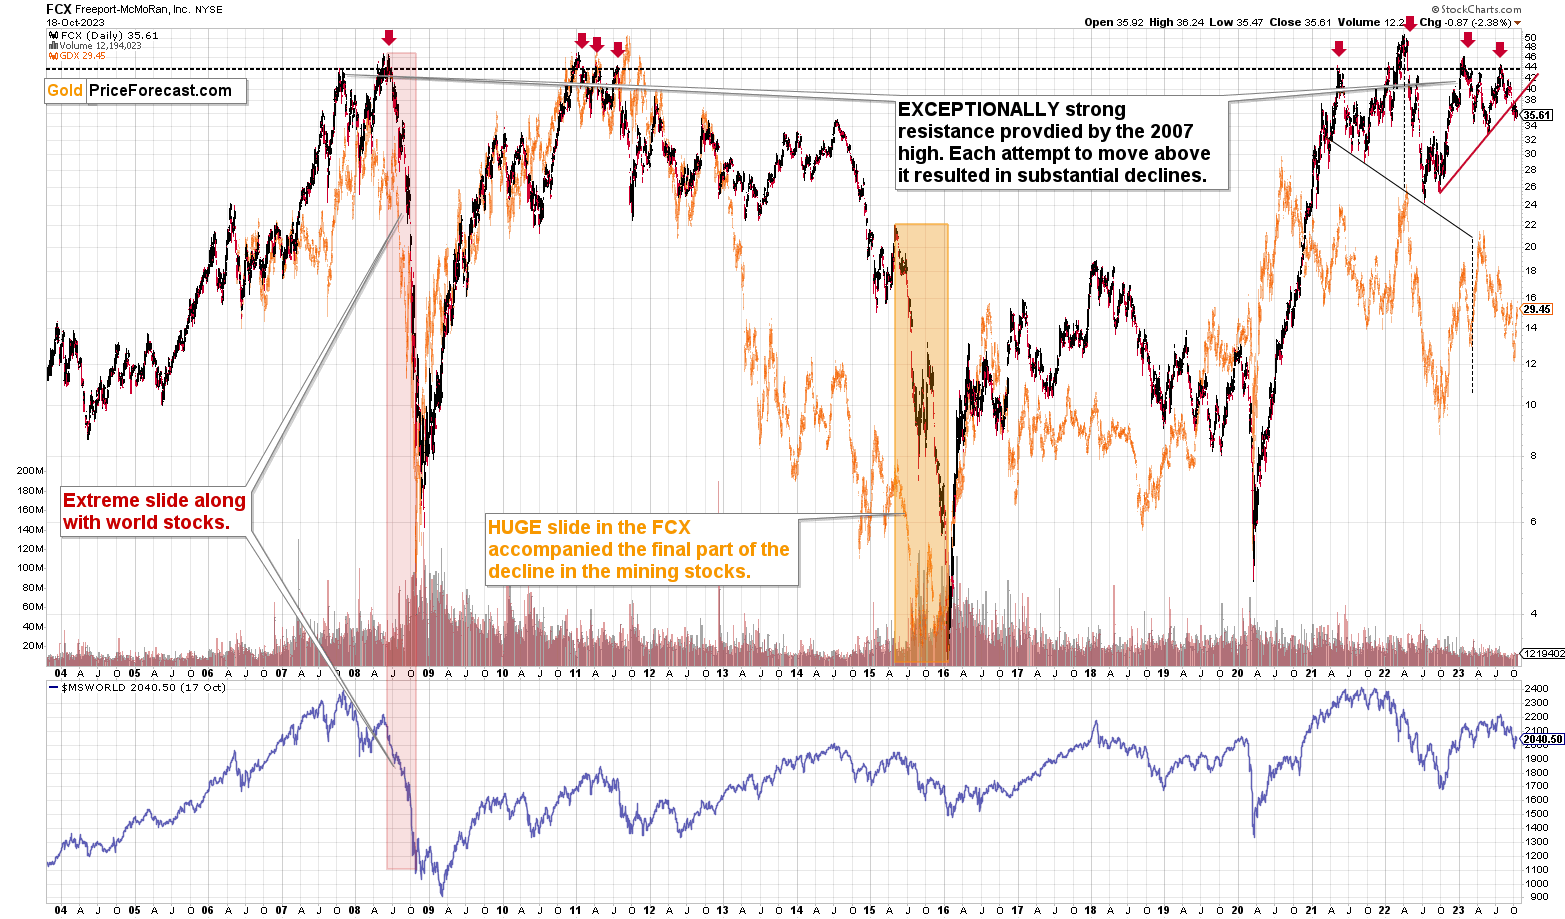
The same goes for the big copper and gold producer – FCX. It corrected a bit after breaking below the rising, red resistance line, but the breakdown wasn’t invalidated. The outlook remains clearly bearish.
What does it all mean for the precious metals market? That the extremely bearish outlook remains in place for the medium term, and thanks to the bullish outlook for the very short term, it seems that we’ll be able to re-enter our short positions at higher levels, which would imply increasing our overall profits from the medium-term decline.
Since the GDXJ is above our previous exit price, the above seems very likely.
As always, we’ll keep you – our subscribers – informed.
===
If you’d like to become a partner/investor in Golden Meadow, you’ll find more details in the above link.
Overview of the Upcoming Part of the Decline
- It seems that the recent – and probably final – corrective upswing in the precious metals sector is over.
- If we see a situation where miners slide in a meaningful and volatile way while silver doesn’t (it just declines moderately), I plan to – once again – switch from short positions in miners to short positions in silver. At this time, it’s too early to say at what price levels this could take place and if we get this kind of opportunity at all.
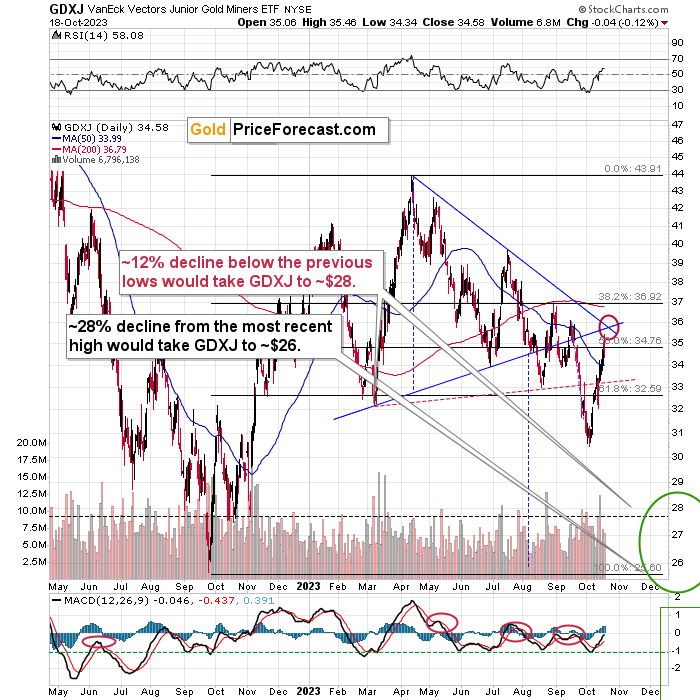
- I plan to switch from the short positions in junior mining stocks or silver (whichever I’ll have at that moment) to long positions in junior mining stocks when gold / mining stocks move to their 2020 lows (approximately). While I’m probably not going to write about it at this stage yet, this is when some investors might consider getting back in with their long-term investing capital (or perhaps 1/3 or 1/2 thereof).
- I plan to return to short positions in junior mining stocks after a rebound – and the rebound could take gold from about $1,450 to about $1,550, and it could take the GDXJ from about $20 to about $24. In other words, I’m currently planning to go long when GDXJ is close to $20 (which might take place when gold is close to $1,450), and I’m planning to exit this long position and re-enter the short position once we see a corrective rally to $24 in the GDXJ (which might take place when gold is close to $1,550).
- I plan to exit all remaining short positions once gold shows substantial strength relative to the USD Index while the latter is still rallying. This may be the case with gold prices close to $1,400 and GDXJ close to $15 . This moment (when gold performs very strongly against the rallying USD and miners are strong relative to gold after its substantial decline) is likely to be the best entry point for long-term investments, in my view. This can also happen with gold close to $1,400, but at the moment it’s too early to say with certainty.
- The above is based on the information available today, and it might change in the following days/weeks.
You will find my general overview of the outlook for gold on the chart below:
Please note that the above timing details are relatively broad and “for general overview only” – so that you know more or less what I think and how volatile I think the moves are likely to be – on an approximate basis. These time targets are not binding nor clear enough for me to think that they should be used for purchasing options, warrants, or similar instruments.
Letters to the Editor
Please post your questions in the comments feed below the articles, if they are about issues raised within the article (or in the recent issues). If they are about other, more universal matters, I encourage you to use the Ask the Community space (I’m also part of the community), so that more people can contribute to the reply and enjoy the answers. Of course, let’s keep the target-related discussions in the premium space (where you’re reading this).
Summary
To summarize, the medium-term trend in the precious metals sector remains clearly down, and it seems that the corrective upswing is already over and the profits on our current short position are going to increase. We just caught the 10th profitable trade in a row – congratulations. The outlook for the short positions in junior miners and in the FCX remains very favorable.
===
Finally, since 10th profitable trade in a row is such a great piece of news (and the same goes for the fact that the current short position is already profitable), here’s… Even more great news! The possibility to extend your subscription for up to three years (at least by one year) with a 20% discount from the current prices is still open.
Locking in those is a great idea not only because it’s perfect time to be ready for what’s next in the precious metals market, but also because the inflation might persist longer than expected and prices of everything (including our subscriptions) are going to go up in the future as well. Please reach out to our support – they will be happy to assist you and make sure that your subscription days are properly extended at those promotional terms. So, for how many years would you like to lock-in your subscription?
To summarize:
Short-term outlook for the precious metals sector (our opinion on the next 1-6 weeks): Bearish
Medium-term outlook for the precious metals sector (our opinion for the period between 1.5 and 6 months): Bearish initially, then possibly Bullish
Long-term outlook for the precious metals sector (our opinion for the period between 6 and 24 months from now): Bullish
Very long-term outlook for the precious metals sector (our opinion for the period starting 2 years from now): Bullish
As a reminder, Gold Investment Updates are posted approximately once per week. We are usually posting them on Monday, but we can’t promise that it will be the case each week.
Our preferred ways to invest in and to trade gold along with the reasoning can be found in the how to buy gold section. Additionally, our preferred ETFs and ETNs can be found in our Gold & Silver ETF Ranking.
Moreover, Gold & Silver Trading Alerts are posted before or on each trading day (we usually post them before the opening bell, but we don’t promise doing that each day). If there’s anything urgent, we will send you an additional small alert before posting the main one.
Thank you.
Przemyslaw K. Radomski, CFA
Founder, Editor-in-chief

