

Briefly: the next big downswing appears to be already underway. It might take several weeks before it's completely over.
Welcome to this week's Gold Investment Update. Predicated on last week’s price moves, our most recently featured outlook remains the same as the price moves align with our expectations. On that account, there are parts of the previous analysis that didn’t change at all in the earlier days, which will be written in italics.
Before discussing the technical point of view, we’d like to say a few words on the key event that took place recently. The thing that we would like to emphasize today is that while it doesn’t get as much press coverage as it used to, coronavirus cases continue to grow.
The vaccines will likely arrive – sometime in the future. However, Covid-19 cases are surging now. While there is light at the end of the tunnel, the fall and winter may be harsh. What does it mean for gold?
Fed Chair Jerome Powell spoiled the fun. It was so good: the election dust settled while Pfizer announced a vaccine breakthrough. And then Powell spoke on Thursday at the European Central Bank’s (ECB) forum, pointing out the risks ahead. In particular, he said that the economy as we know it might be over, and even though it’s recovering, “we’re not going back to the same economy”. In other words, Powell worries about the possibility of the pandemic and resulting economic crisis leaving long-term scars: “the risk is that there is some longer-run damage to the productive capacity of the economy and to people’s lives who have been disrupted by the pandemic”. Not good – the pace of economic growth was already quite sluggish before the pandemic, and now it may slow down further. Or maybe it is good news – for gold.
Moreover, Powell downplayed somewhat Pfizer’s announcement. He noted that although the vaccine news is great, there remain important challenges and uncertainties about the vaccine’s timing, production, distribution, and the efficacy for different groups. And “with the virus now spreading, the next few months could be challenging that year”.
Indeed, as the chart below shows, the US epidemiological curve has recently skyrocketed. The number of daily new Covid-19 cases has surpassed 180,000 last week, and although it has slowed down to around 165,000 on Sunday, the number is still extremely high. Even worse is that these are only officially confirmed cases. According to some epidemiologists, they are just the tip of the iceberg, with 70-90 percent of all cases being unreported.
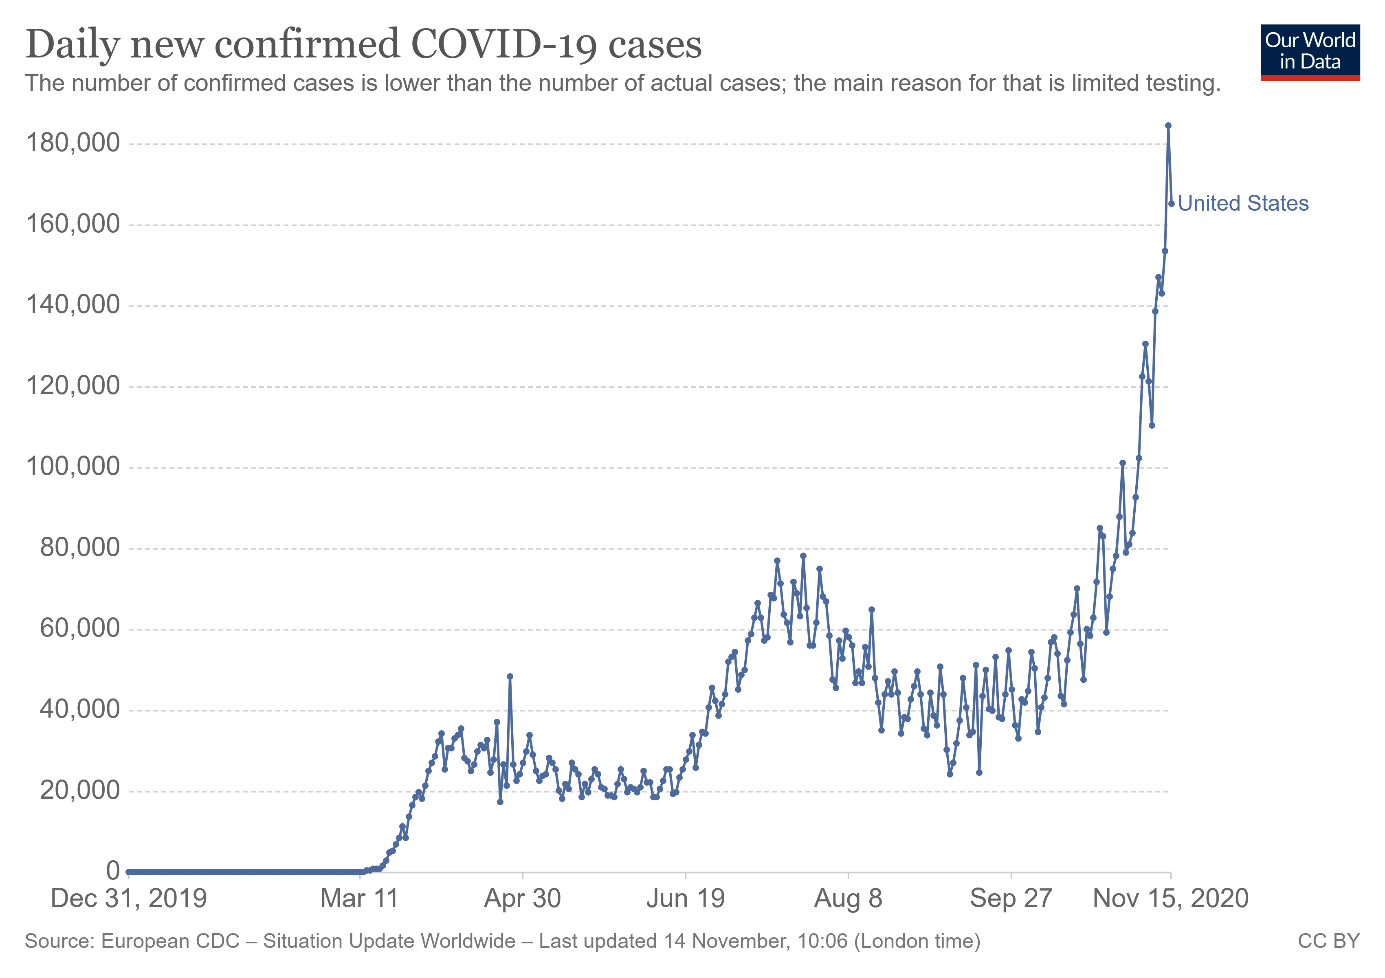
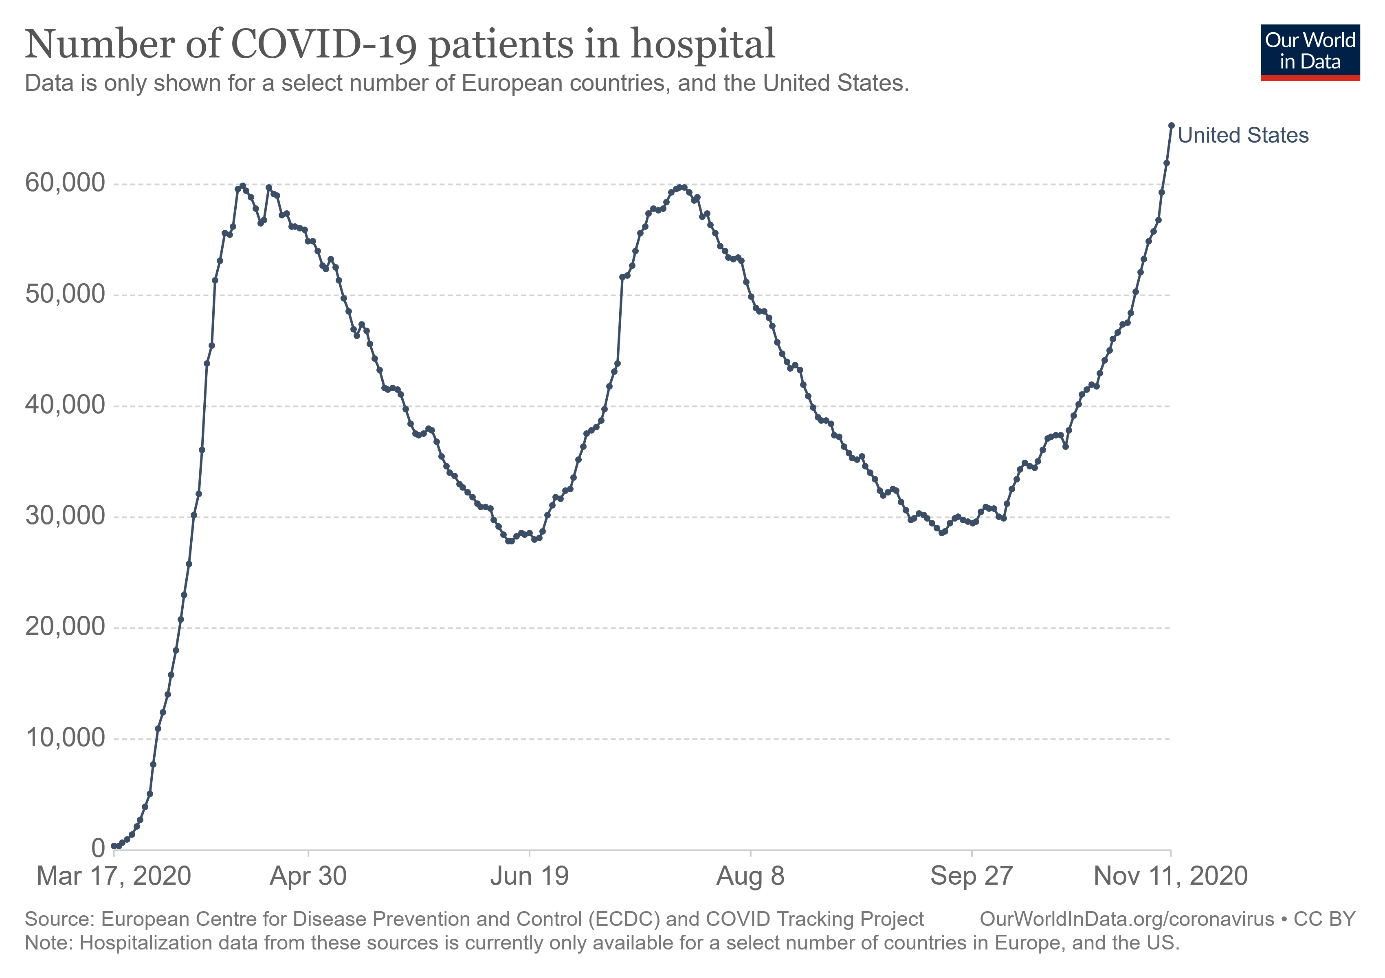
And the number of hospitalizations is also rising, as one can see in the chart below. The problem is that at the current rate of infections and hospitalizations, the healthcare system will be quickly overwhelmed. In some places, hospitals are struggling to find beds for patients and are stretching their capacity to deliver care. Some epidemiologists even warn that America is entering “Covid hell”, in which a doctor will have to decide who to treat and who dies, not because of the coronavirus, but because of other health-related issues which couldn’t be addressed due to an overwhelmed healthcare system. May it not come true.
What does this all mean for the yellow metal? Well, Pfizer’s vaccine news is great for the economy and bad for gold, as it can reduce the pandemic-related uncertainty. However, the vaccine is the song of the future and in the meantime, the U.S. will have to face the darkest moments of the epidemic. The current strong wave of infections will hit both the healthcare system and the economy.
You see, the pace of economic recovery has already moderated. The current huge rise in Covid-19 cases will slow economic growth further in the fourth quarter. So, as investors will observe the progressing epidemic, the safe-haven demand for gold may revive. Moreover, the virus’s offensive means that further economic support is likely to be needed to help the economy. A fiscal stimulus is coming – and it will have to be bigger than previously thought. The additional government spending will add to the huge pile of public debt. Oh, by the way, the U.S. government started the 2021 fiscal year with an October fiscal deficit of $284 billion, an increase of 111 percent compared to October 2019. Therefore, although the upcoming positive news about the Covid-19 vaccine could exert some downward pressure on gold prices, the macroeconomic outlook remains supportive for the yellow metal.
All in all, there are multiple fundamental reasons why gold is likely to soar in the upcoming years. However, even the most profound bull markets can’t move up in a straight line, and some corrections will likely take place. After the big rallies, we will probably witness significant corrections, and in the case of the precious metals market, one is long overdue.
Much like in March, it seems that the evident economic decline might trigger a sell-off.
At this point, we would like to quote what we wrote about the aspects of the virus scare and how the market reacts to them. In short, gold (and other markets) reacted when people started to strongly consider the pandemic's economic implications, a topic that was ubiquitous in the media.
Undoubtedly, the most important factor for gold will be the economic implications of the second Covid-19 wave. How do we know that? Because we compared what people were searching for (online) with how the gold prices were shaped. There's a lot more data available on https://searchingcovid19.com/, but we'll focus on the chart that shows us exactly when people were getting interested in each aspect of the pandemic, and we'll compare that to gold.
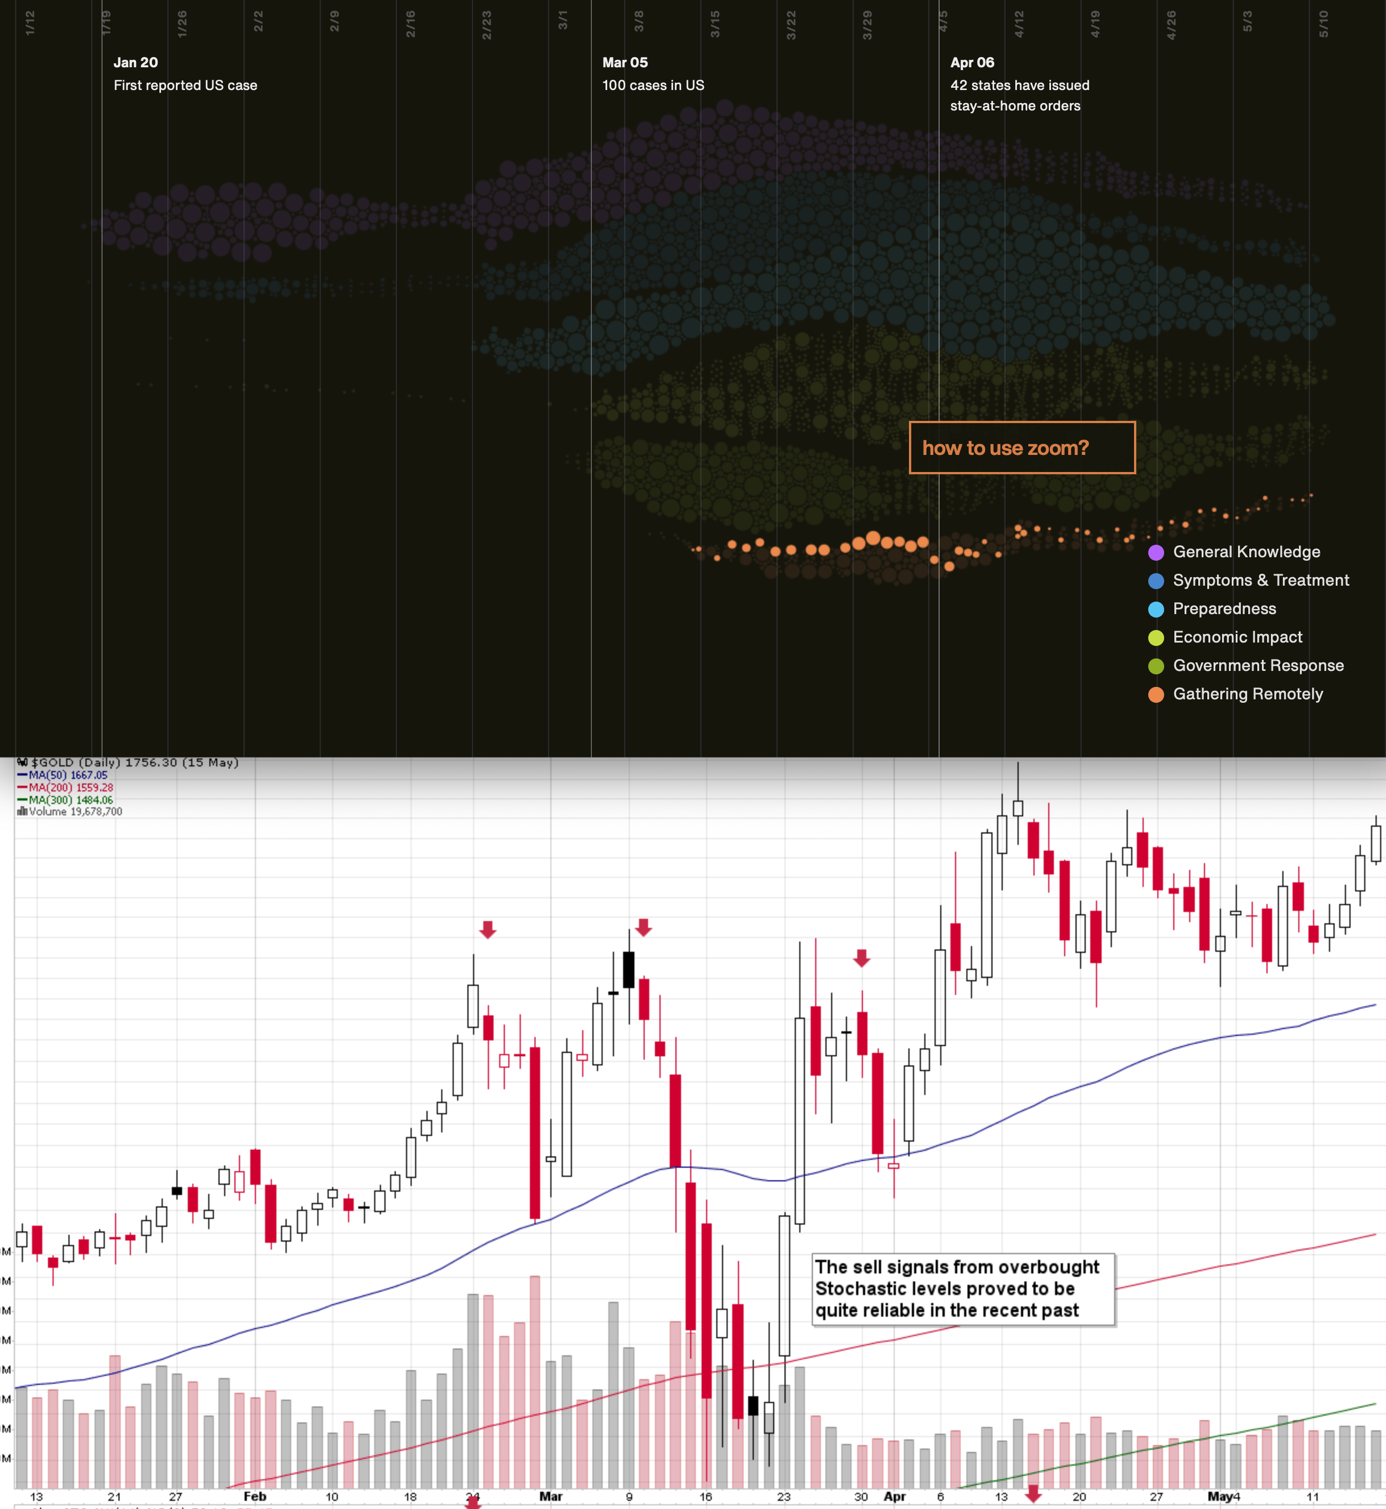
We aligned both charts with regard to time. The chart on the bottom is from Stockcharts.com and it features gold's continuous futures contract. The gold price (and the USD Index value) really started to move once people got particularly interested in the economic impact of the pandemic and in the government's response.
In the recent days (and weeks) the news is dominated by other issues. Once people start considering the economic implications of the second wave of this coronavirus, the prices would be likely to move.
The news coming from the Fed is positive for gold in the long run, but in the short term, they continue to indicate risk for the economy. This risk is likely to translate into lower stock values and initially gold is likely to slide given the above - just like it did in March.
All in all, gold is likely to rally far in the long run, but in the short run it’s vulnerable to a sizable decline, when the economic implications of the pandemic’s continuation become obvious to investors.
Stocks and the Dollar Weigh In
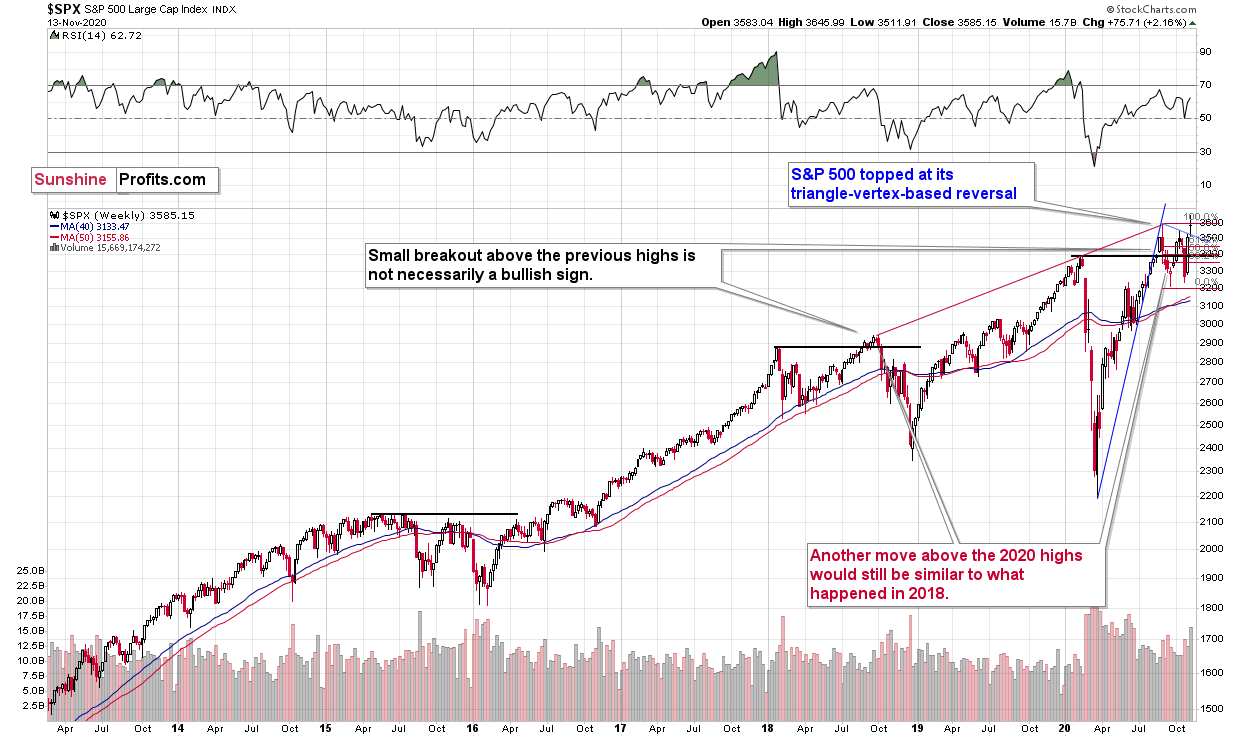
Stocks are testing their previous highs and that’s the case with both the medium-term and the very short-term pictures (stocks just moved closer to last Monday’s intraday high). Will these tests be successful? Growing Covid-19 cases and an increasing number of hospitalizations suggest that this will not be the case.
The same goes for the shape of last Monday’s (Nov 9th) session. That intraday reversal was profound, and it was accompanied by huge volume. Stocks moved a bit higher shortly thereafter, but this didn’t change the bearish implications of the former.
Consequently, we might see a decline in stocks relatively soon. However, I would like to stress that a decline in stocks is not required for the PMs to decline.
After all, back in 2016, stocks rallied right after the U.S. presidential elections, while PMs declined.
Moreover, let’s keep in mind that the situation continues to be excessive on the forex market.
The recent plunge was dramatic, and the USD Index even managed to invalidate its previous short-term breakout. This was bearish, but:
- Since that time, the USD Index moved above the declining short-term resistance line once again, and at the moment of writing these words, it’s verifying the breakout.
- There are more powerful bullish forces that remain intact, so the above didn’t change the outlook.
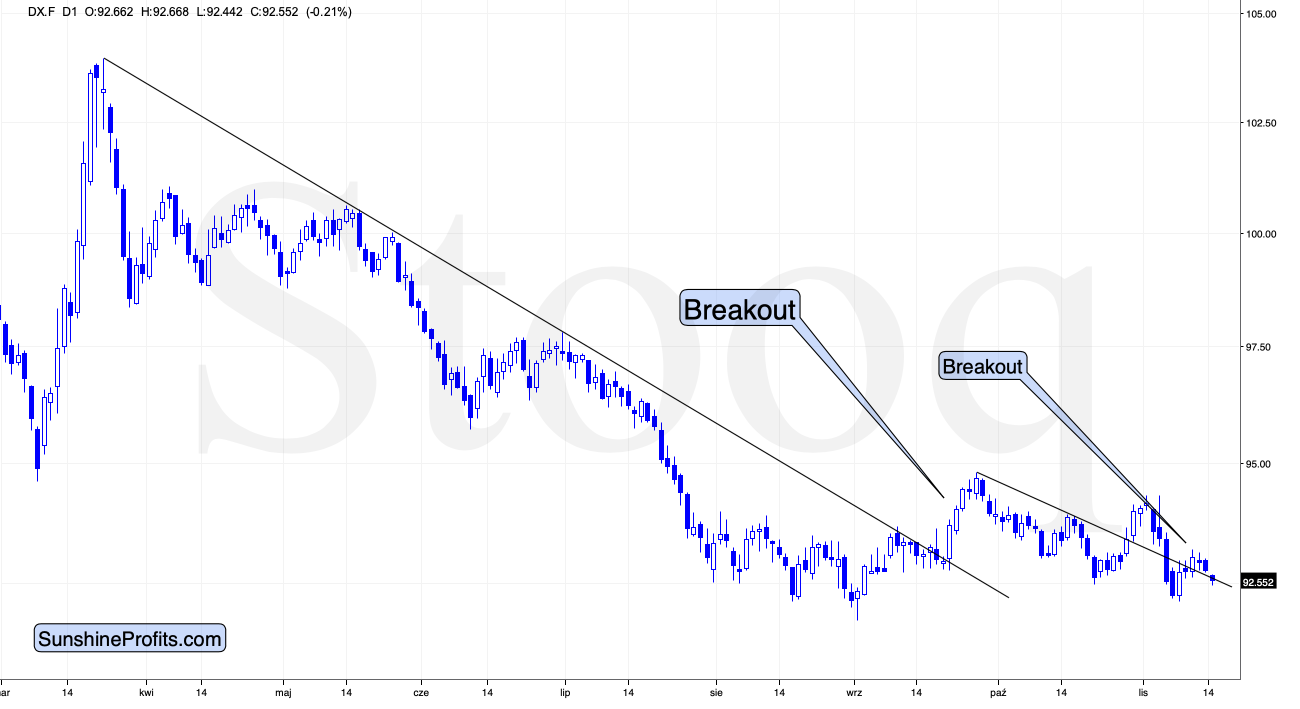
The quite obvious – and important – detail that we see in the above chart is that the USD Index didn’t slide to new medium-term lows, let alone the previously broken medium-term declining support line. Short-term indications improved, but it’s important to remember that they are not as important as medium or long-term ones…and speaking of the latter – let’s zoom out.
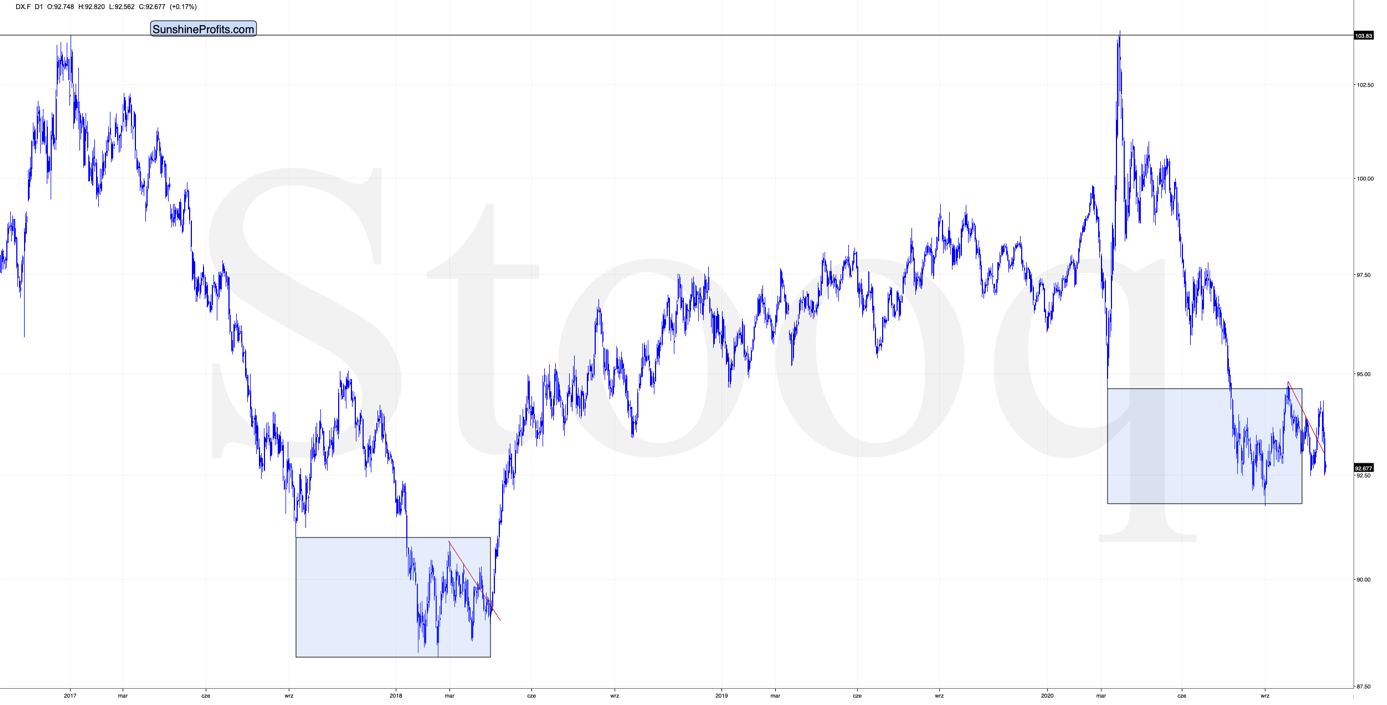
Please note that the shape of the current broad bottom is almost identical to what we saw in early 2018. The rectangles on the above chart are 100% identical. The left rectangle is based on the September 2017 low, the 2018 low, and final low of the broad bottom. Copying this rectangle and attaching it to the March 2020 bottom provides us with an almost 100% precise downside target for the recent low. The follow-up highs (March 2018 and September 2020) are very closely aligned as well.
Moreover, in both cases, the initial bottom was not the final one, but the final one followed shortly. We then saw (again, in both cases), a relatively sharp rally that failed and then another low that was not as low as the previous bottom. Then there was yet another fake rally (and a fake breakout above the declining red resistance line). This breakout was then invalidated and what followed was THE final bottom in the USD Index.
Oh, and both declines started from the same level (about 103.8).
Yes, the situation is as ridiculously similar as I described above. But wait, there’s more!
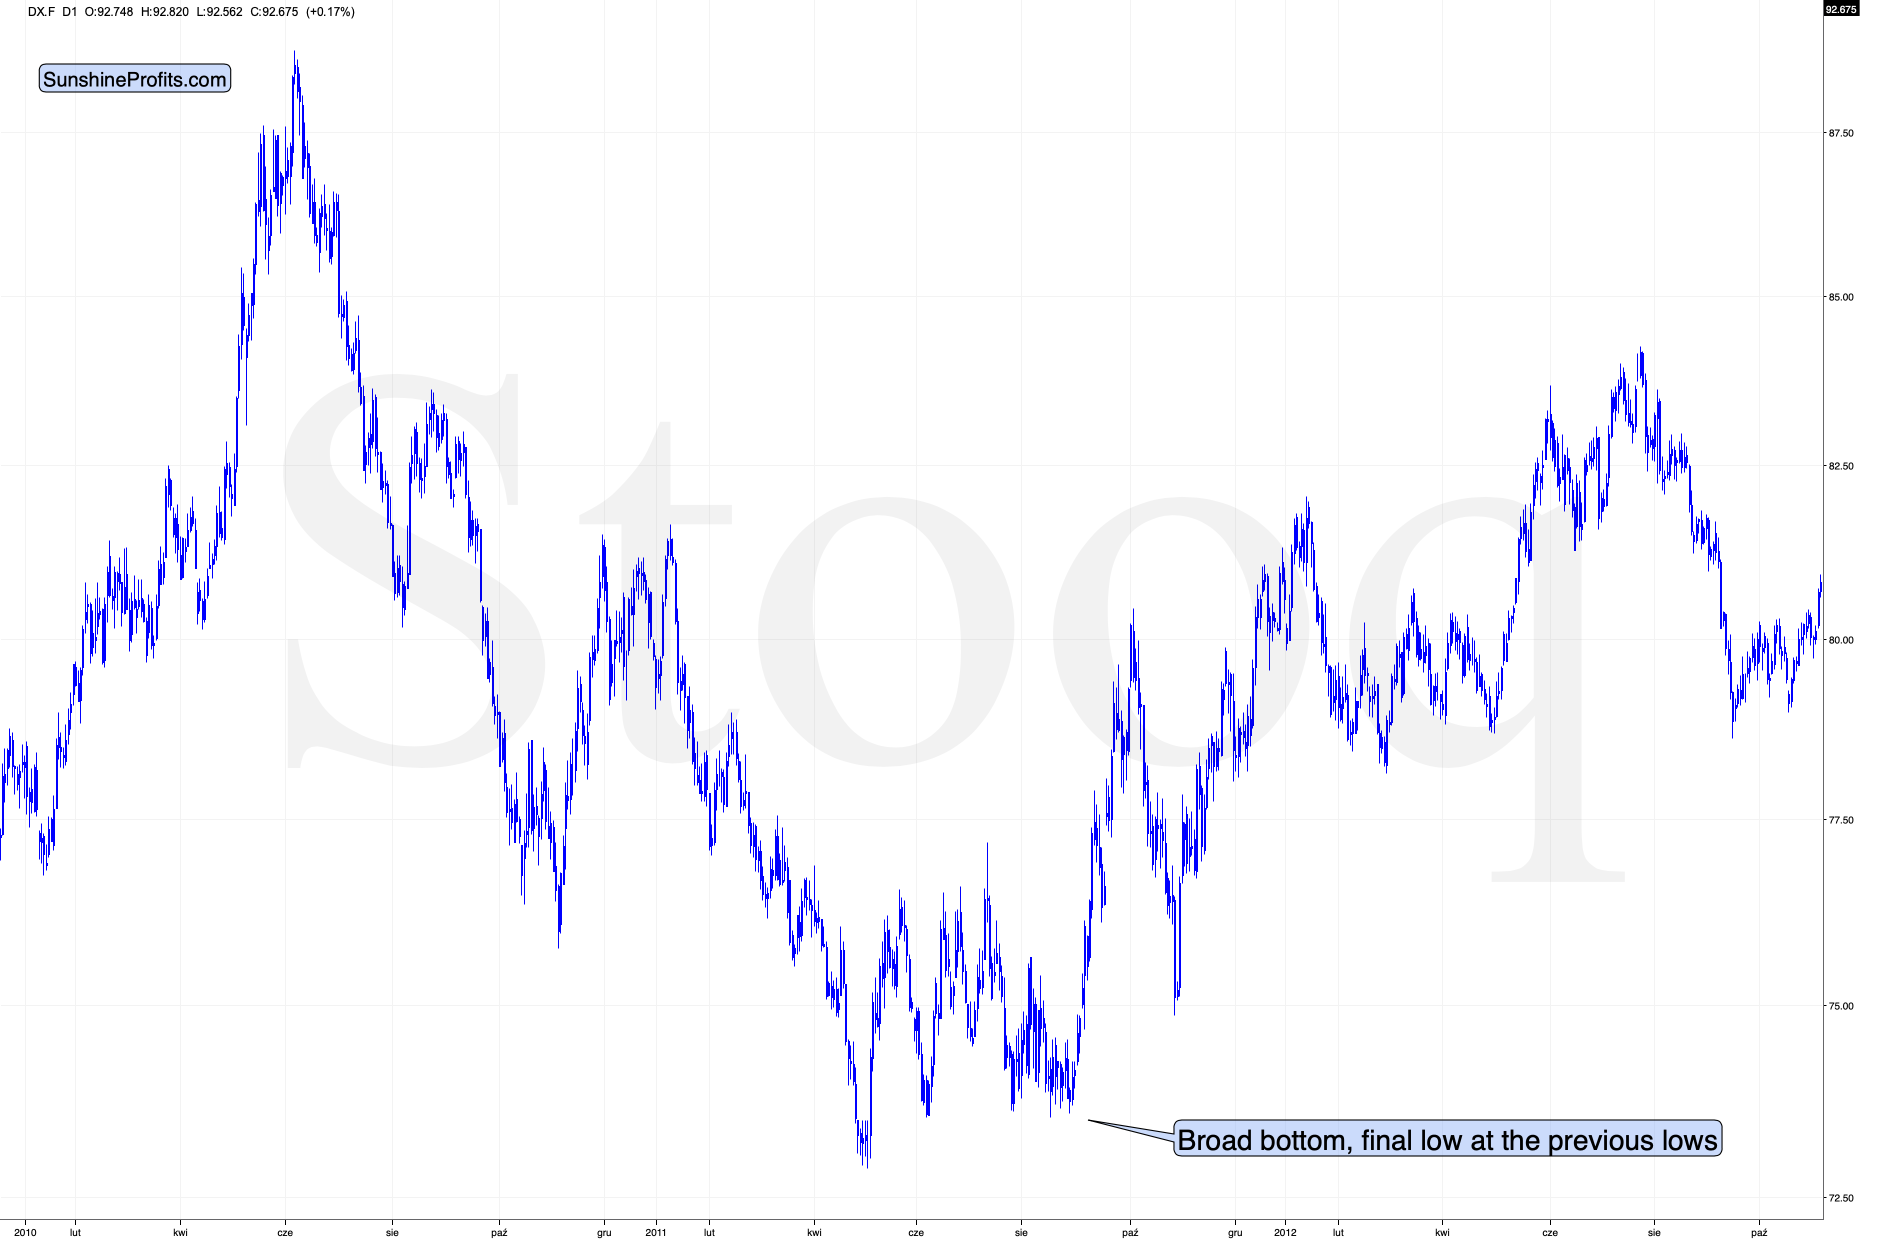
The bottoming pattern in 2011 is also very similar to what we see right now and what we saw earlier this year. The final bottom even took place at the previous lows – just like what we saw yesterday. This analogy is particularly important because August 2011 is when gold formed its multi-year high.
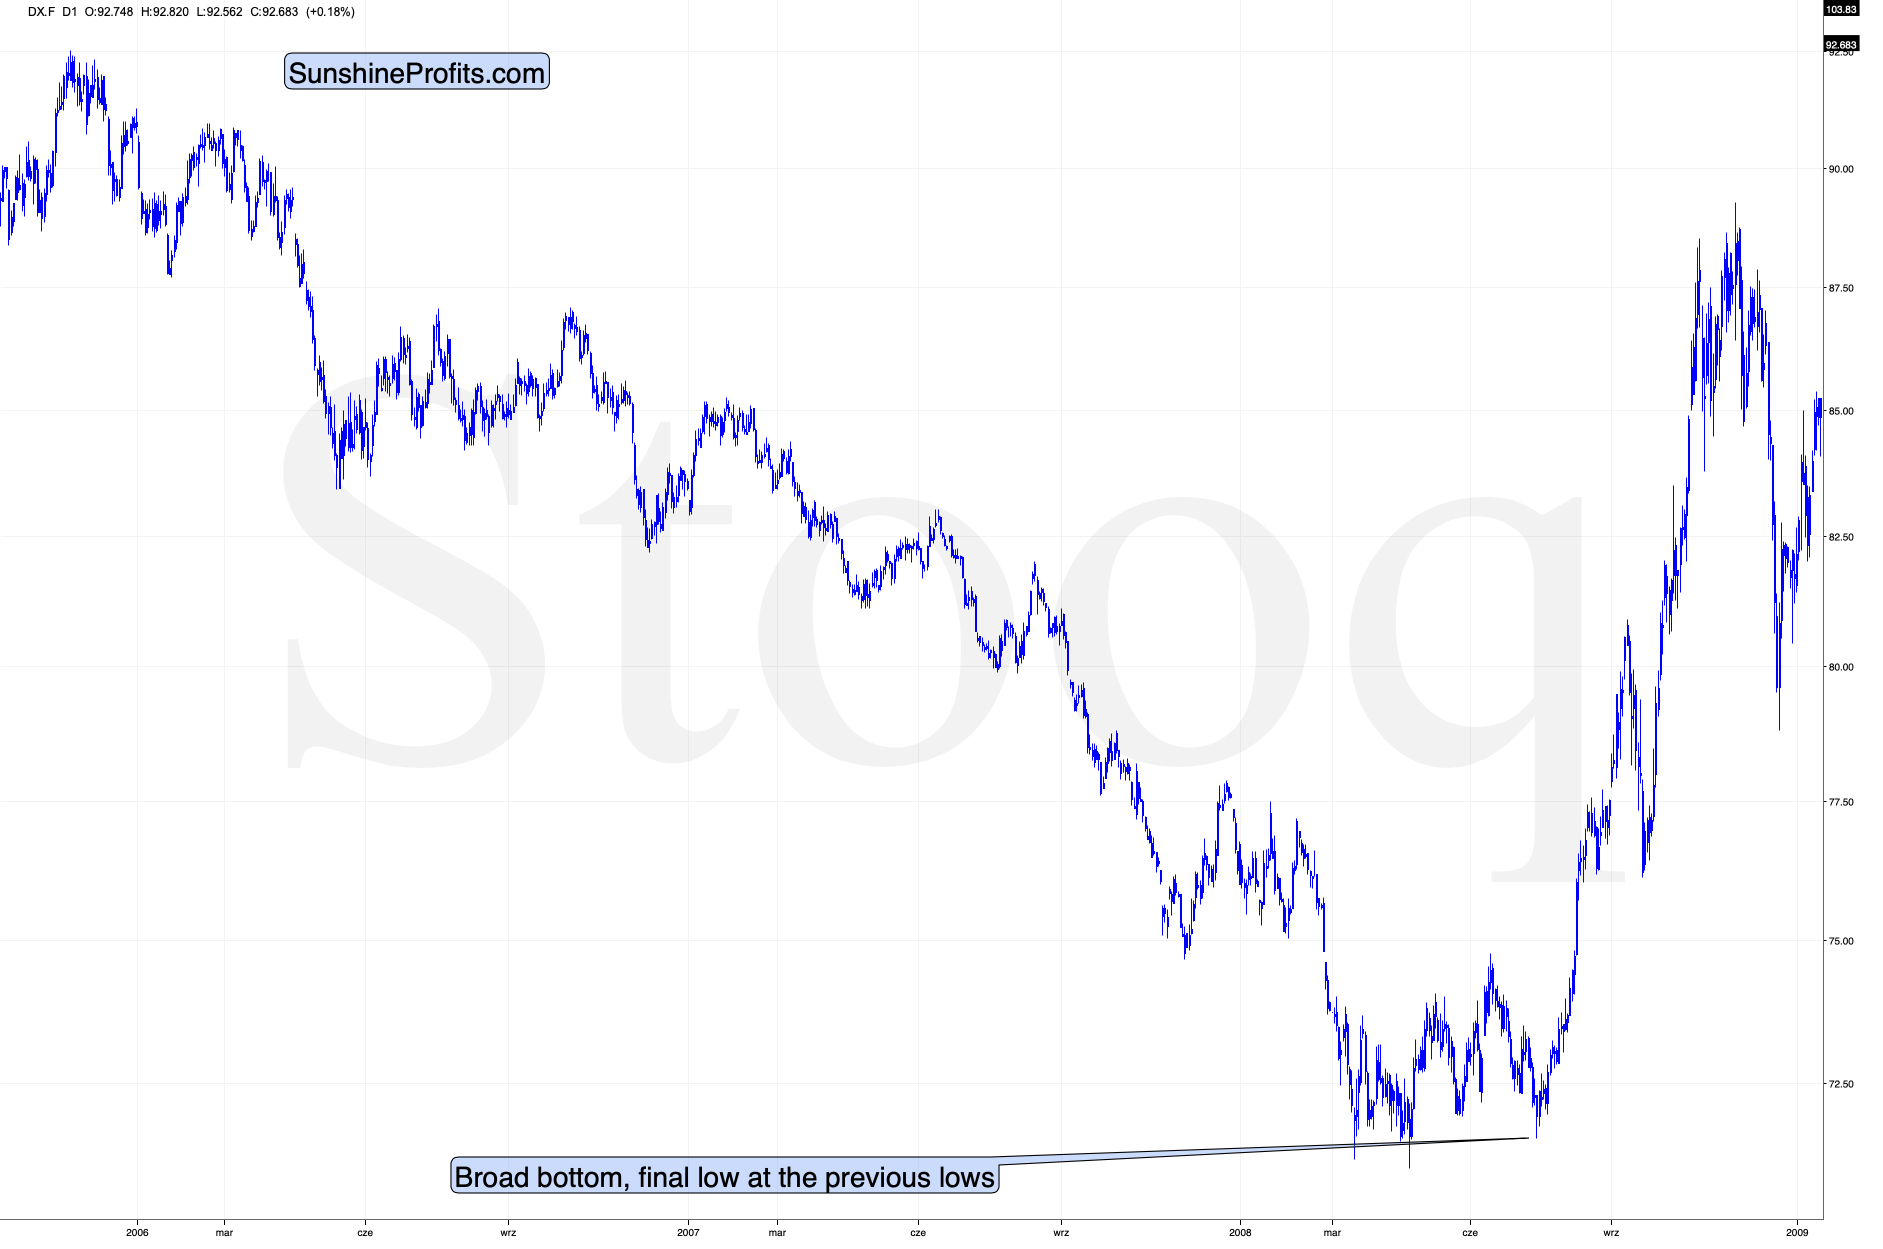
Back in 2008, the USD Index bottomed in a very similar manner. And yes, the final bottom formed close to the previous lows – once again just like what we saw this week.
So, does the invalidation of the short-term breakout in the USD Index really make the outlook bearish right now? In light of the above powerful analogies to the past major bottoms – absolutely not.
And as the USD Index soars, gold is likely to slide.
Additionally, let’s keep in mind that the short-term strength in the USD Index is likely to translate into an invalidation of the small breakdown below the rising support line that we see on USDX’s long-term chart.
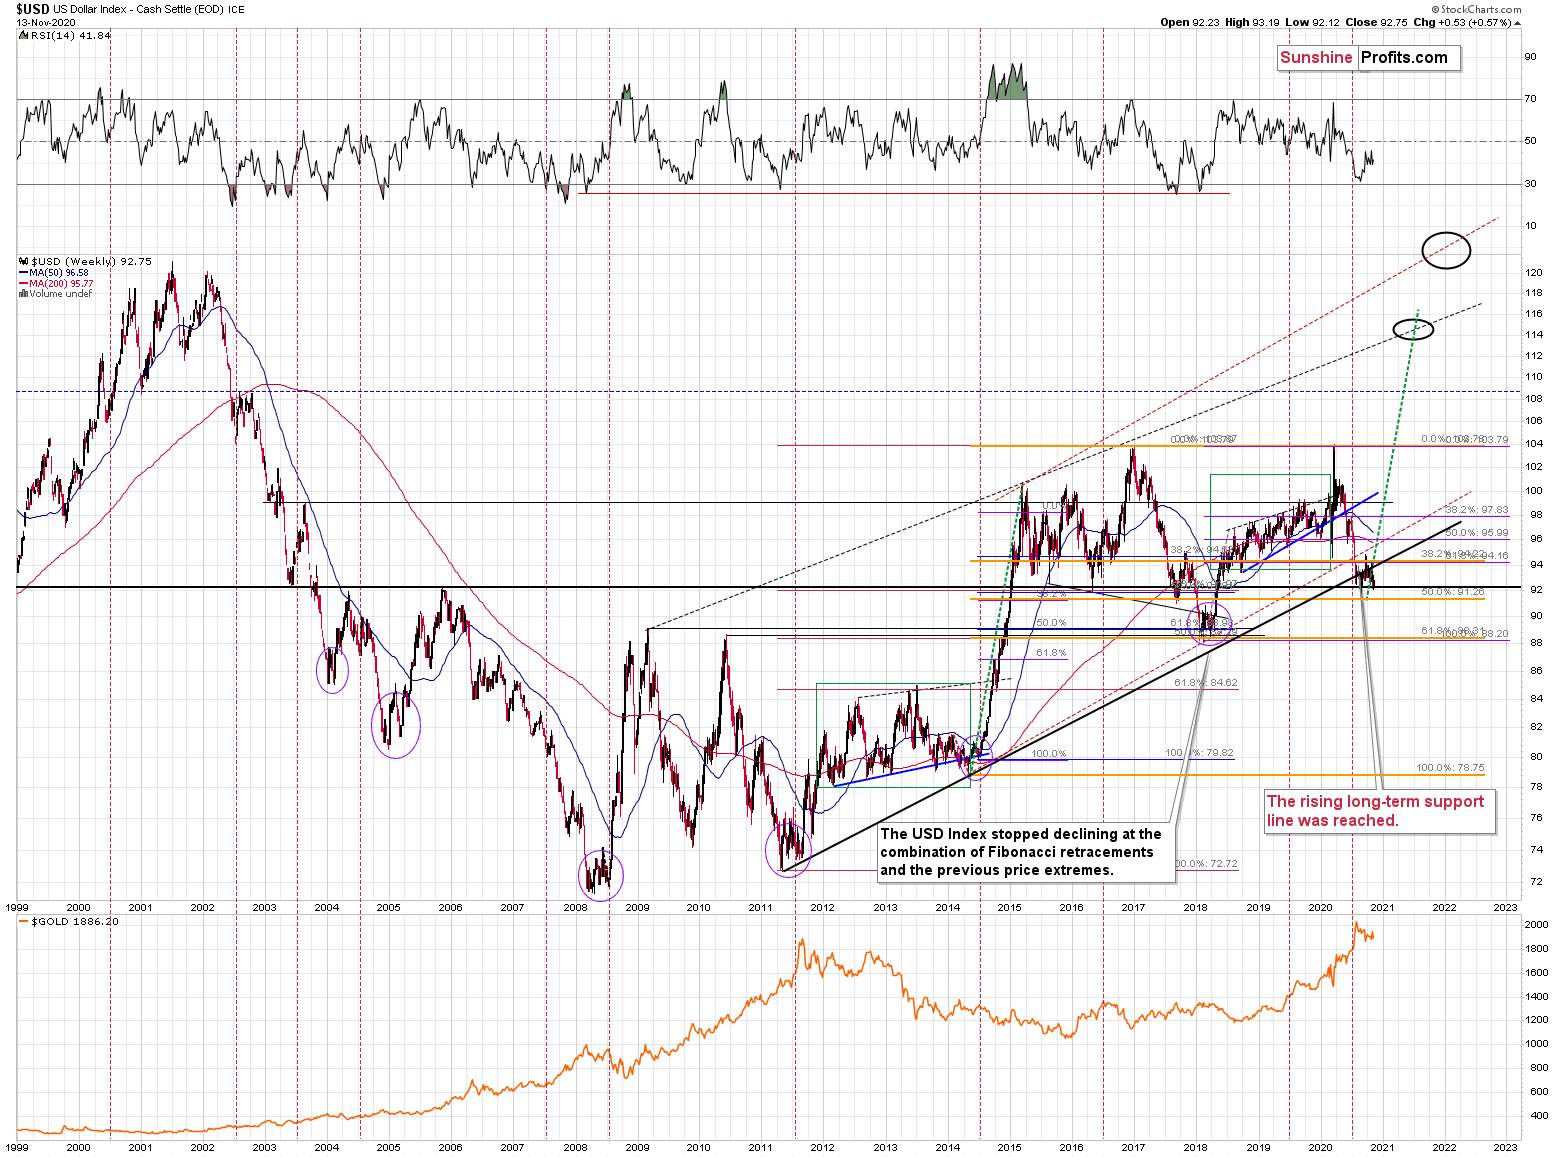
My previous comments on that matter remain up-to-date (with the slight change that at the moment USDX is a bit below the support line, but let’s keep in mind that similar small breakdowns were invalidated shortly).
Remember when in early 2018 we wrote that the USD Index was bottoming due to a very powerful combination of support levels? Practically nobody wanted to read that as everyone “knew” that the USD Index is going to fall below 80. We were notified that people were hating on us in some blog comments for disclosing our opinion - that the USD Index was bottoming, and gold was topping. People were very unhappy with us writing that day after day, even though the USD Index refused to soar, and gold was not declining.
Well, it’s exactly the same right now.
The USD Index was at a powerful combination of support levels. One of them is the rising, long-term, black support line based on the 2011 and 2014 bottoms. The other major support level and a long-term factor is the proximity to the 92 level – that’s when gold topped in 2004, 2005, and where it – approximately – bottomed in 2015, and 2016.
The USDX just moved to these profound support levels, broke slightly below them, and now it has clearly invalidated this breakdown. For many weeks, we’ve been warning about the likely USD Index rally, and we finally saw it.
Quoting my previous comments:
USD Index moved briefly below the long-term, black support line and then it invalidated this breakdown before the end of the week. This is a very bullish indication for the next few weeks.
Before moving to the short-term chart, please note that the major bottoms in the USD Index that formed in the middle of the previous years, often took form of broad bottoms.
Consequently, the current back and forth trading is not that surprising. This includes the 2008, 2011, and 2018 bottoms.
A crucial aspect is that the rally that we’ve witnessed so far is just the tip of the bullish iceberg. The breakdown below the key support levels was invalidated, which is a strong bullish indicator. Since it happened on a long-term chart and the temporarily broken lines were critical, the implications are incredibly important as well– and they should be visible from the long-term perspective.
So, how high could the USD Index rally now? At least to the 100 level (approximately). This way, the upcoming rally would almost match the rally that started after the previous major invalidation – the 2018 one.
Still, we wouldn’t rule out a scenario in which the USD Index rallies above its 2020 highs before another major top. After all, the USD Index is after a very long-term breakout that was already verified several times.
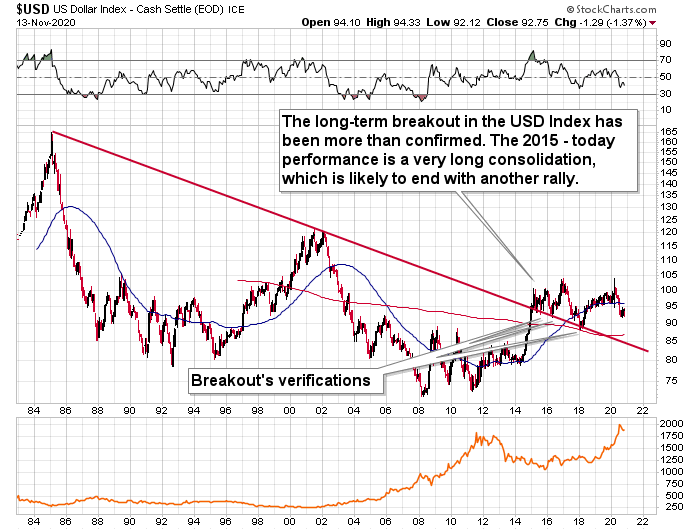
Taking into account USDX’s lengthy breakout, its several breakout verifications, and the 5-year consolidation, it seems that the USD Index is ready to rally much higher – perhaps to approximately to the 120 level.
Please note that the consolidation that preceded the previous rally to 120 that took place between 1997 and 2000 happened when the USD index was trading at relatively similar price levels – approximately between 90 and 105.
Overall, as the outlook remains bullish for the USD Index, it remains bearish for the precious metals sector. This is particularly the case if we take into account that recently, the Gold Miners Bullish Percent Index showed the highest possible overbought reading.
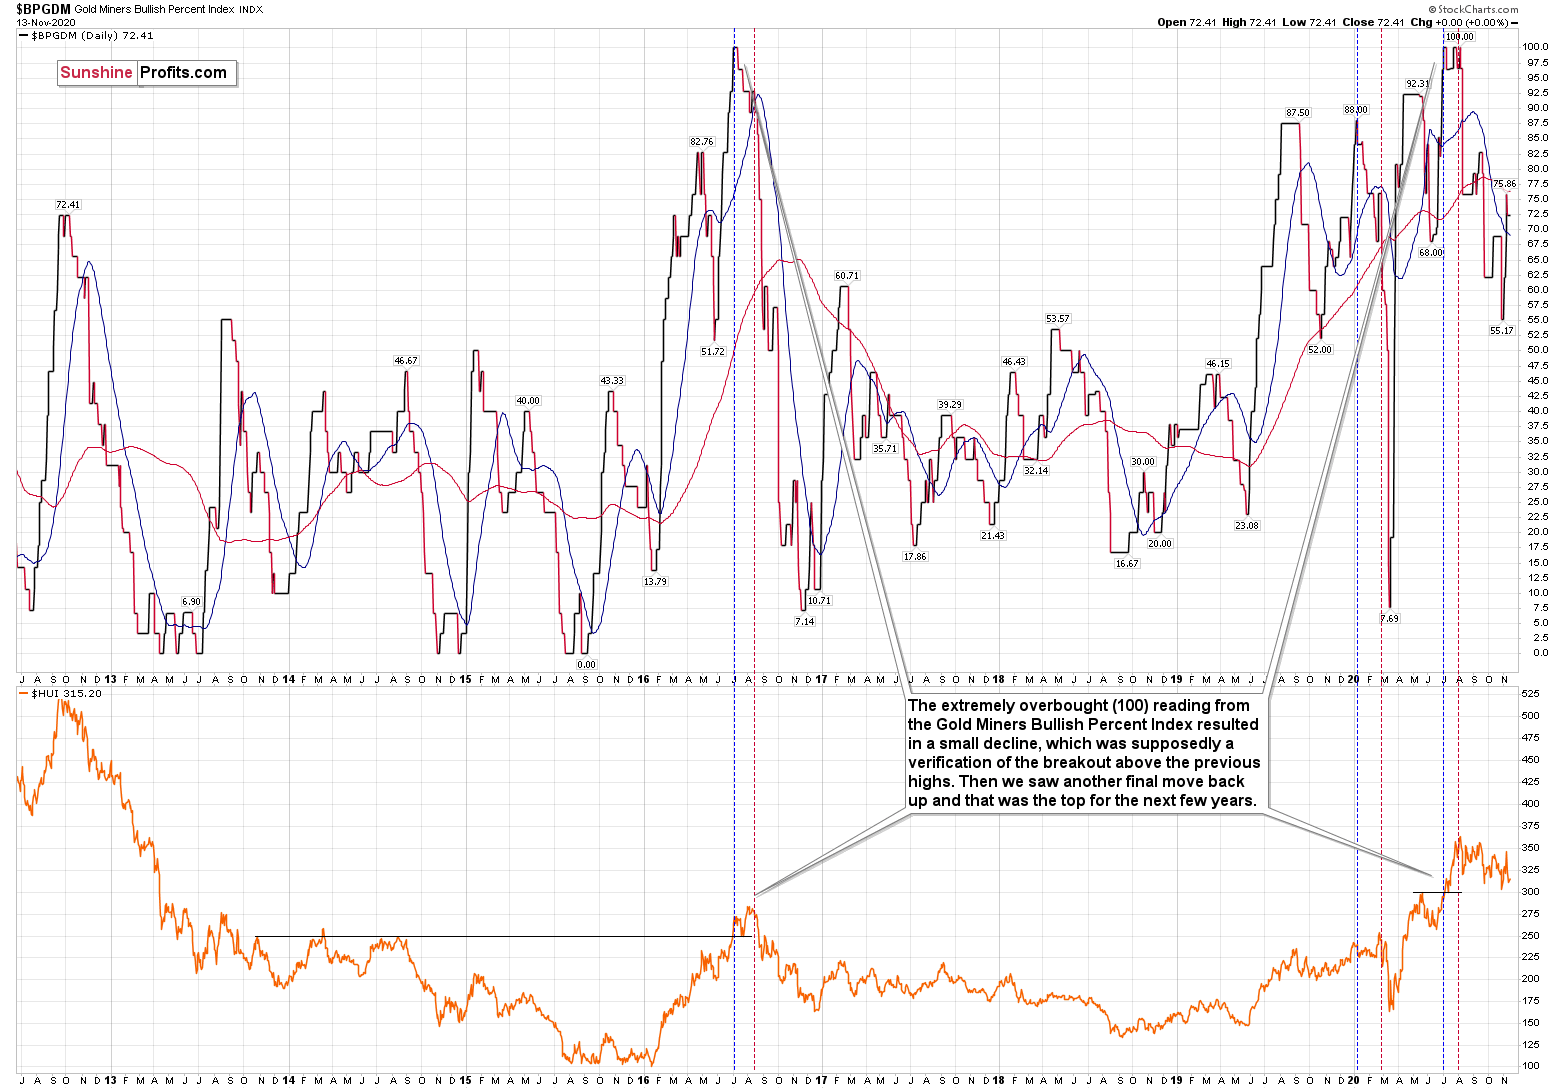
The excessive bullishness was present at the 2016 top as well and it didn’t cause the situation to be any less bearish in reality. All markets periodically get ahead of themselves regardless of how bullish the long-term outlook really is. Then, they correct. If the upswing was significant, the correction is also quite often significant.
Please note that back in 2016, there was an additional quick upswing before the slide and this additional upswing had caused the Gold Miners Bullish Percent Index to move up once again for a few days. It then declined once again. We saw something similar also this time. In this case, the move up took the index once again to the 100 level, while in 2016 this wasn’t the case. But still, the similarity remains present.
Back in 2016, when we saw this phenomenon, it was already after the top, and right before the big decline. Given the situation in the USD Index, it seems that we’re seeing the same thing also this time.
Please note that back in 2016, after the top, the buying opportunity didn’t present itself until the Gold Miners Bullish Percent Index was below 10. Currently, it’s above 70, so it seems that miners have a long way to go before they bottom (perhaps a few months – in analogy to how gold declined in 2016).
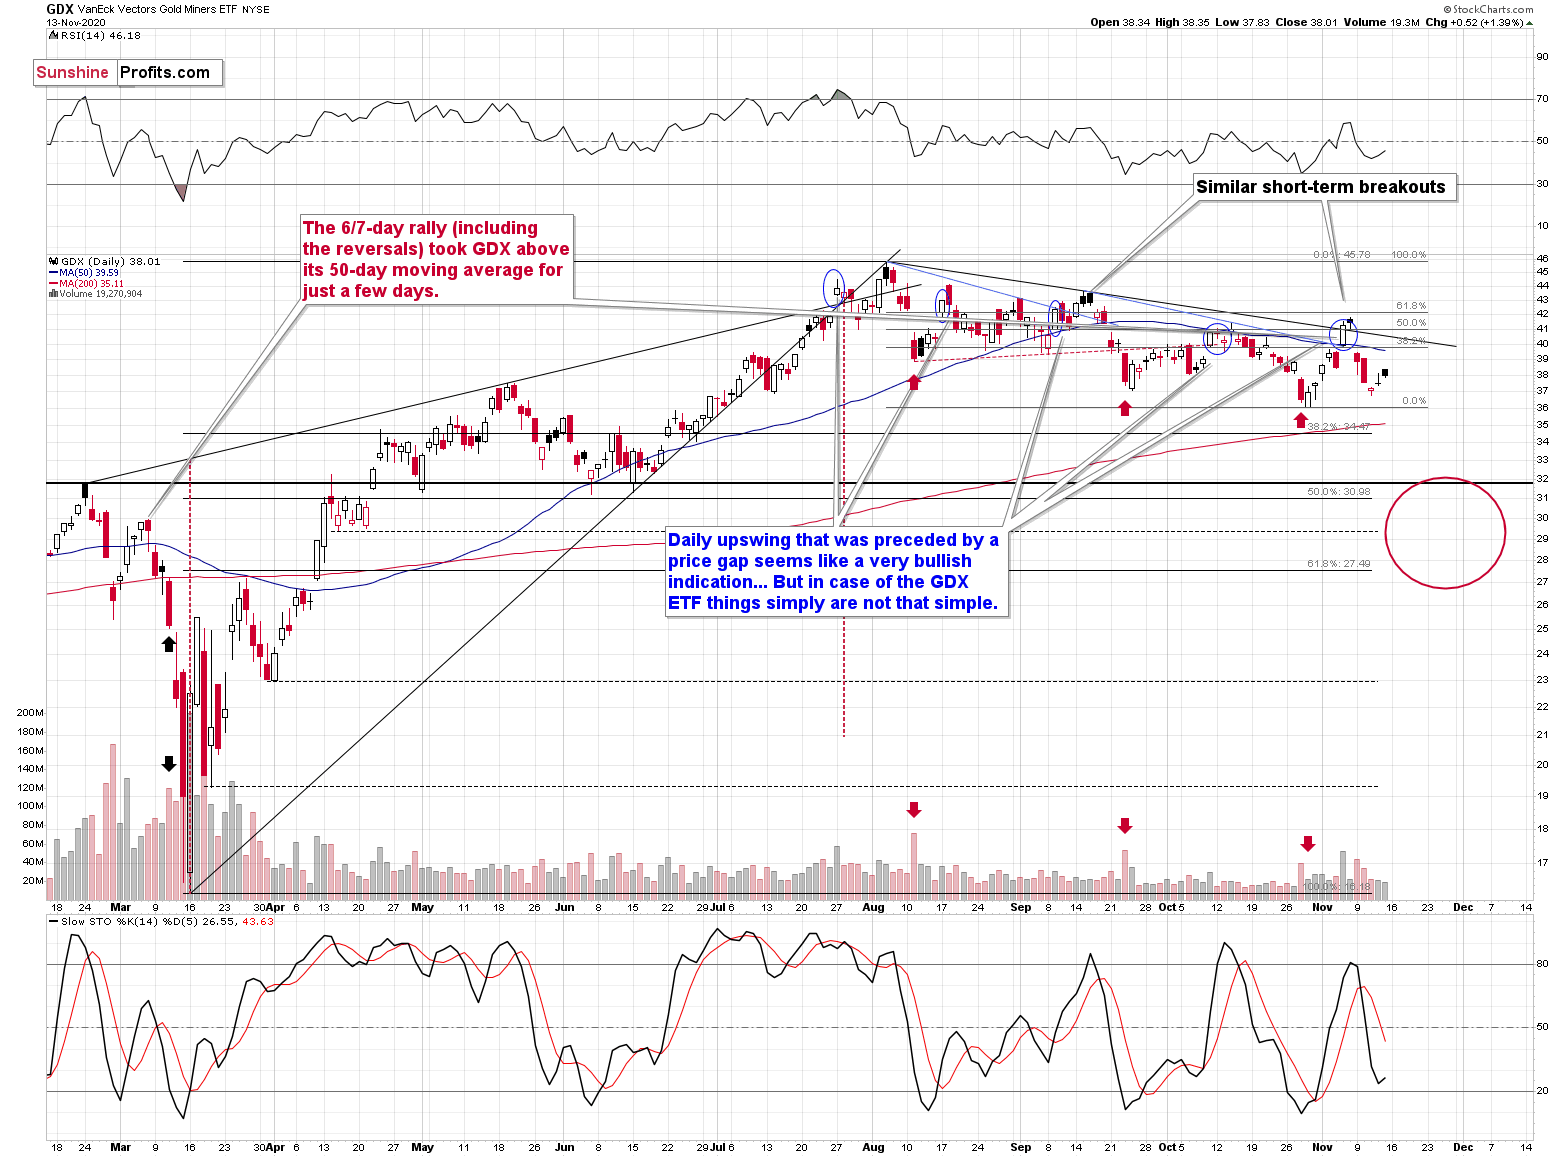
On Thursday (Nov 12th) and Friday (Nov 13th) of last week, miners moved and closed higher, but it’s important to note that their upswing was tiny and not accompanied by strong volume. In other words, it has all the characteristics of the breather that’s going to be followed by another move in the direction in which the market had been moving previously. The previous move was down, so the implications are bearish.
The intraday nature of Friday’s and Thursday’s moves is also quite informative. In both cases miners moved higher – just as gold did – but then they declined, erasing large part of the preceding gains before the end of the session. That’s yet another clue confirming the counter-trend nature of the recent upswing in the miners.
It seems that in the previous weeks, miners once again rallied in the manner that is similar to other sessions that we marked with blue ellipses on the chart.
In particular, what we saw in mid-September appears similar to what we see right now. Back then, the GDX ETF was also after a small breakout above its short-term, blue support line and the 50-day moving average. A relatively sharp short-term decline followed at that time, and the same seems likely also this time.
Also, let’s not forget that the GDX ETF has recently invalidated the breakout above the 61.8% Fibonacci retracement based on the 2011 – 2016 decline.
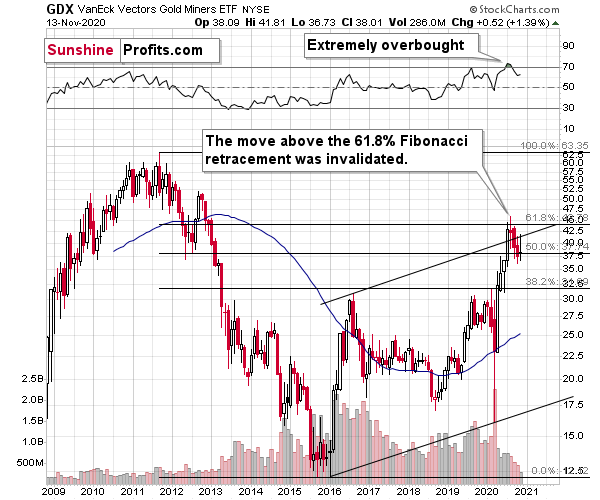
When GDX approached its 38.2% Fibonacci retracement, it declined sharply – it was right after the 2016 top. Are we seeing the 2020 top right now? This is quite possible – PMs are likely to decline after the sharp upswing, and since there is only less than two months left before the year ends, it might be the case that they move north of the recent highs only in 2021.
Either way, miners’ inability to move above the 61.8% Fibonacci retracement level and their invalidation of the tiny breakout is a bearish sign.
The same goes for miners’ inability to stay above the rising support line – the line that’s parallel to the line based on the 2016 and 2020 lows.
Let’s proceed to metals themselves.
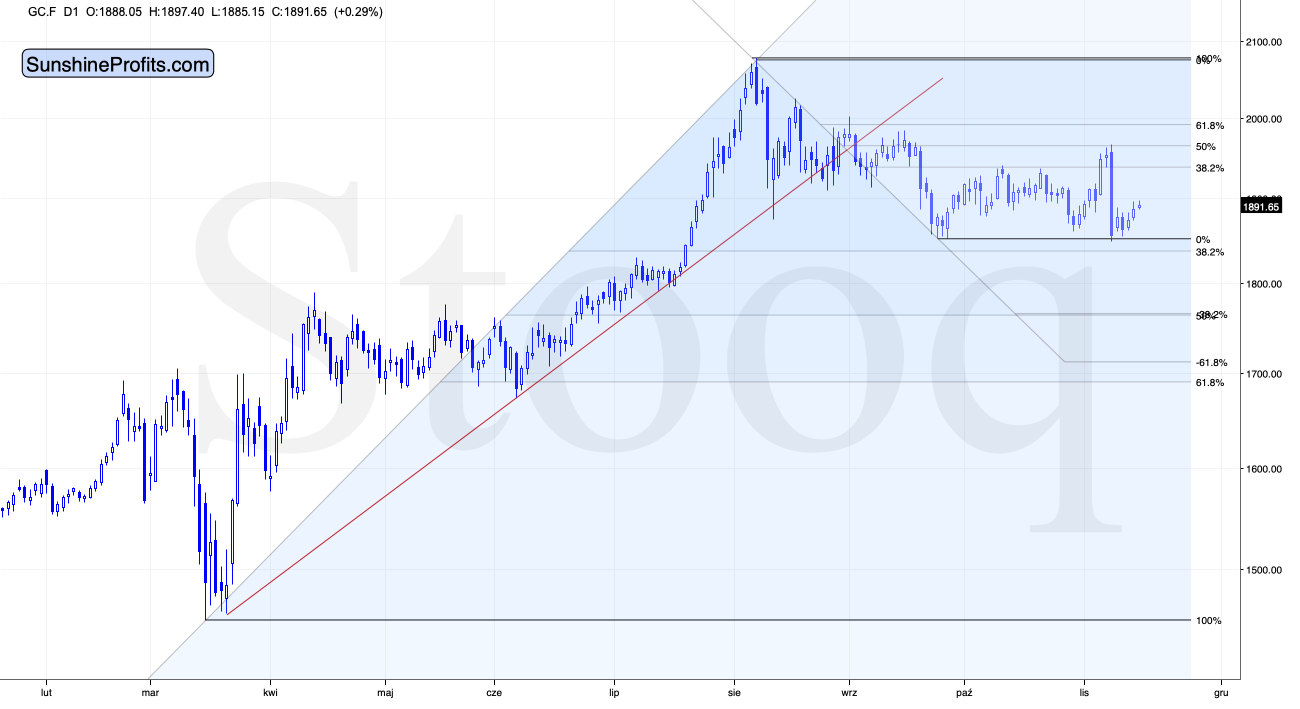
Just as miners, gold seems to be taking a breather. The breather was quite likely to occur after such a big daily decline, and there’s not much more that we can say about it per se.
However, its size is quite interesting when we compare it to the size of the corrective upswing in silver.
Please note that gold is more or less in the midway between the bottom and the 38.2% Fibonacci retracement based on the August – November decline.
Silver, on the other hand, is much higher in relative terms.
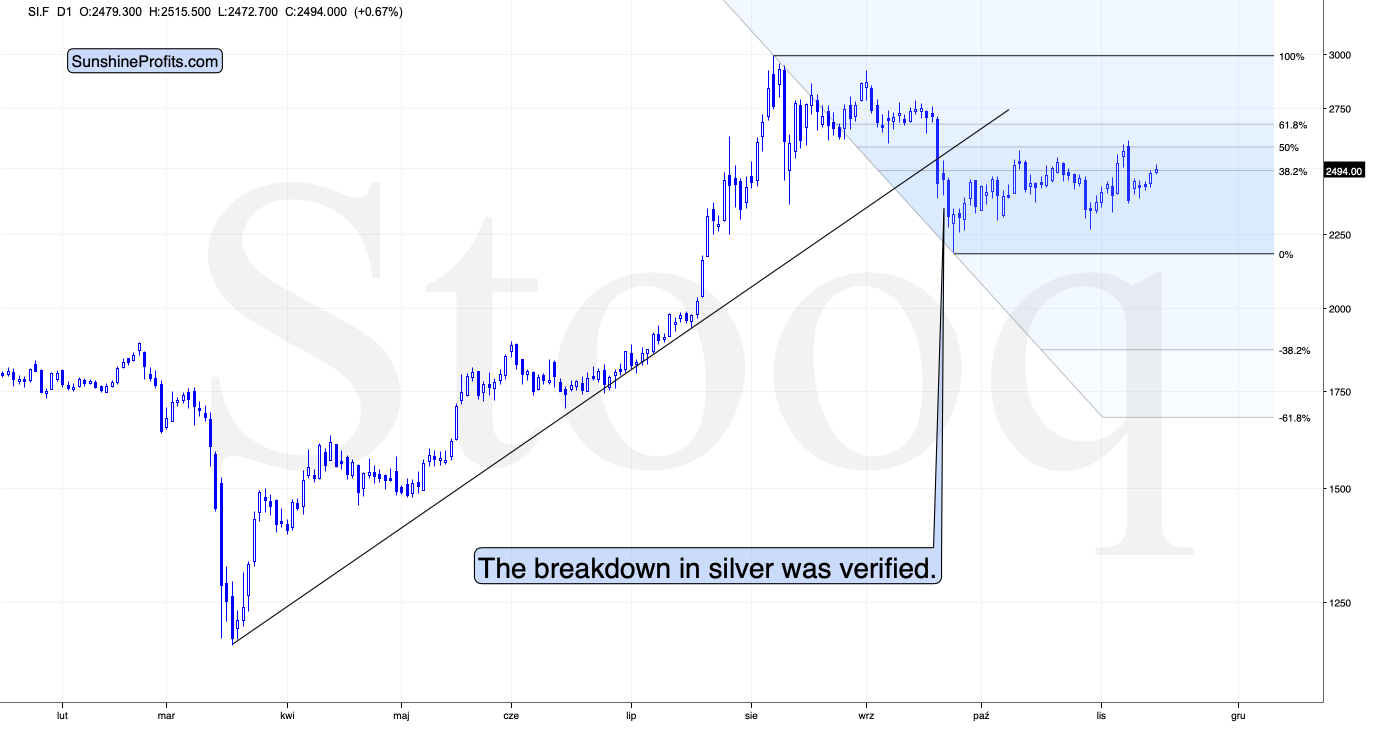
In today’s pre-market trading, silver even moved slightly above the 38.2% Fibonacci retracement.
What does it mean? It means that silver is outperforming gold on a very short-term basis. This might not be exciting to those who are new to the precious metals market, but it should be very exciting for those who have been following my analyses for some time. Silver tends to outperform gold on a short-term basis right before declines. Consequently, the above serves as a bearish confirmation.
Before moving further, I would like to stress that according to above gold chart, the likely downside target for gold is at about $1,700, predicated on the previous lows and the 61.8% Fibonacci retracement, based on the recent 2020 rally.
Having said, that, let’s focus on the fact that gold recently failed to move above its previous long-term (2011) high. Since history tends to repeat itself, it’s only natural to expect gold to behave as it did during its previous attempt to break above its major long-term high.
And the only similar case is from late 1978 when gold rallied above the previous 1974 high. Let’s take a look at the chart below for details (courtesy of chartsrus.com)
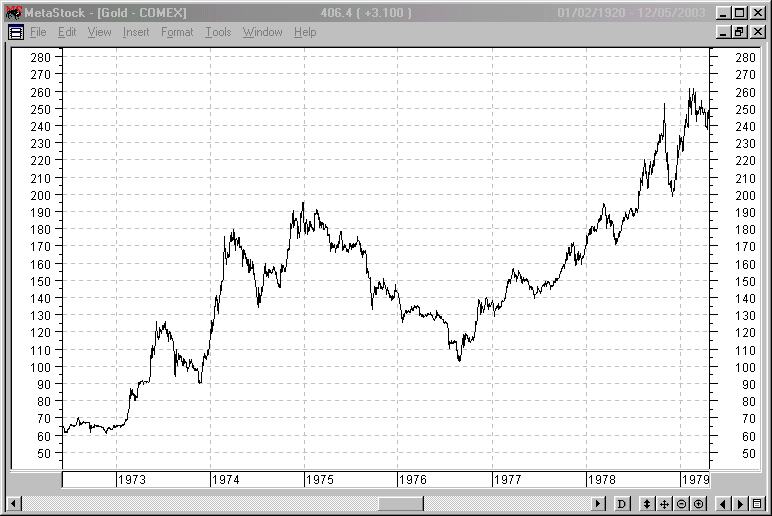
As you can see above, in late 1978, gold declined severely right after it moved above the late-1974 high. This time, gold invalidated the breakout, which makes the subsequent decline more likely. And how far did gold decline back in 1978? It declined by about $50, which is about 20% of the starting price. If gold was to drop 20% from its 2020 high, it would slide from $2,089 to about $1,671.
This is in perfect tune with what we described previously as the downside target while describing gold’s long-term charts:
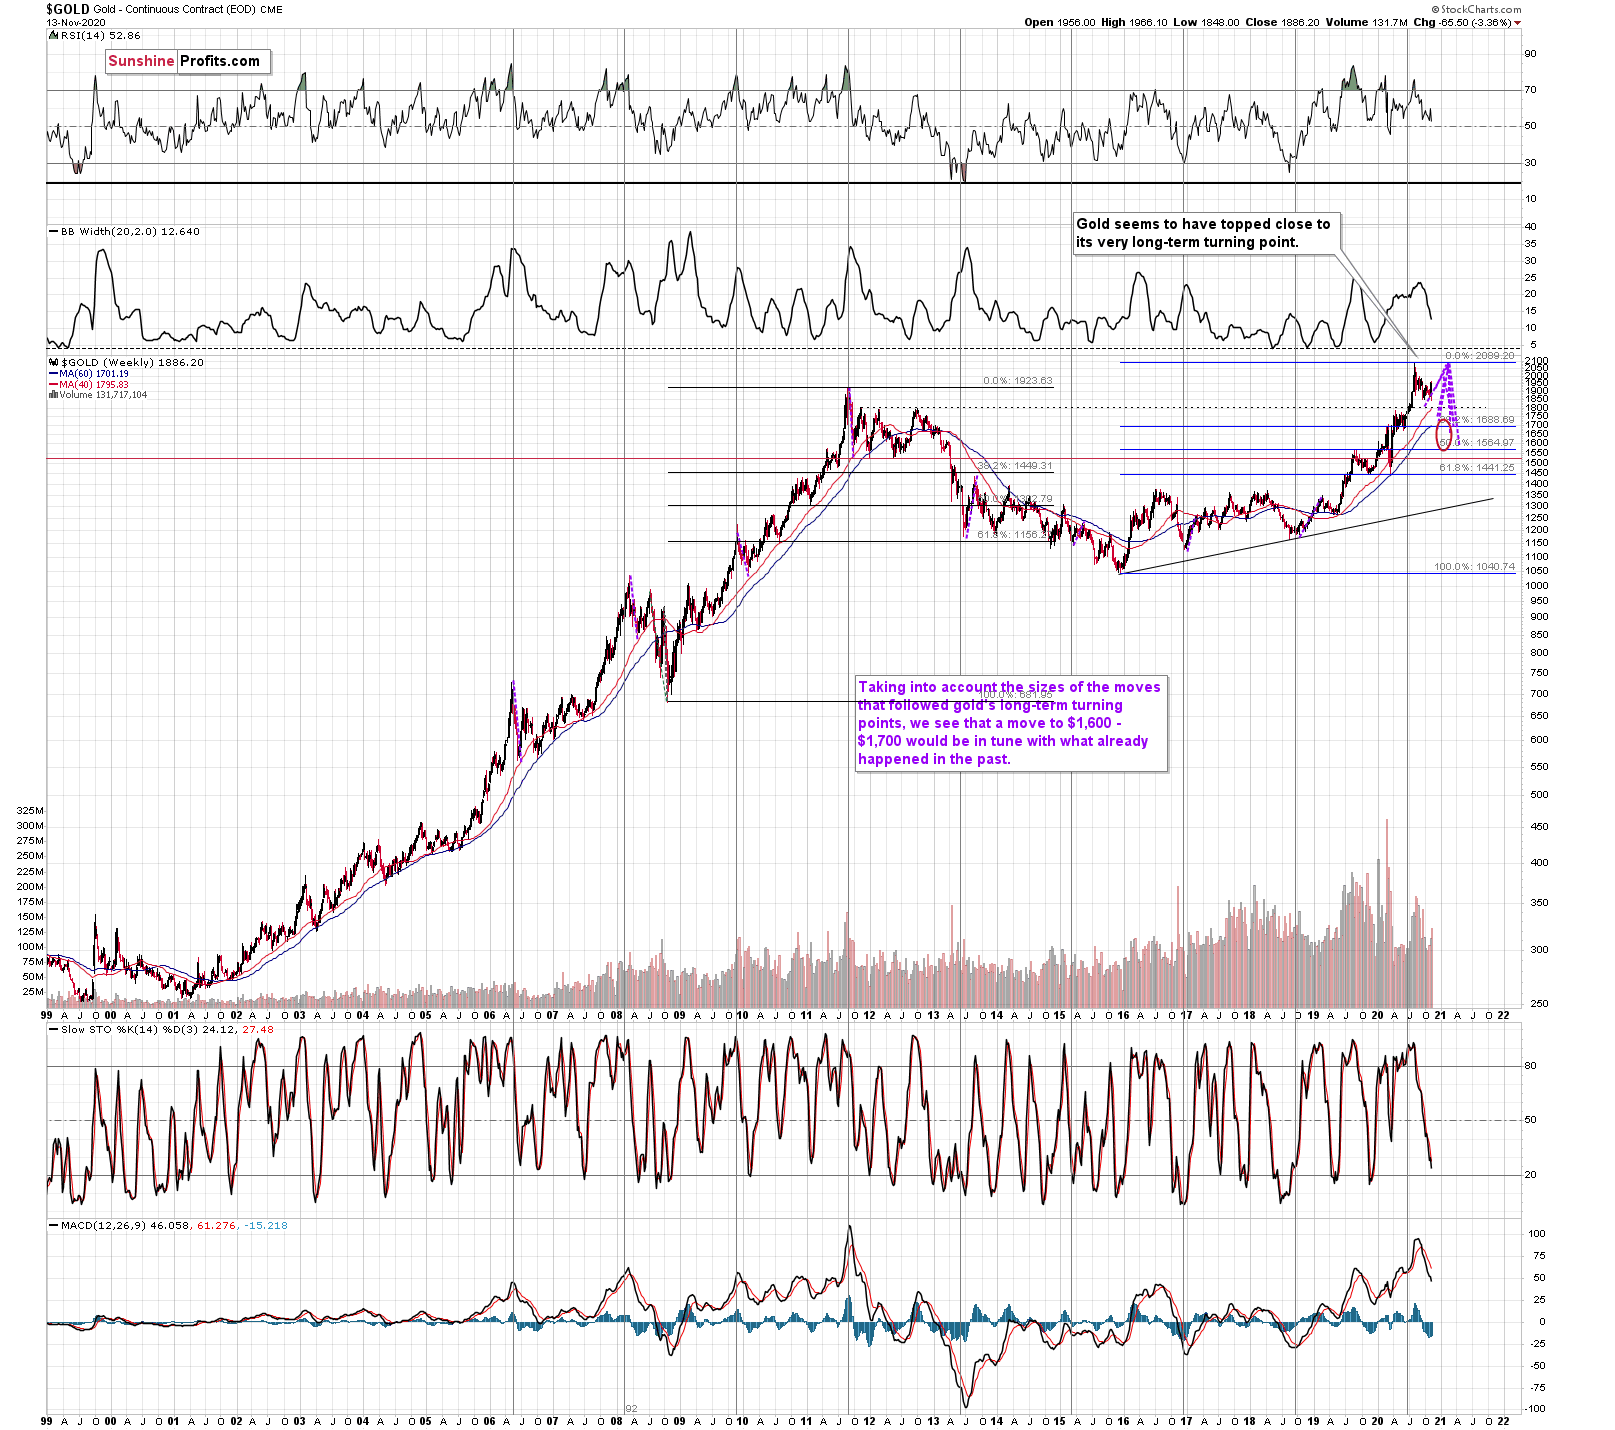
The chart above shows exactly why the $1,700 level is even more likely to trigger a rebound in gold, at the very minimum.
The $1,700 level is additionally confirmed by the 38.2% Fibonacci retracement based on the entire 2015 – 2020 rally.
There’s also possibility that gold would decline to the $1,500 - $1,600 area or so (50% Fibonacci retracement and the price level to which gold declined initially in 2011), but based on the size of the recent upswing, we no longer think that this scenario is the most likely one.
Gold is (from the long-term point of view) after its very long-term turning point, and since the most recent move has been to the upside, its implications are bearish.
We used the purple lines to mark the previous price moves that followed gold's long-term turning points, and we copied them to the current situation. We copied both the rallies and declines, which is why it seems that some moves would suggest that gold moves back in time - the point is to show how important the turning point is in general.
Based on the information that we have available right now, it seems likely that gold will bottom close to the $1,700 level. That’s very much in tune with how much gold moved after the previous long-term turning points.
Speaking of upside targets, ten weeks ago we wrote:
Based on gold's Fibonacci extensions and the previous major highs and lows (the 2018 high and late-2019 low along with the 2020 low), we get a nearby upside target of $2085. At the moment of writing these words, gold is trading at $2044. Given this week's volatility, it could even be a matter of hours before gold reaches the above-mentioned target and reverses. Taking closing prices into account, gold is up by $35, so if it reverses significantly, we would be likely to see a powerful weekly reversal candlestick and one that causes gold to decline in the following weeks.
That’s more or less what happened. Gold topped at $2,089.20. It then declined quite visibly and closed last week at about $1,950.
Do you get the feeling that you have already seen gold perform this way before? Because you did.
The history rhymes, but this time, the similarity is quite shocking.
We copied the short-term chart and pasted it on the long-term chart above and next to the 2011 top. We pasted it twice, so that you can easily compare gold’s performance.
They are very similar to say the least. Yes, these patterns happened over different periods, but this doesn’t matter. Markets are self-similar, which is why you can see similar short-term trends and long-term trends (with regard to their shapes). Consequently, comparing patterns of similar shape makes sense even if they form over different timeframes.
After a sharp rally, gold declined quickly. Then we saw a rebound, and a move back to the previous low. Then, after a bit longer time, gold moved close to the most recent high and started its final decline. This decline was less volatile than the initial slide. That’s what happened when gold topped in 2011 (and in the following years), and that’s what happened also this year.
The patterns of this level of similarity are rare, and when they do finally take place, they tend to be remarkably precise with regard to the follow-up action.
What is likely to follow based on this pattern, is that we’re likely to see the end of the slower decline, which will be followed by a big and sharp decline – similarly to what we saw in 2013.
The above similarity also shows that gold’s decline might initially have counter-trend rallies – just like what we saw in early 2013. Consequently, the fact that we are just seeing one could be viewed as a bearish confirmation of this self-similarity.
How low could gold slide based on this similarity? Back in 2013, gold declined approximately to the 61.8% Fibonacci retracement based on the preceding rally (the one that started in 2008), so that’s the natural target also this time.
And we already wrote about this particular retracement – it’s approximately at the $1,700 level. This has been our downside target for weeks, and it was just confirmed by this precise self-similar technique.
Another interesting point is that gold made an interim low close to the 50% retracement and the previous lows. Applying this to the current situation suggests that we could see a smaller rebound when gold moves to about $1,760 - $1,800.
This might be the moment to switch from short positions in the miners to short position in silver. It’s too early to say for sure at this time, though.
Moreover, please note that from the long-term point of view, silver is not that strong.
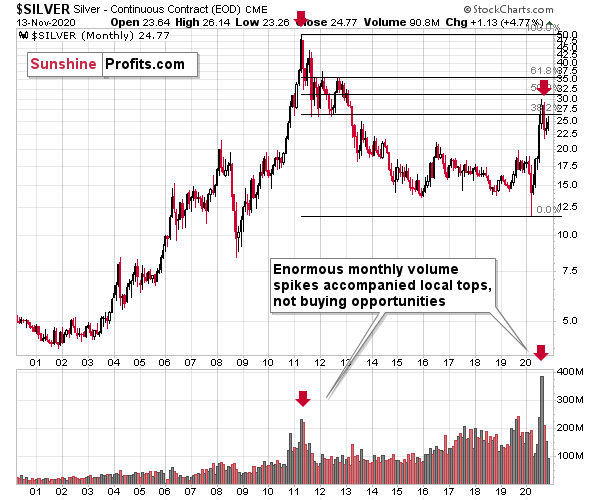
While gold moved to new highs, silver – despite its powerful short-term upswing – didn’t manage to correct more than half of its 2011 – 2020 decline.
In fact, silver has already invalidated its move above the lowest of the classic Fibonacci retracement levels (38.2%), which is not something that characterizes extraordinarily strong markets.
Silver is likely to move well above its 2011 highs, but it’s unlikely to do it without another sizable downswing first.
If you look at the monthly silver volume levels, it seems likely that the next sizable downswing has already begun. The previous substantial monthly volume in silver accompanied the 2011 top. The analogy doesn’t get more bearish than this. Ok, it would, if there were multiple key tops confirmed by huge monthly volume. But the 2011 top was so significant that other tops are not comparable, except for the most recent one. Thus, the implications are bearish.
We are witnessing something similar in the HUI Index as well. The latter corrected half of its 2011 – 2016 decline and nothing more, while gold moved well above its 2011 high.
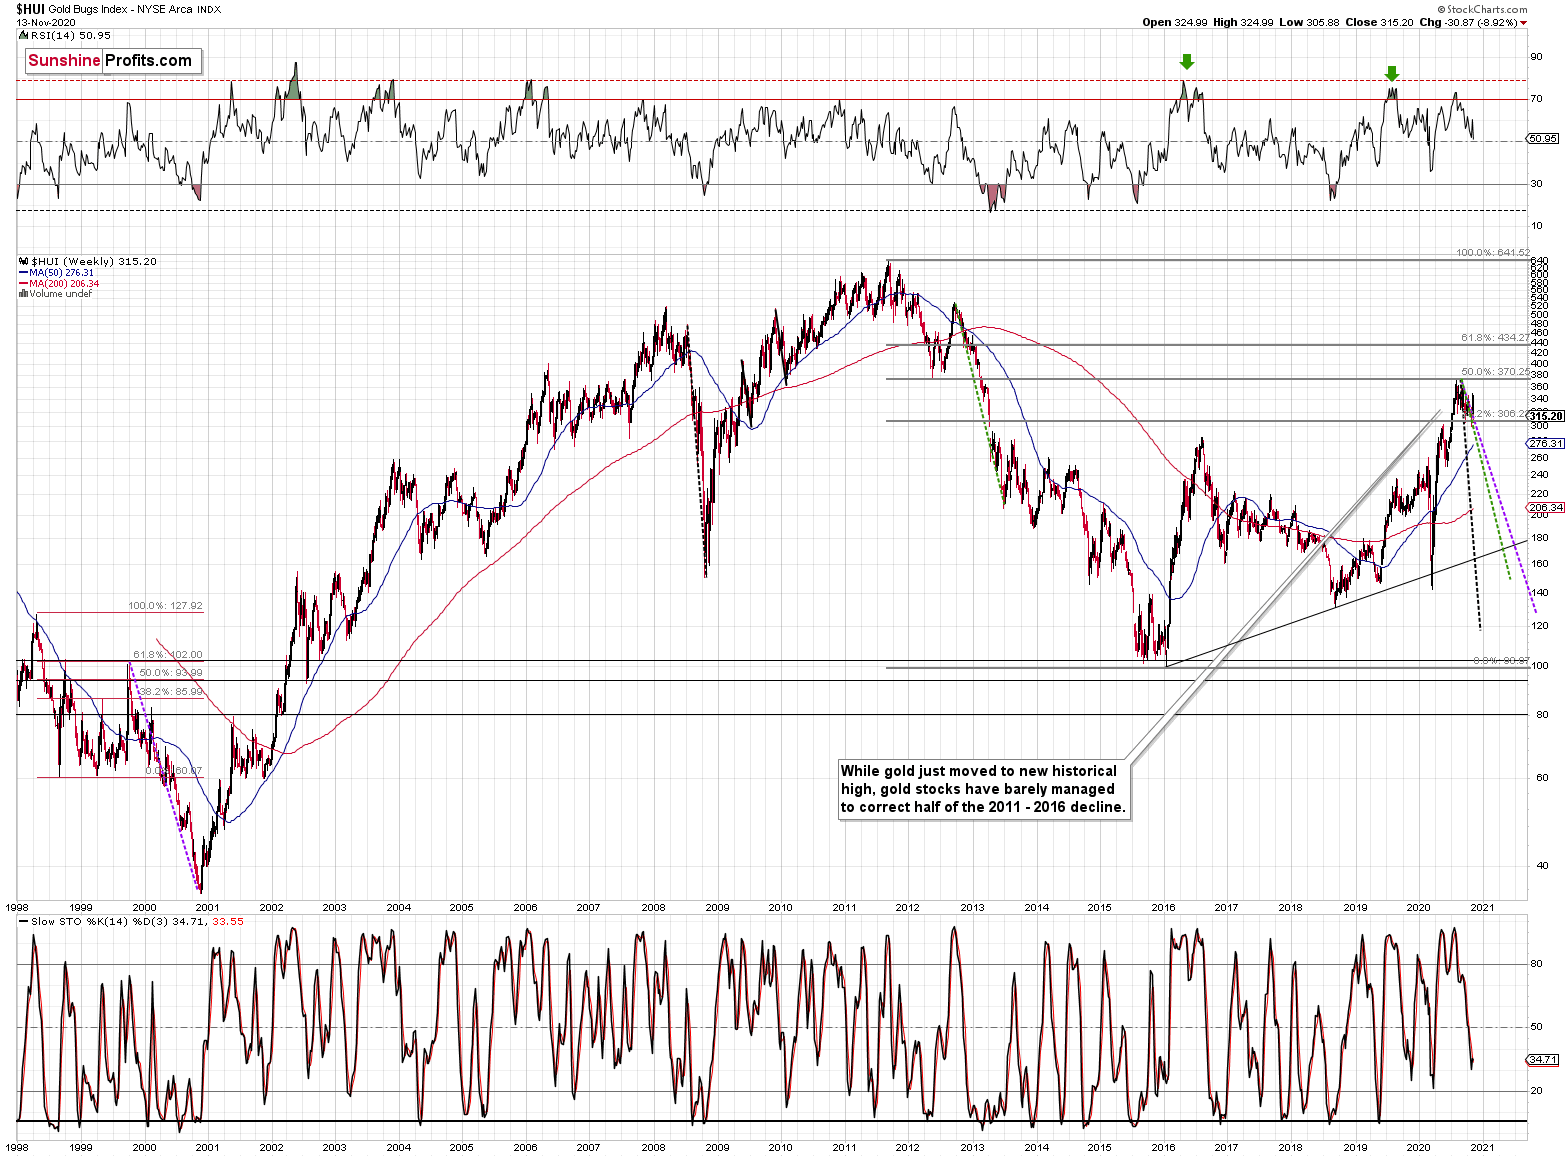
All in all, it’s mostly gold that is making the major gains – not the entire precious metals sector.
So, how can one determine the end of the gold price decline? At $1,700, it seems that it can go either up or down. Where does gold need to go to complete the pattern?
In reality, gold could rebound from $1,700, but it could just as well slide further, perhaps once again to the previous 2020 lows, especially if the USDX rallies to its 2020 highs.
So, how do we determine whether we see the buying opportunity or not?
We will view the price target levels as guidelines, and the same goes for the Gold Miners Bullish Percent Index (below 10), but the final confirmation will likely be something else. Something that we already saw in March when gold bottomed.
We will be on a special lookout for gold’s strength against the ongoing USDX rally. At many vital bottoms in gold, that’s exactly what happened, including what the March bottom.
So far, the link between gold and the USD Index is strongly negative.
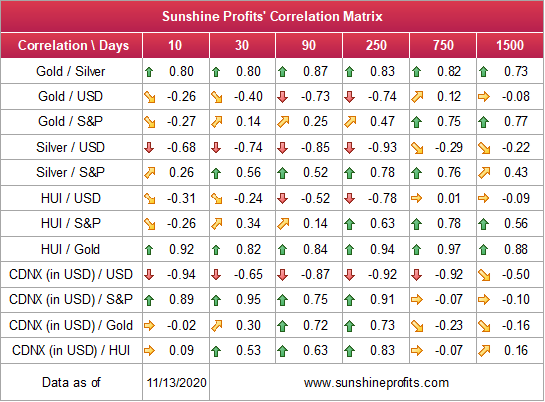
Since gold, silver, and mining stocks have been strongly negatively correlated with the USD Index in the medium term (90-day column), it seems likely that they will be negatively affected by the upcoming sizable USDX upswing.
…Until we see the day where gold reverses or soars despite the U.S. currency’s rally.
If that happens with gold at about $1,700, we’ll have a very good chance that this was the final bottom. If it doesn’t happen at that time, or gold continues to slide despite USD’s pause or decline, we’ll know that gold has further to fall.
Naturally we’ll keep you – our subscribers – informed.
To move forward, how does the GDX downside target compare to the gold’s downside target? If, at the same time, gold moves to about $1,800 and miners are already after a ridiculously big drop (to $31-$32 in the GDX ETF, or lower), the binding profit-take exit price of your GDX ETF will become $32.02.
However, since gold is only at $1,800, with a GDX of $32, there’s more decline to be expected. Perhaps that exiting GDX is only for changing to shorts in silver? Is that the only instance when that’s the case, or could it also be with a GDX of $32 and a gold price of $1,700. What would be a GDX target for gold a gold price of $1700 be?
It’s also not entirely clear whether you have up to six weeks until the lows arrive, instead of the end of the year.
Yes, we plan to exit the short positions in the mining stocks (GDX) and enter short position in silver. We don’t have an exact price at which we’ll do it (and it’s unclear if we’ll do it at all). We’re just describing what we’re going to do if a certain set of circumstances is met. If miners decline very profoundly, but silver declines only “normally”, then it would create a specific opportunity for one to switch from miners (that would be after most of their decline) to silver (that would be not be after most of its decline). Our estimation is that it might happen with GDX at about $31 - $32, and/or with gold at about $1,800. However, it would be the specific relative performance of miners to silver that would determine if we would make the switch or not.
We expect the above – a local bottom with miners at about $31 - $32 – to form within the next 5 weeks. However, this will likely not be the final bottom, especially if gold doesn’t slide to $1,700 at that time. We expect to see bigger declines to follow then, after a pause or a rebound. This means that miners could rally a bit from $31 - $32, and then decline below this area afterward.
At this time, the final GDX target (the one that would correspond to gold at $1,700 or lower) is still unclear. The $17 - $23 area seems probable, especially if the general stock market slides once again. It’s too early to say with any significant level of certainty. Gold is providing us with a clearer final target, so that’s what we’ll focus on. And most importantly – we’ll focus on gold’s performance relative to the USD Index.
Overview of the Upcoming Decline
As far as the current overview of the upcoming decline is concerned, I think it has already begun.
During the final part of the slide (which could end later than in 6 weeks, perhaps near the end of the year – just like it happened in 2015), we expect silver to decline more than miners. That would align with how the markets initially reacted to the Covid-19 threat.
The impact of all the new rounds of money printing in the U.S. and Europe on the precious metals prices is incredibly positive in the long run, which does not make the short-term decline improbable. Markets can and will get ahead of themselves and decline afterward – sometimes very profoundly – before continuing with their upward climb.
The plan is to exit the current short positions in miners after they decline far and fast, but at the same time, silver drops just “significantly” (we expect this to happen in 0 – 5 weeks). In other words, the decline in silver should be severe, but the decline in the miners should look “ridiculous”. That’s what we did in March when we bought practically right at the bottom. It is a soft, but at the same time, a broad instruction, so additional confirmations are necessary.
I expect this confirmation to come from gold, reaching about $1,800. If – at the same time – gold moves to about $1,800 and miners are already after a ridiculously big drop (say, to $31 - $32 in the GDX ETF – or lower), we will probably exit the short positions in the miners and at the same time enter short positions in silver. It will be tempting to wait with opening the short position in silver until the entire sector rebounds, but such a rebound could last only a couple of hours, so it would be challenging to successfully execute such a strategy.
The precious metals market's final bottom is likely to take shape when gold shows significant strength relative to the USD Index. It could take the form of a gold’s rally or a bullish reversal, despite the ongoing USD Index rally.
Summary
Summing up, the next big move in the precious metals market is likely to be to the downside and – given the decrease in political uncertainty as well as last Monday’s slide in gold, silver, and mining stocks – it seems that this move lower has already begun.
Considering gold's breakout invalidation above the 2011 highs, it's evident that the big rally (that ended $4 above our upside target) is entirely over. Given this invalidation and the confirmed USD Index breakout, gold will probably slide much lower over the next few weeks. There are indications that the corrective upswing in the precious metals market and the pullback in the USDX are close to being over, so the decline could resume any day – or hour – now.
Naturally, everyone's trading is their responsibility. But in our opinion, if there ever was a time to either enter a short position in the miners or increase its size if it was not already sizable, it's now. We made money on the March decline, and on the March rebound, with another massive slide already underway.
After the sell-off (that takes gold to about $1,700 or lower), we expect the precious metals to rally significantly. The final decline might take as little as 1-6 weeks, so it's important to stay alert to any changes.
Most importantly, please stay healthy and safe. We made a lot of money on the March decline and the subsequent rebound (its initial part) price moves (and we'll likely earn much more in the following weeks and months), but you have to be healthy to enjoy the results.
As always, we'll keep you - our subscribers - informed.
To summarize:
Short-term outlook for the precious metals sector (our opinion on the next 1-6 weeks): Bearish
Medium-term outlook for the precious metals sector (our opinion for the period between 1.5 and 6 months): Bearish initially, then possibly Bullish
Long-term outlook for the precious metals sector (our opinion for the period between 6 and 24 months from now): Bullish
Very long-term outlook for the precious metals sector (our opinion for the period starting 2 years from now): Bullish
Our preferred ways to invest in and to trade gold along with the reasoning can be found in the how to buy gold section. Furthermore, our preferred ETFs and ETNs can be found in our Gold & Silver ETF Ranking.
As a reminder, Gold & Silver Trading Alerts are posted before or on each trading day (we usually post them before the opening bell, but we don't promise doing that each day). If there's anything urgent, we will send you an additional small alert before posting the main one.
Thank you.
Sincerely,
Przemyslaw Radomski, CFA
Editor-in-chief, Gold & Silver Fund Manager

