

Briefly: in our opinion, full (300% of the regular position size) speculative short positions in junior mining stocks are justified from the risk/reward point of view at the moment of publishing this Alert.
Some might consider an additional (short) position in the FCX.
Welcome to this week's flagship Gold Trading Alert.
Predicated on last week’s price moves, our most recently featured medium-term outlook remains the same as the price moves align with our expectations. On that account, there are parts of the previous analysis that didn’t change at all in the earlier days and are written in italics.
The key indication for the precious metals market that we saw this week doesn’t come from the weekly price changes but from the monthly ones. Today is the last day of the month, and it looks like we’re going to see a massive monthly reversal in gold. This is as bearish as it gets.
Quite many things happened on the fundamental front as well, so I’ll take this opportunity to update you on those changes first, and I’ll move to the technicals next.
The Weekly Fundamental Roundup
With volatility the name of the game this week, financial assets whipsawed as recession fears collided with resilient earnings. Along the way, the USD Index and U.S. Treasury yields bounced around, which helped push the PMs lower and then helped them recover.
But, with seasonal forces turning bullish for assets that often move inversely to gold, silver and mining stocks, the trio should face a challenging environment over the next few months. Furthermore, despite the S&P 500’s short-covering rally on Apr. 27, gold and silver were relatively muted, which highlights how their momentum is slowly starting to dissipate.
Could the Debt Ceiling Drama Uplift Gold?
While the 2011 analog paints an optimistic portrait for gold, silver and mining stocks, a re-enactment of the last debacle is unlikely to unfold this time around. Back then, gold soared amid the debt ceiling chaos, while the USD Index was a major casualty. And while it’s possible lawmakers could ignite a similar event, most learn from their past mistakes.
For example, while bloated stock valuations were the Black Swan in 2000, the 2008 global financial crisis (GFC) was a housing market phenomenon, while the 2020 pandemic was a health scare. As a result, different catalysts often cause distress, and when this recession arrives, it will likely be driven by something investors least expect.
So, with the debt ceiling drama highly anticipated, it reduces the odds of the event unfolding in line with investors’ expectations. Therefore, it’s likely more semblance than substance, and the bulk of the PMs’ rallies should be in the rearview.
Here Comes the USD Index
As evidence, the USD Index has suffered recently, and there are concerns that the ECB could out-hawk the Fed. Well, the reality is that the EUR/USD has largely benefited from a resilient U.S. stock market and low volatility.
Please see below:
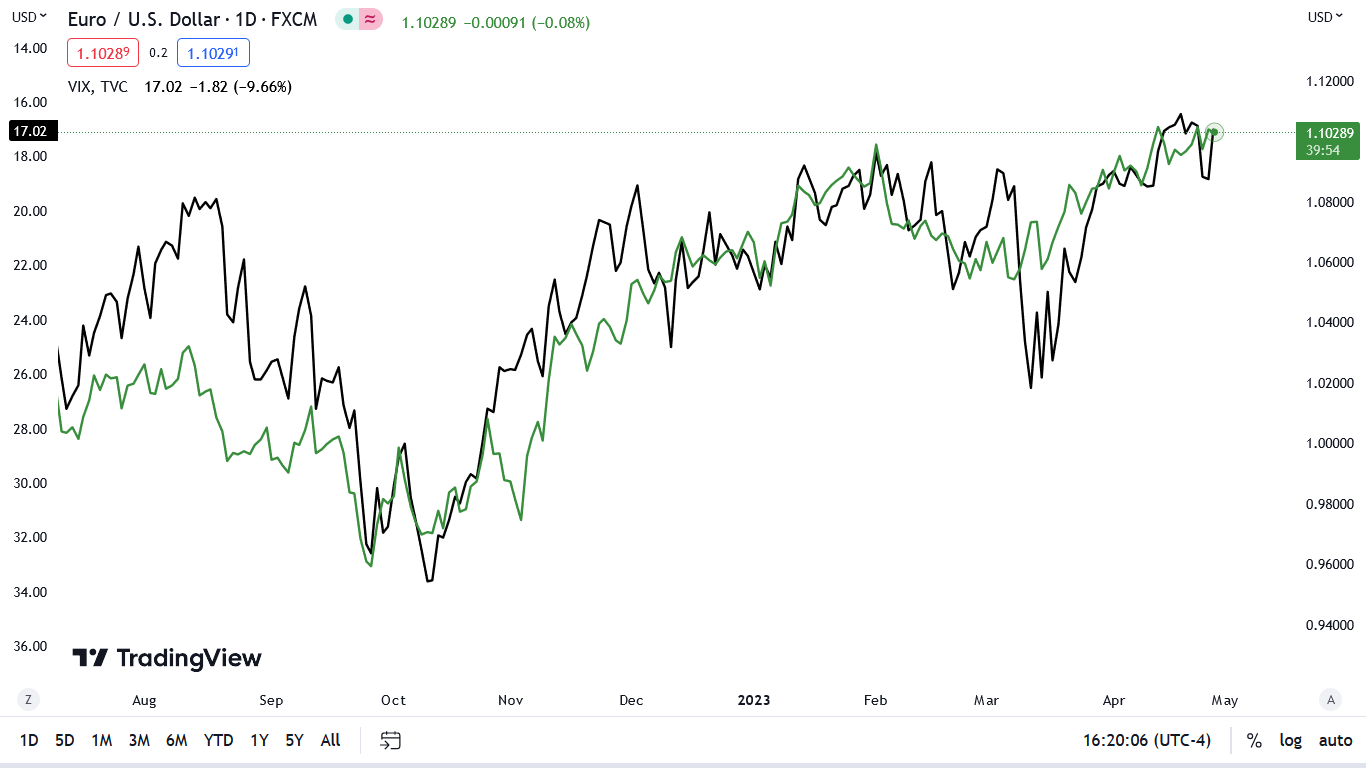
To explain, the green line above tracks the daily movement of the EUR/USD, while the black line above tracks the inverted (down means up) daily movement of the Cboe Volatility Index (VIX).
If you analyze the relationship, you can see that the currency pair has moved opposite the VIX for nearly a year. Moreover, when the VIX falls and risk-on sentiment reigns, currencies like the euro rally at the expense of the U.S. dollar. However, the environment should flip as we move forward. We wrote on Apr. 21:
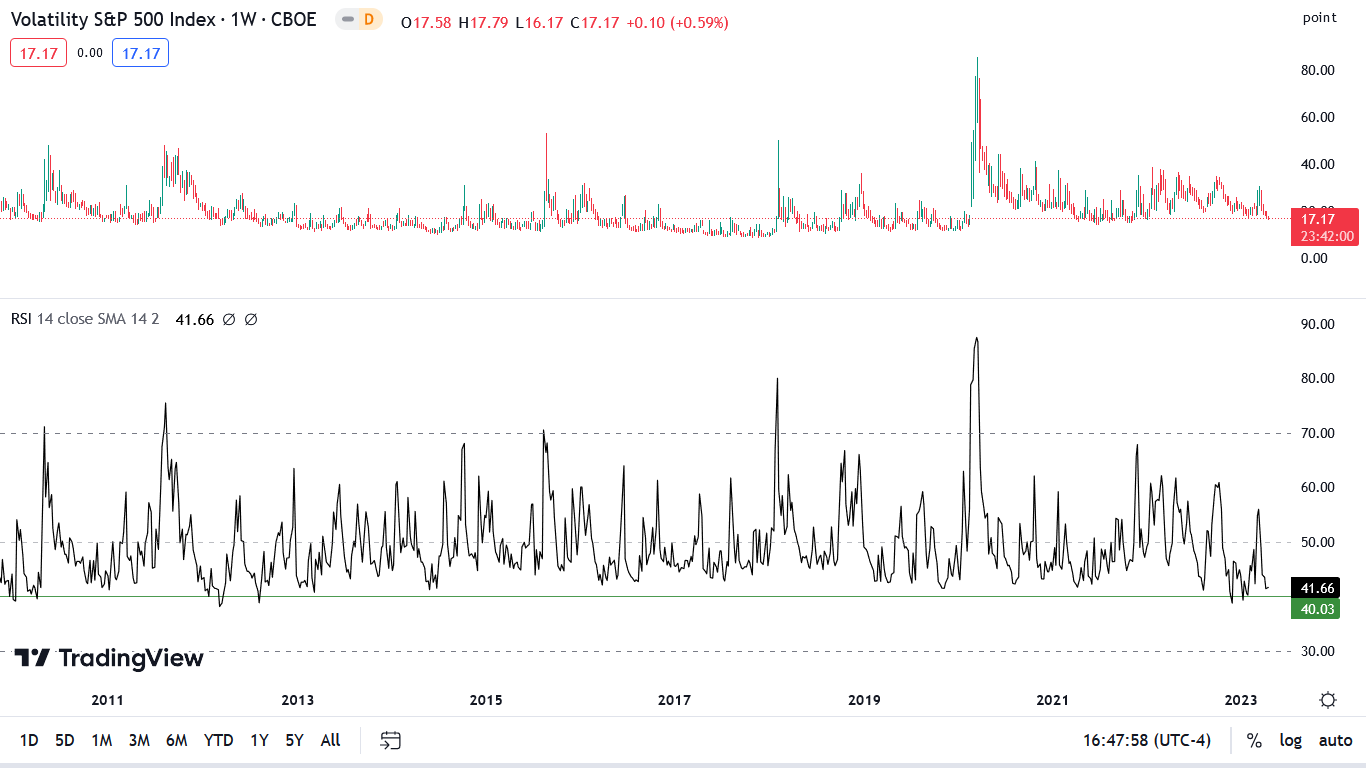
To explain, the candlesticks above track the weekly movement of the VIX, while the black line at the bottom tracks its weekly RSI. If you analyze the horizontal green line, you can see that weekly VIX RSI readings below 40 are rare over the last 10+ years.
We added:
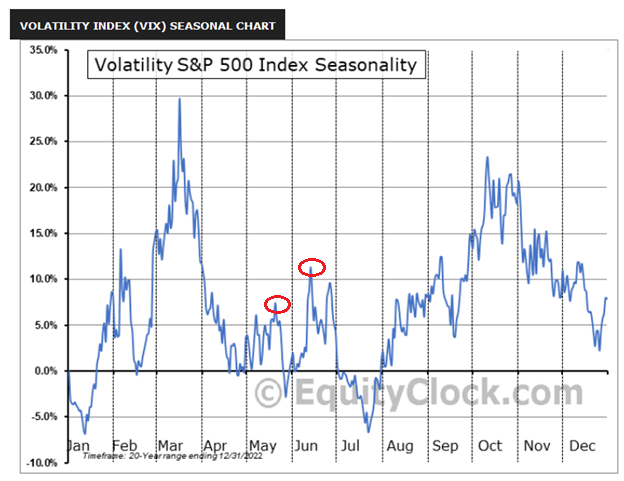
To explain, the blue line above shows how the VIX often bottoms near the end of April, then rises in May, falls again, then hits a new high in June. So, with the VIX’s clock turning bullish after next week, coupled with the rare weekly RSI reading, the data supports more uncertainty.
Thus, while the VIX declined dramatically on Apr. 27, the seasonal weakness is normal. Likewise, its weekly RSI did not make a new, and the shallow reading near 40 highlights how complacency should haunt the bulls in May and June.
To that point, the USD Index showcases seasonal strength in May and July.
Please see below:
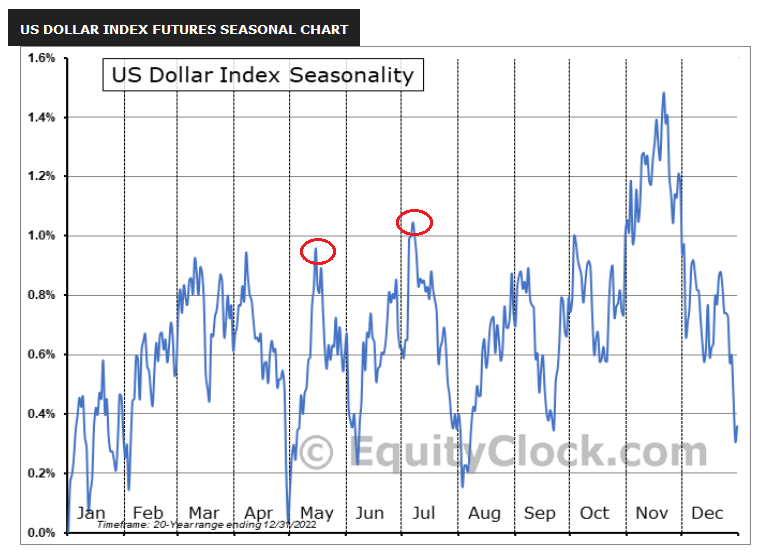
To explain, the blue line above shows how it’s perfectly normal for the USD Index to bottom at the end of April. Then, a sharp rally often follows in early May, followed by a pullback, then another breakout to new highs. Therefore, while the crowd assumes April’s winners will maintain their outperformance, if the VIX and the USD Index jump, the PMs’ trends should turn bearish.
Finally, while investors assume that rate cuts are on the horizon, the data suggests otherwise. Despite inflation fatigue causing investors to ignore the ramifications, the pricing pressures remain problematic and the year-over-year (YoY) base effects end in June. As a result, the month-over-month (MoM) readings will matter more, and the implications are far from priced in.
Please see below:
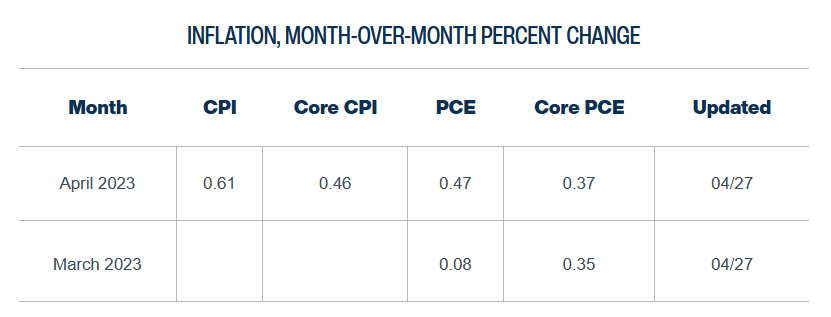
To explain, the Cleveland Fed expects the headline CPI to increase by 0.61% MoM in April, which, if realized, would be the highest MoM reading since June 2022. And while the Cleveland Fed has been off on its headline CPI predictions, its core CPI estimates have been accurate. As such, 0.46% MoM annualizes to 5.66% YoY, and a continuation of the theme will look even worse after June.
Overall, we believe the Fed’s tightening cycle has more room to run, and a realization is bullish for the USD Index and real interest rates. In addition, we’re days away from the calendar turning bullish for the greenback, and with risk assets rallying in April, investors loosened financial conditions, which uplifts inflation. Thus, don’t be surprised if the narrative shifts dramatically in the months ahead.
Will April’s winners suffer in May and June, or will their bullish trends continue?
Silver Doesn’t Care, but You Should
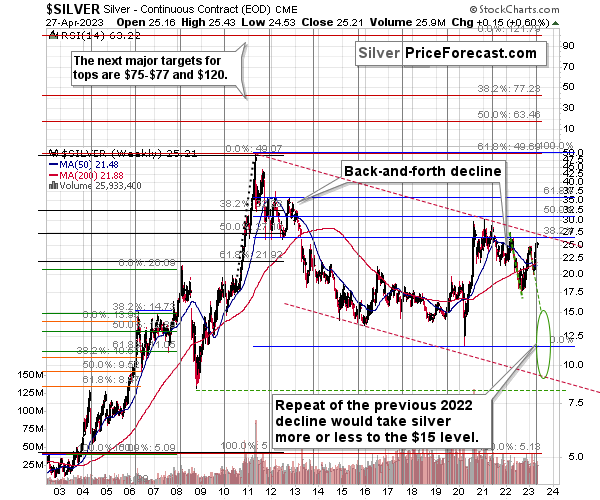
While calling the top is a process that plays out over time, silver’s momentum has fizzled, and the next major move should be to the downside. To explain, we wrote on Apr. 21:
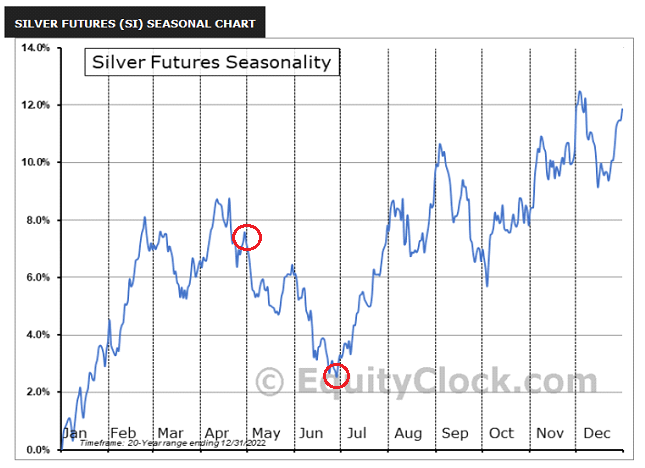
The blue line above shows how silver often peaks in mid-to-late April, with substantial weakness following until the end of June. In a nutshell: May and June are when the white metal has suffered its worst historical performance.
Also, the first red circle shows how after a small rally near the end of April, it’s largely downhill until July. Consequently, when you combine the seasonality implications with silver’s ominous technical and fundamental outlooks, the bears should feast over the medium term.
On top of that, silver is an attractive pairs trading short.
Please see below:
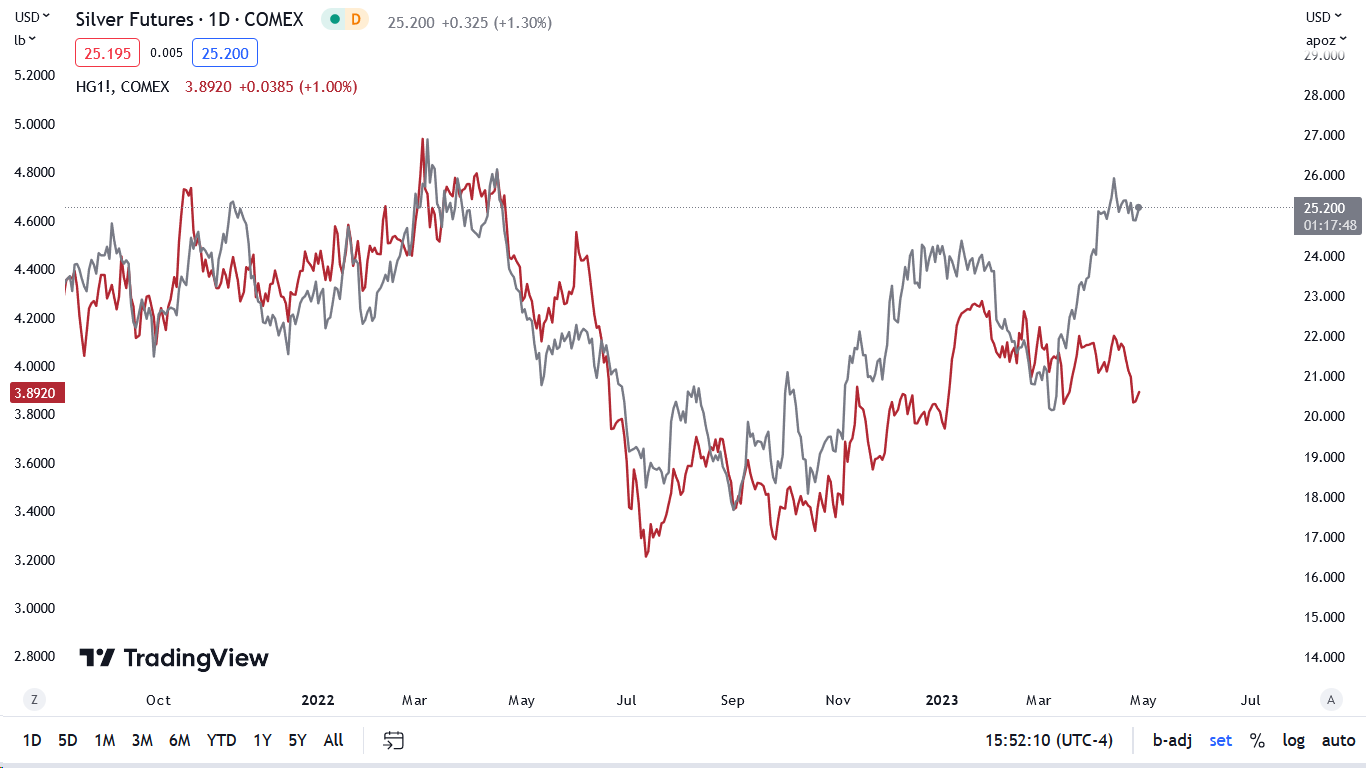
To explain, the red line above tracks the daily copper futures price, while the gray line above tracks the daily silver futures price. If you analyze the relationship, you can see that the pair have largely moved in lockstep since late 2021. And with copper trading near its March lows, silver’s outperformance is likely living on borrowed time.
To further emphasize the point, please see the pair’s relationship on the monthly chart:
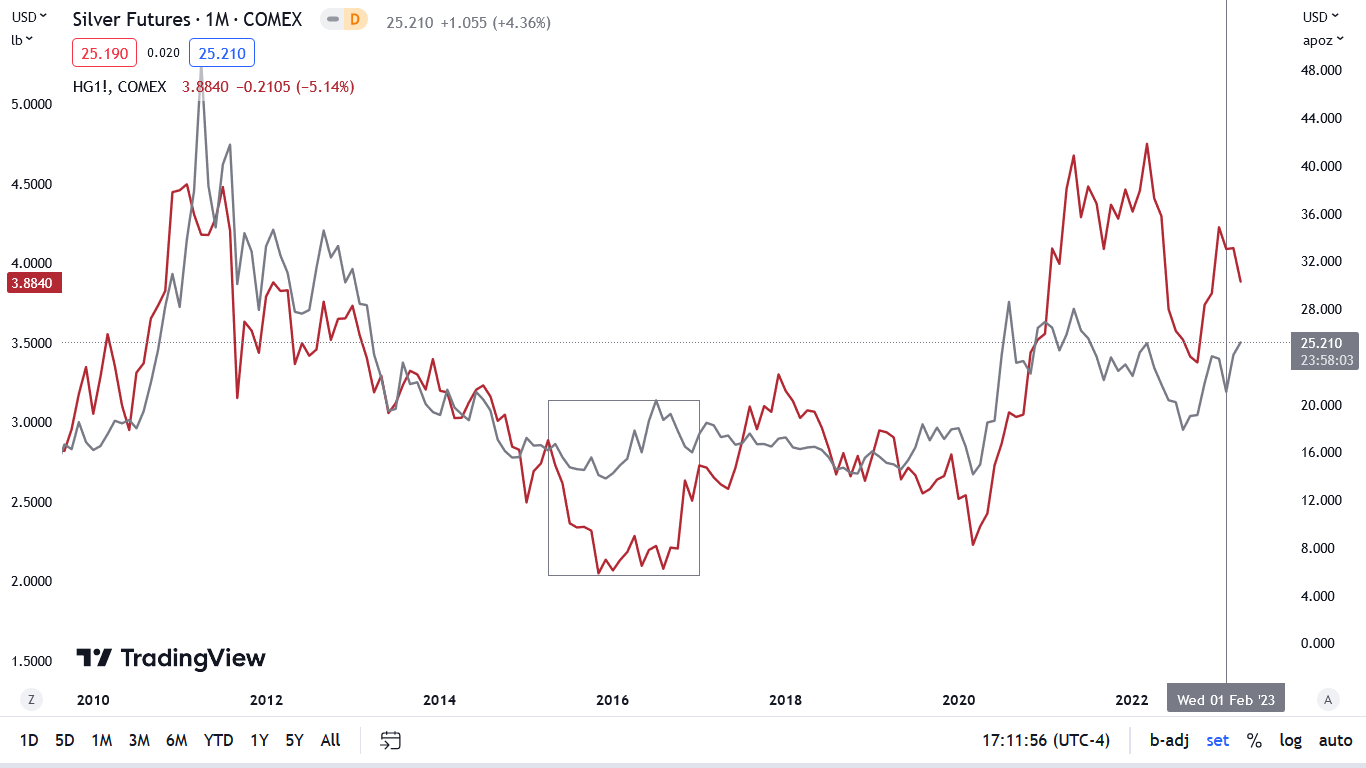
To explain, the box in the middle shows how when silver decoupled from copper in 2015-2016, the white metal rallied from ~$16.70 to ~$20.35. Yet, five months later, it declined to ~$16 and gave it all back. As such, if you analyze the vertical gray line on the right side of the chart, you can see that the white metal’s strength contrasts copper’s weakness. And with a meaningful rally already in place, silver’s current price looks more like the 2016 peak than the beginning of a new bull market.
So, with silver’s tail risk heavily skewed to the downside, we believe that betting on higher prices offers much more risk than reward.
Fade the Rate-Cut Narrative
In addition, while the crowd expects rate cuts in the months ahead, the data does not support their dovish disposition.
Please see below:
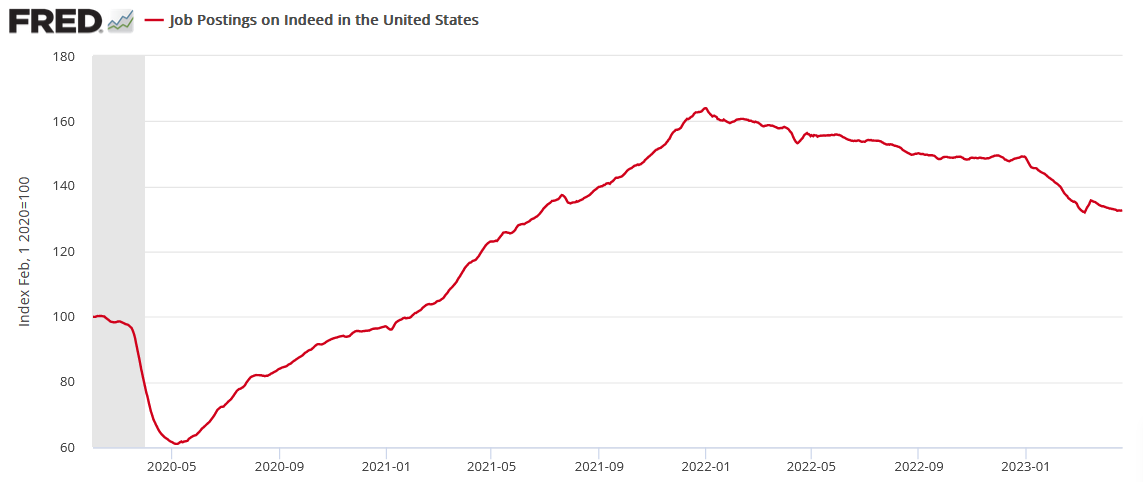
To explain, job postings on Indeed rose slightly last week (updated on Apr. 26), and the current figure remains above the Mar. 9 low. And while job openings had declined sharply in early 2023, the downward momentum has stopped, and the metric is ~33% above its pre-pandemic trend. Consequently, the Fed still has an inflation problem, and wage growth is unlikely to subside until job openings decline materially.
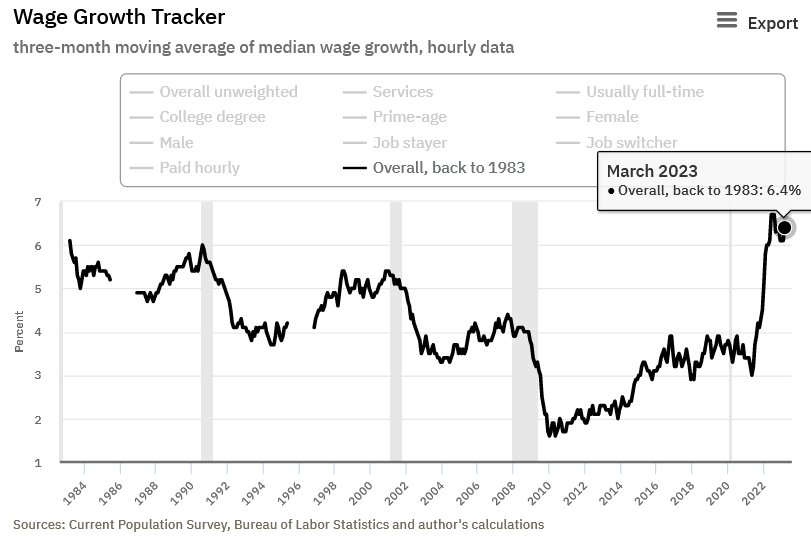
Speaking of which, the Atlanta Fed updated its Wage Growth Tracker on Apr. 13. And with the metric increasing from 6.1% in February to 6.4% in March, it's only 30 basis points away from its all-time high (dating back to 1983) set in June, July and August 2022.
Please see below:
Furthermore, with earnings season supporting the inflation thesis, companies continue to raise prices at the expense of volume. And with the gambit going on for more than two years, the trend should continue until interest rates are high enough to suppress demand.
Please see below:
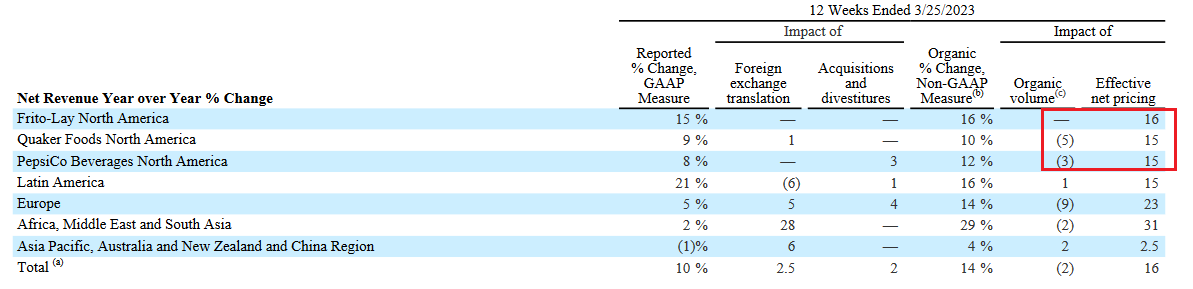
To explain, PepsiCo released its first-quarter earnings on Apr. 25. The beverage giant reported flat, and volume declines, in its North American segments, while prices rose by 15% and 16%, respectively.
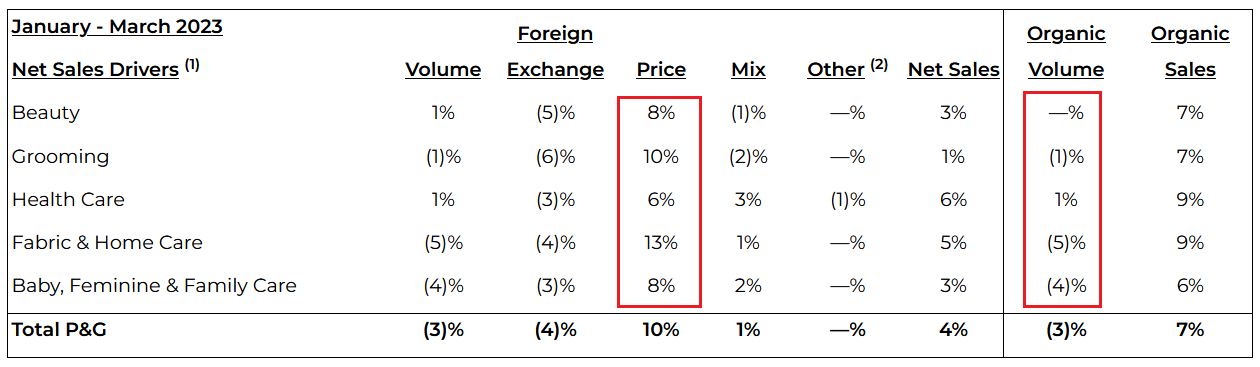
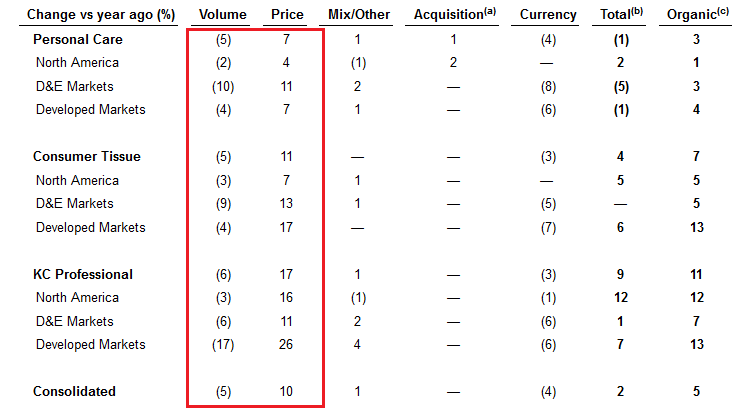
Showcasing similar results, Procter & Gamble (P&G) reported its third-quarter earnings on Apr. 21. And with volume down across three of its five segments, price increases of 6% to 13% drove its revenue growth.
Please see below:
Finally, Kimberly-Clark reported its first-quarter earnings on Apr. 25. And surprise, surprise, volumes declined across the board, while price increases of 4% to 16% in North America uplifted the top line.
Please see below:
Overall, silver confronts a treacherous medium-term backdrop, as the fundamentals, technicals and seasonality are bearish. What’s more, the crowd is pricing in rate cuts at a time when wage inflation is rising and corporate revenues are still buoyed by price increases. Consequently, the white metal should endure a substantial re-pricing in the months ahead.
Can the CPI fall to 2% if major corporations raise their prices by much more?
The Bottom Line
While equity investors assume that earnings outperformance signals the all-clear for the stock market, the results are counterintuitively bearish. Resilient prints driven by price increases highlight how demand and inflation support higher, not lower, interest rates. And with the crowd expecting the opposite, the fundamentals materially contrast the prevailing sentiment. As such, when reality sets in that inflation is a problem again, the PMs should come under immense pressure.
In conclusion, the PMs rallied on Apr. 27, as risk assets were bid across the board. But, with sentiment poised to shift in May and June, it shouldn’t be long before gold, silver and mining stocks confront resistance. Therefore, we expect material corrections sooner rather than later.
What to Watch for Next Week
With more U.S. economic data releases next week, the most important are as follows:
- May 1: S&P Global and ISM’s manufacturing PMIs
With the nationwide reports providing early windows into growth, employment and inflation, the leading indicators are useful in predicting future government data.
- May 2: JOLTS job openings
With Indeed’s weekly data stabilizing, JOLTS should follow suit. Furthermore, the longer job openings remain elevated, the longer the Fed will need to stay hawkish.
- May 3: S&P Global and ISM’s services PMIs, FOMC meeting, Jerome Powell press conference
Augmenting the results from their manufacturing PMIs, these prints will paint a similar portrait, but from the perspective of services companies. Likewise, the U.S. service sector accounts for roughly 70%+ of U.S. GDP.
In addition, while the FOMC should announce another 25 basis point rate hike, Powell’s presser will provide clues into the Fed’s expectations for the months ahead.
- May 4: Challenger Job Cuts
While job openings are the best leading indicator, it’s important to monitor layoffs to determine the overall health of the U.S. labor market.
- May 5: U.S. nonfarm payrolls, unemployment rate, average hourly earnings, labor force participation rate.
The foursome moves the markets each month, and resilient payrolls combined with sticky wage inflation are bad news for the rate cut/QE bulls.
All in all, economic data releases impact the PMs because they impact monetary policy. Moreover, if we continue to see higher employment and inflation, the Fed should keep its foot on the hawkish accelerator. If that occurs, the outcome is profoundly bearish for the PMs.
Technically Speaking
The technical part of today’s analysis will be a bit different than usual, as I’m not going to cover many of the charts that I’m usually covering in the flagship analyses, simply because the situation in them and the outlook based on them is just as it was a week ago (click to read last week’s flagship analysis). Consequently, it makes the most sense to put greater focus on where the changes can actually be seen. And that’s gold’s monthly chart.
Gold price did all sorts of things this month, but ultimately it ended almost right where it had started the month.
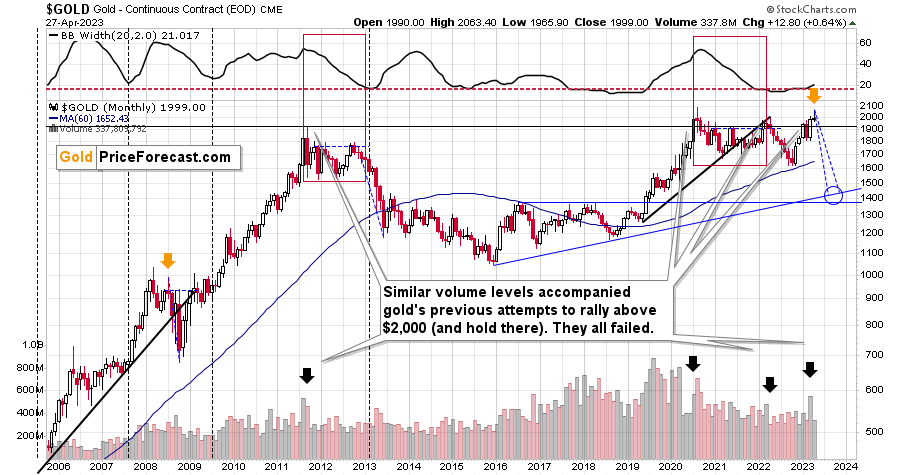
April had started with gold at $1,990, then gold moved as high as $2,063.40, and yesterday, it closed at $1,999. At the moment of writing these words, gold futures (because that’s what you see on the above chart) are trading at $1,993.
This means that gold formed a huge monthly reversal candlestick. Since the opening and closing (assuming that the current price will be the final price for the end of April) prices are almost identical, this candlestick is called a “gravestone doji”.
If gold moved a bit higher from here, it would create a “shotting star” candlestick based on its April price movement.
And if it moved a bit lower from here, it would… Also create a “shooting star” candlestick, just a different one.
What would the difference be?
None, because all those candlesticks are reversal patterns. In other words, the implications are almost certainly going to be bearish after today’s session, regardless of what fancy name we use to call this month’s price movement.
The only thing that could make this month’s candlestick bullish would be a rally of at least $30, which would have to happen today. And based on the analysis of gold’s pre-market decline, it’s highly unlikely that we’ll see something like that.
I wrote on numerous occasions about how important weekly gold price changes are, but monthly price changes take it to yet another level. A full month is enough time for any price noise to average-out and disappear. What ultimately happened?
This month in gold, ultimately, nothing happened except gold’s failure to break above $2,000.
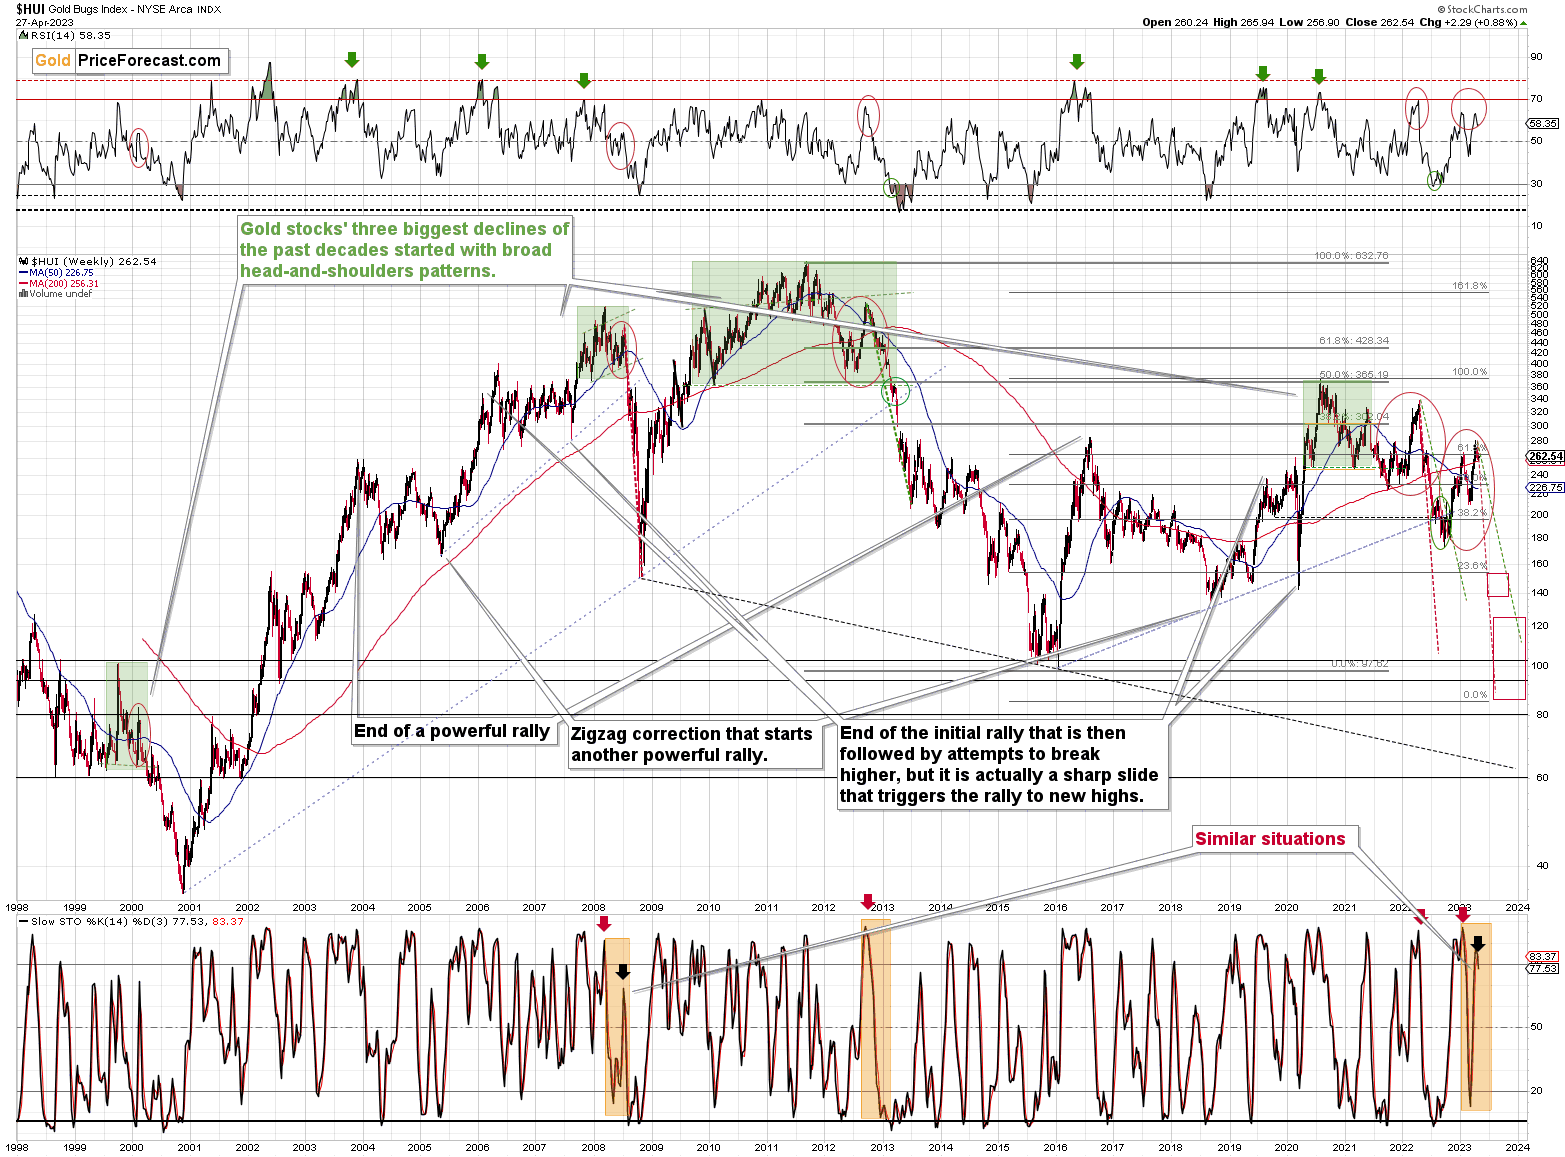
The monthly reversal is a very powerful, bearish indication that points to lower gold prices in the following months.
How can things get any more bearish based on the above chart alone?
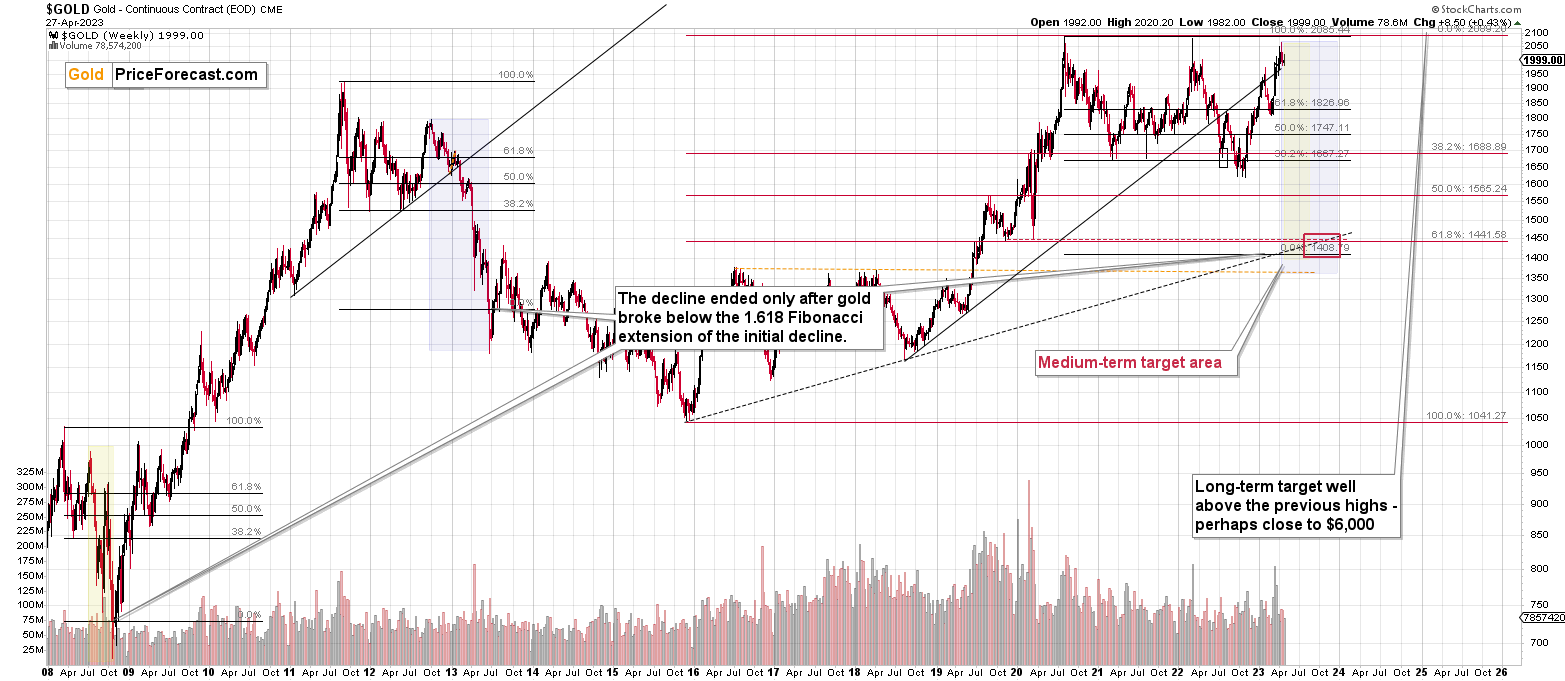
They actually can – please look at how gold started its sharpest decline of the past decades. That’s right, I mean the 2008 one.
Gold started it right after a monthly reversal! I marked the previous monthly reversal and the current one with orange arrows. The history tends to rhyme, so the implications here are very bearish.
There’s one additional thing about 2008 that I would like to emphasize here.
Namely, if you look at the size of the pre-slide corrective upswing we saw in 2008, you’ll notice that it’s practically identical to what we saw recently.
Sure, gold didn’t rally as sharply now as it did back then, but the overall size (percentage-wise) of the rallies is very similar. That’s what I marked with green rectangles.
So, yes, even though the recent rally seemed like a game-changer to many, it’s all within the self-similar pattern that ended with a massive decline.
Also, while we’re discussing really big matters today, let’s not forget the most important thing about the precious metals market that we have seen in recent years. Namely, while gold moved to its nominal (!) 2011 high, silver and gold mining stocks haven’t.
Silver is approximately only half as expensive as it was at its 2011 top.
Gold mining stocks are not even halfway as expensive as they were.
Again, that’s in nominal terms – in real terms they are all significantly cheaper.
Is this what a bull market in an entire sector looks like? No.
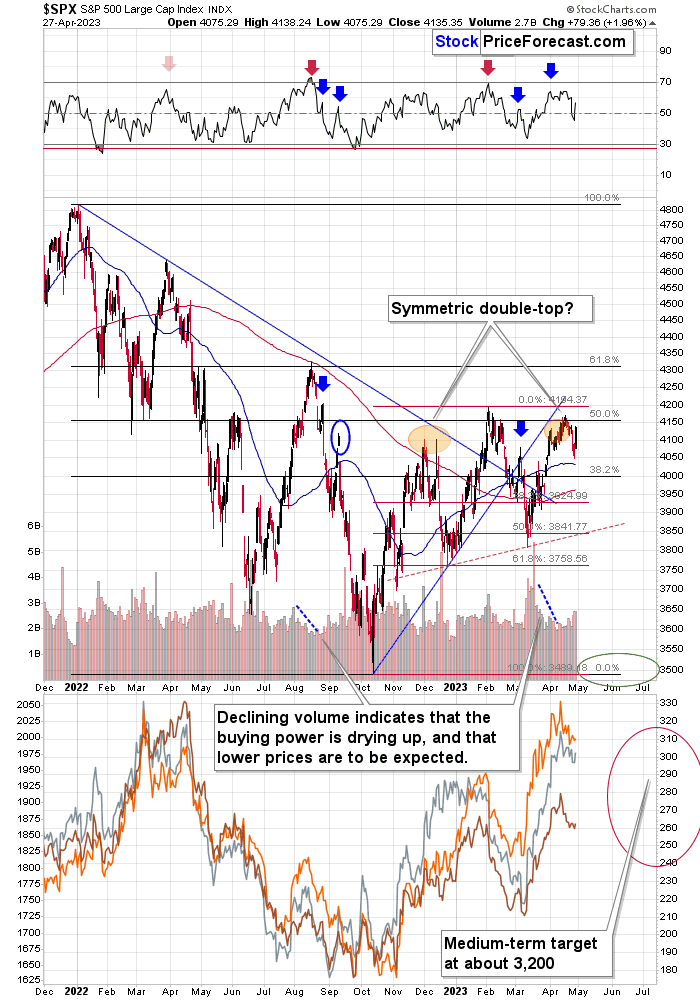
Another truly epic indication comes from the world stocks. I’ve emphasized it many times, but I just can’t emphasize it enough. This chart is practically screaming at us.
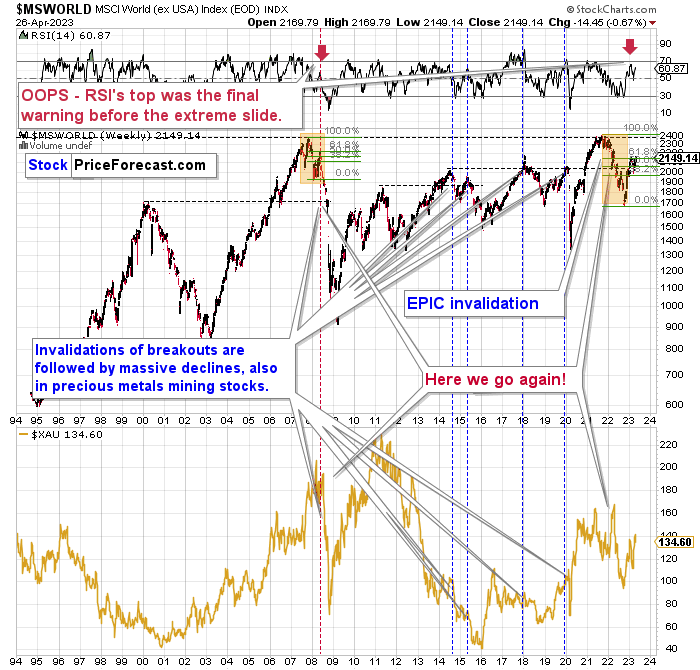
The situation right now is not “just” as it was in 2008. It’s actually worse, because the initial decline (please note the orange rectangles) that we saw right now was bigger!
The failed attempt to break above the previous high despite all the money that was pumped into the economies worldwide in the meantime is such a profound indication that a huge decline is coming that practically no other indication is necessary.
The lower part of the above chart shows the XAU Index – proxy for gold stocks and silver stocks. The most dramatic decline took place with falling world stocks. And it’s likely that we’re about to see something like that in the following months as well.
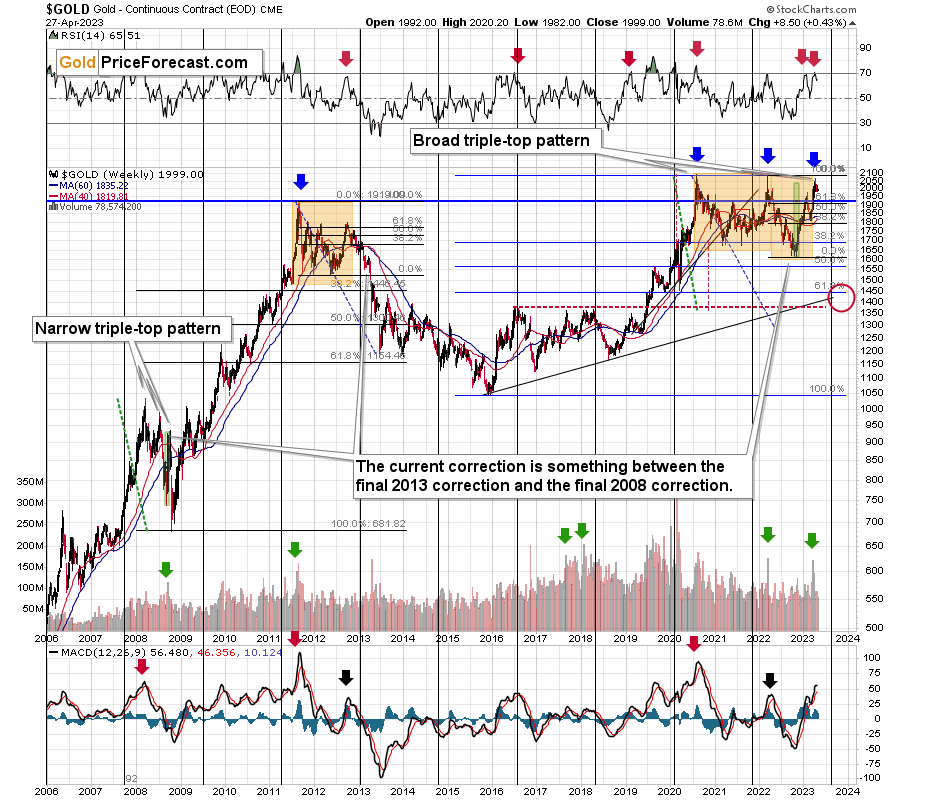
On a short-term basis, I’d like to emphasize that gold closed below $2,000 yesterday.
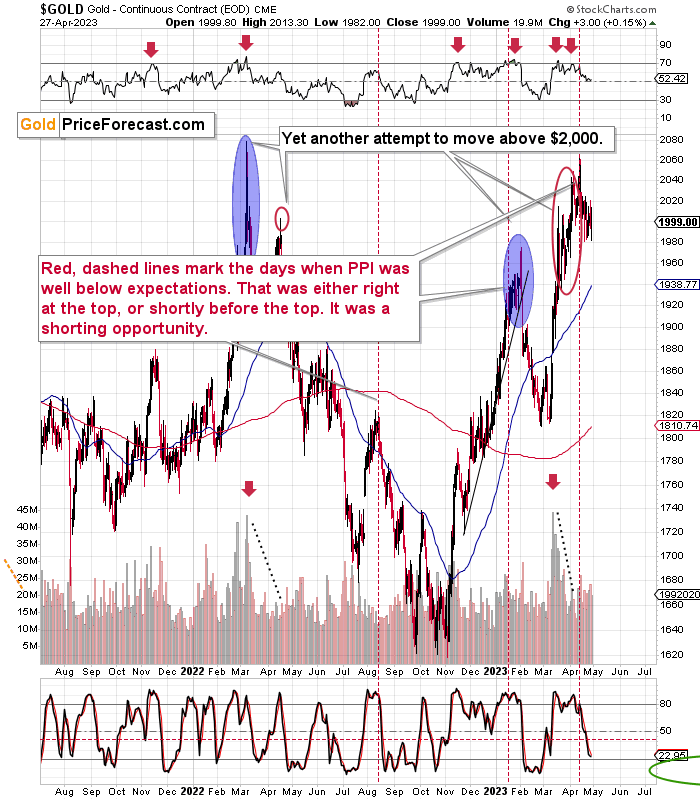
The move back below this level seems to have been verified by a few extra attempts to move higher. Gold wasn’t able to hold above $2,000 even while the USD Index was weak. This indicates that when the USDX is strong (and that’s likely just around the corner), gold will truly plunge.
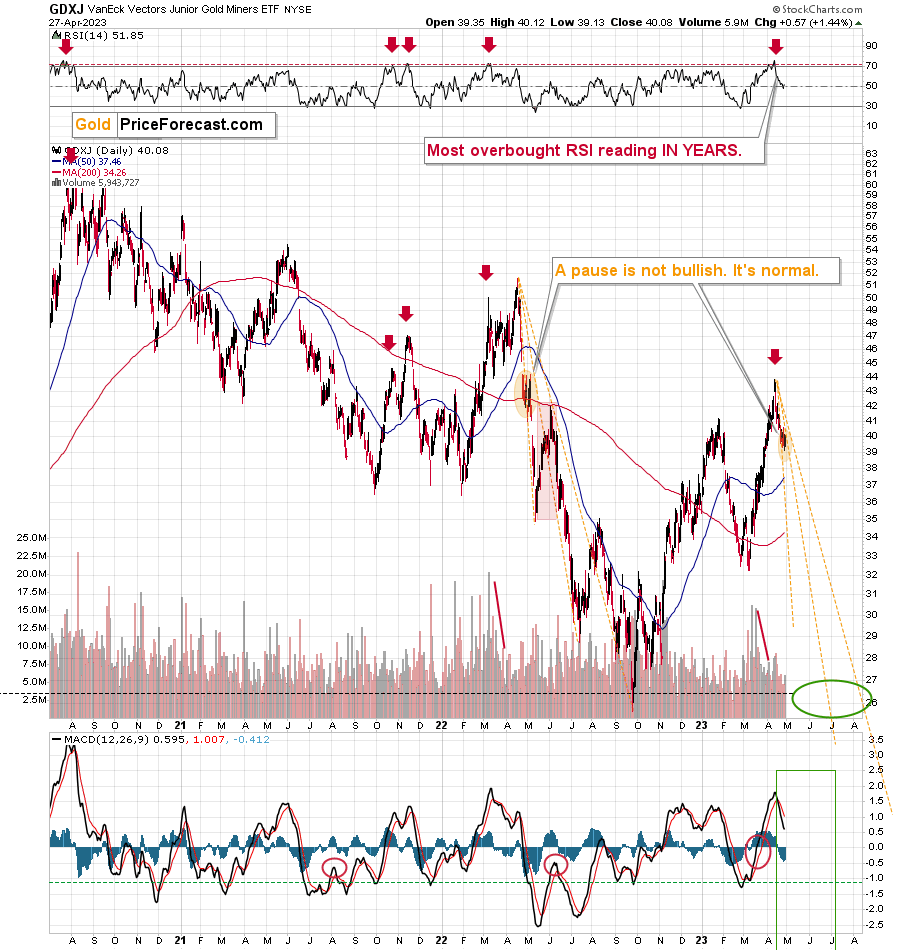
Meanwhile, junior miners paused, and even if they move a bit higher here, it wouldn’t change anything. Given the similarity to how the GDXJ declined last year, it seems that a pause here (or after an additional decline) would be quite natural.
The invalidation of the breakout above the previous yearly high is the key thing that happened recently, and it continues to point to much lower junior mining prices in the following weeks.
Besides, if you look at the similarly important sell signals from the MACD indicator (lower part of the chart), you’ll see that similar indications were usually followed by much lower prices, not just slightly lower prices. You can see that in mid-2021 and in late-April 2022.
Also, since we’re discussing short-term indications, please note that the FCX (primarily gold and copper producers) moved only slightly higher yesterday.
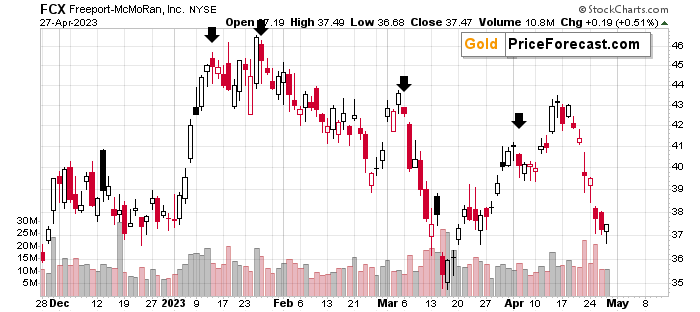
This is bearish because that’s a very weak reaction, given the sizable daily upswing in the S&P 500. The profits on our short position in the FCX are likely to increase substantially, even if it doesn’t happen today or early next week.
In fact, given what S&P 500 did yesterday, the small upswing in the GDXJ ETF is also bearish.
But is yesterday’s action bullish for stocks themselves? Not really, because what we see now is quite similar to what we had seen in late 2022 when the left shoulder of the likely head and shoulders formation was created. The shoulders tend to be somewhat similar, so the current back-and-forth movement is rather normal.
All in all, the outlook for the precious metals market remains very bearish.
===
On a side note, while commenting on analyses, please keep the Pillars of the Community in mind. It’s great to provide points that help others be more objective. However, it’s important to focus on the facts and discuss them in a dignified manner. There is not much of the latter in personal attacks. As more and more people join our community, it is important to keep it friendly. Being yourself, even to the point of swearing, is great, but the point is not to belittle other people or put them in a position of “shame” (whether it works or not). Everyone can make mistakes, and everyone does, in fact, make mistakes. We all here have the same goal: to have a greater understanding of the markets and pick better risk-to-reward situations for our trades. We are on the same side.
On another – and final – side note, the number of messages, comments etc. that I’m receiving is enormous, and while I’m grateful for such engagement and feedback, I’m also starting to realize that there’s no way in which I’m going to be able to provide replies to everyone that I would like to, while keeping any sort of work-life balance and sanity ;) Not to mention peace of mind and calmness required to approach the markets with maximum objectivity and to provide you with the service of the highest quality – and best of my abilities.
Consequently, please keep in mind that I will not be able to react / reply to all messages. It will be my priority to reply to messages/comments that adhere to the Pillars of the Community (I wrote them, by the way) and are based on kindness, compassion and on helping others grow themselves and their capital in the most objective manner possible (and to messages that are supportive in general). I noticed that whatever one puts their attention to – grows, and that’s what I think all communities need more of.
Sometimes, Golden Meadow’s support team forwards me a message from someone, who assumed that I might not be able to see a message on Golden Meadow, but that I would notice it in my e-mail account. However, since it’s the point here to create a supportive community, I will specifically not be providing any replies over email, and I will be providing them over here (to the extent time permits). Everyone’s best option is to communicate here, on Golden Meadow, ideally not in private messages (there are exceptions, of course!) but in specific spaces or below articles, because even if I’m not able to reply, the odds are that there will be someone else with insights on a given matter that might provide helpful details. And since we are all on the same side (aiming to grow ourselves and our capital), a to of value can be created through this kind of collaboration :).
Overview of the Upcoming Part of the Decline
- It seems that the recent – and probably final – corrective upswing in the precious metals sector is over.
- If we see a situation where miners slide in a meaningful and volatile way while silver doesn’t (it just declines moderately), I plan to – once again – switch from short positions in miners to short positions in silver. At this time, it’s too early to say at what price levels this could take place and if we get this kind of opportunity at all.
- I plan to switch from the short positions in junior mining stocks or silver (whichever I’ll have at that moment) to long positions in junior mining stocks when gold / mining stocks move to their 2020 lows (approximately). While I’m probably not going to write about it at this stage yet, this is when some investors might consider getting back in with their long-term investing capital (or perhaps 1/3 or 1/2 thereof).
- I plan to return to short positions in junior mining stocks after a rebound – and the rebound could take gold from about $1,450 to about $1,550, and it could take the GDXJ from about $20 to about $24. In other words, I’m currently planning to go long when GDXJ is close to $20 (which might take place when gold is close to $1,450), and I’m planning to exit this long position and re-enter the short position once we see a corrective rally to $24 in the GDXJ (which might take place when gold is close to $1,550).
- I plan to exit all remaining short positions once gold shows substantial strength relative to the USD Index while the latter is still rallying. This may be the case with gold prices close to $1,400 and GDXJ close to $15 . This moment (when gold performs very strongly against the rallying USD and miners are strong relative to gold after its substantial decline) is likely to be the best entry point for long-term investments, in my view. This can also happen with gold close to $1,400, but at the moment it’s too early to say with certainty.
- The above is based on the information available today, and it might change in the following days/weeks.
You will find my general overview of the outlook for gold on the chart below:
Please note that the above timing details are relatively broad and “for general overview only” – so that you know more or less what I think and how volatile I think the moves are likely to be – on an approximate basis. These time targets are not binding nor clear enough for me to think that they should be used for purchasing options, warrants, or similar instruments.
Letters to the Editor
Please post your questions in the comments feed below the articles, if they are about issues raised within the article (or in the recent issues). If they are about other, more universal matters, I encourage you to use the Ask the Community space (I’m also part of the community), so that more people can contribute to the reply and enjoy the answers. Of course, let’s keep the target-related discussions in the premium space (where you’re reading this).
Summary
To summarize, we recently took profits from the additional FCX trade (right before the trend reversed!), and the current short position in it is profitable as well.
The short position in junior mining stocks is – in my view – poised to become very profitable in the following weeks.
Things might appear chaotic in the precious metals market right now, but based on the analogy to the previous crises (2020 and 2008), it’s clear that gold, miners, and other markets are pretty much doing the same thing all over again.
The implications of this “all over” are extremely bearish for junior mining stocks. Back in 2008, at a similar juncture, GDX’s price was about to be cut in half in about a month! In my opinion, while the decline might not be as sharp this time, it’s likely to be enormous anyway and very, very, very profitable.
If I didn’t have a short position in junior mining stocks, I would be entering it now.
As always, we'll keep you – our subscribers – informed.
To summarize:
Trading capital (supplementary part of the portfolio; our opinion): Full speculative short positions (300% of the full position) in junior mining stocks are justified from the risk to reward point of view with the following binding exit profit-take price levels:
Mining stocks (price levels for the GDXJ ETF): binding profit-take exit price: $26.13; stop-loss: none.
Alternatively, if one seeks leverage, we’re providing the binding profit-take levels for the JDST (2x leveraged). The binding profit-take level for the JDST: $13.87; stop-loss for the JDST: none.
For-your-information targets (our opinion; we continue to think that mining stocks are the preferred way of taking advantage of the upcoming price move, but if for whatever reason one wants / has to use silver or gold for this trade, we are providing the details anyway.):
Silver futures downside profit-take exit price: $17.83 (stop-loss: none)
SLV profit-take exit price: $16.73 (stop-loss: none)
ZSL profit-take exit price: $32.97 (stop-loss: none)
Gold futures downside profit-take exit price: $1,743 (stop-loss: none)
HGD.TO – alternative (Canadian) 2x inverse leveraged gold stocks ETF – the upside profit-take exit price: $10.97 (stop-loss: none due to vague link in the short term with the U.S.-traded GDXJ)
HZD.TO – alternative (Canadian) 2x inverse leveraged silver ETF – the upside profit-take exit price: $25.47 (stop-loss: none)
///
Optional / additional trade idea that I think is justified from the risk to reward point of view:
Short position in the FCX with $27.13 as the short-term profit-take level.
Long-term capital (core part of the portfolio; our opinion): No positions (in other words: cash)
Insurance capital (core part of the portfolio; our opinion): Full position
Whether you’ve already subscribed or not, we encourage you to find out how to make the most of our alerts and read our replies to the most common alert-and-gold-trading-related-questions.
Please note that we describe the situation for the day that the alert is posted in the trading section. In other words, if we are writing about a speculative position, it means that it is up-to-date on the day it was posted. We are also featuring the initial target prices to decide whether keeping a position on a given day is in tune with your approach (some moves are too small for medium-term traders, and some might appear too big for day-traders).
Additionally, you might want to read why our stop-loss orders are usually relatively far from the current price.
Please note that a full position doesn't mean using all of the capital for a given trade. You will find details on our thoughts on gold portfolio structuring in the Key Insights section on our website.
As a reminder - "initial target price" means exactly that - an "initial" one. It's not a price level at which we suggest closing positions. If this becomes the case (as it did in the previous trade), we will refer to these levels as levels of exit orders (exactly as we've done previously). Stop-loss levels, however, are naturally not "initial", but something that, in our opinion, might be entered as an order.
Since it is impossible to synchronize target prices and stop-loss levels for all the ETFs and ETNs with the main markets that we provide these levels for (gold, silver and mining stocks - the GDX ETF), the stop-loss levels and target prices for other ETNs and ETF (among other: UGL, GLL, AGQ, ZSL, NUGT, DUST, JNUG, JDST) are provided as supplementary, and not as "final". This means that if a stop-loss or a target level is reached for any of the "additional instruments" (GLL for instance), but not for the "main instrument" (gold in this case), we will view positions in both gold and GLL as still open and the stop-loss for GLL would have to be moved lower. On the other hand, if gold moves to a stop-loss level but GLL doesn't, then we will view both positions (in gold and GLL) as closed. In other words, since it's not possible to be 100% certain that each related instrument moves to a given level when the underlying instrument does, we can't provide levels that would be binding. The levels that we do provide are our best estimate of the levels that will correspond to the levels in the underlying assets, but it will be the underlying assets that one will need to focus on regarding the signs pointing to closing a given position or keeping it open. We might adjust the levels in the "additional instruments" without adjusting the levels in the "main instruments", which will simply mean that we have improved our estimation of these levels, not that we changed our outlook on the markets. We are already working on a tool that would update these levels daily for the most popular ETFs, ETNs and individual mining stocks.
Our preferred ways to invest in and to trade gold along with the reasoning can be found in the how to buy gold section. Furthermore, our preferred ETFs and ETNs can be found in our Gold & Silver ETF Ranking.
As a reminder, Gold & Silver Trading Alerts are posted before or on each trading day (we usually post them before the opening bell, but we don't promise doing that each day). If there's anything urgent, we will send you an additional small alert before posting the main one.
Thank you.
Przemyslaw K. Radomski, CFA
Founder, Editor-in-chief

