

Briefly: gold and the rest of the precious metals market are likely to decline in the next several weeks/months and then start another powerful rally. Gold’s strong bullish reversal/rally despite the USD Index’s continuous strength will likely be the signal confirming that the bottom is in.
Welcome to this week's Gold Investment Update.
Predicated on last week’s price moves, our most recently featured medium-term outlook remains the same as the price moves align with our expectations (and we not only took profits from the previous short position, but we profited on the rebound and now expect further returns on the short side again). On that account, there are parts of the previous analysis that didn’t change at all in the earlier days and are written in italics.
Not much changed fundamentally this week, as the S&P 500’s rally has largely been driven by seasonality. But, with the calendar turning bearish from next week until early October, sentiment may struggle to keep risk assets afloat. Furthermore, with interest rates near their recent highs and the USD Index showcasing strength, the outlook remains aligned with our expectations.
We’ll begin today’s alert by dissecting the fundamentals and then dive into the technical aspects that have proven so prescient over the last several months.
Transitory 2.0 Is Coming for Gold
Throughout 2021, investors were soothed by the Fed’s nonchalant inflation attitude and assumed the central bank had the situation under control. And while we warned that the pricing pressures would eventually rattle risk assets, 2022 brought harsh realities and killed the “transitory” narrative. Yet, with a similar misjudgment keeping optimism uplifted, Transitory 2.0 should rattle gold before this cycle ends.
To explain, while the crowd screamed recession throughout 2021 and 2022 and priced in a Fed pivot, we warned those bets would go bust. In a nutshell: long-term interest rates were too low, wages were too high, and consumers still had plenty of cash in their bank accounts. Add it all up, and they did not support a recession.
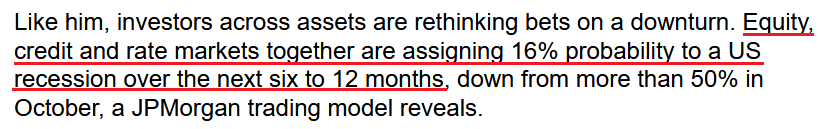
Although while many metrics have turned in a negative direction, JPMorgan revealed on Sep. 3 that the consensus has only priced in a 16% chance of a recession over the next six to 12 months.
Please see below:
Thus, with a recession poised to be Transitory 2.0 – meaning the overwhelming consensus is on the wrong side of reality – assets like gold and silver should confront severe selling pressure in the months ahead.
For context, this doesn’t mean a recession is imminent; it simply means the data has turned from green to yellow. And with red poised to follow, we’re much closer now than at any point over the last 24 months.
Please see below:
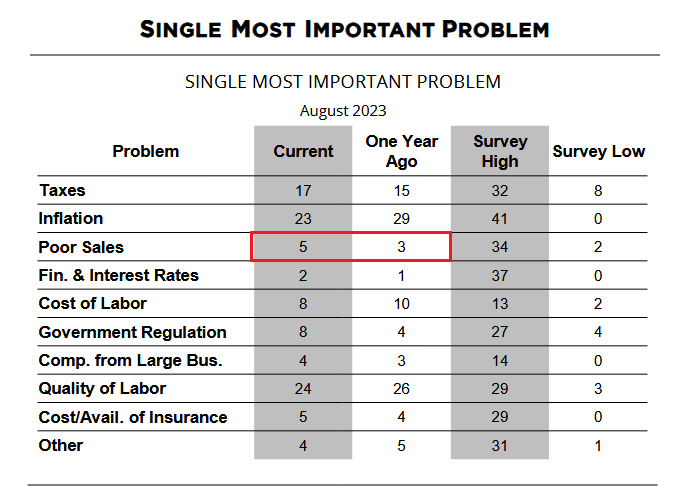
To explain, the NFIB released its Small Business Optimism Index on Sep. 12. Throughout 2021 and 2022, we highlighted how the percentage citing poor sales as their “Single Most Important Problem” was near an all-time low.
But, if you analyze the red rectangle, you can see that more small businesses are citing demand destruction as their top concern versus August 2022. Sure, the metric is still low relative to the survey high, but you don’t go from summer to winter overnight. In reality, the year-over-year (YoY) rise is an early warning sign of a deteriorating economic environment.
A Tough Job
The USD Index should soar if (when) the recession volatility erupts. And with the NFIB’s jobs report as another early indicator, the road to recession is already underway.
Please see below:
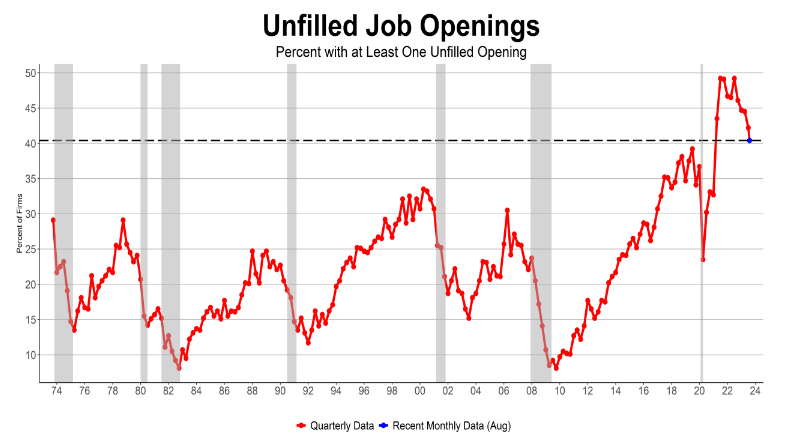
To explain, the red line above tracks the percentage of small businesses with at least one unfilled job opening. And with the metric hitting an all-time high in 2021/2022, it was another reason why we disregarded the recession talk and remained confident the Fed would stay hawkish for longer than expected.
However, those days are long gone. If you analyze the right side of the chart, you can see that the metric has declined materially. More importantly, please note how sharp declines in the red line have been precursors to recessions since the mid-1970s. Thus, the cycle continues to align with our expectations, and even the NFIB highlighted what the crowd fails to understand. The report stated:
“Since the Federal Reserve began tightening policy in March 2022, job openings have fallen 27 percent, according to the JOLTS data, while the unemployment rate has remained steadily low. Job openings will get cut significantly before actual layoffs rise.”
The last sentence is key. We warned that robust job openings were a leading indicator of realized employment, wage growth, and consumption. Now, it’s the opposite, and a continued decline in job openings should have drastic ramifications over the next three to nine months.
As further evidence, the LinkUp 10,000 tracks the total U.S. job openings from the top 10,000 global employers in the company’s system. And with the data also in a severe downtrend, it signals trouble for the U.S. unemployment rate and cyclical assets like oil over the medium term.
Please see below:
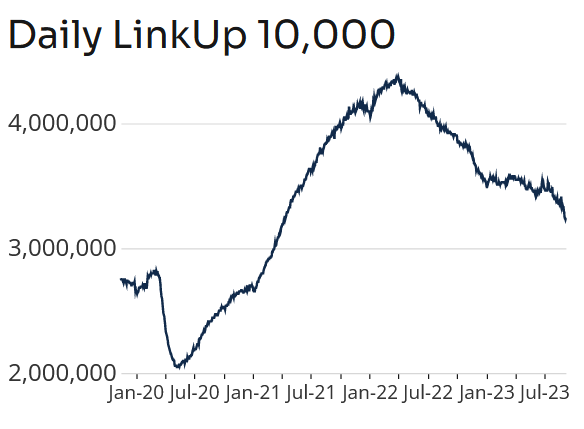
To explain, the sharp descent on the right side of the chart shows how job openings remain destined for their pre-pandemic baseline. And when this occurs, the market sentiment may look much different.
Finally, while job postings on Indeed have remained relatively resilient, the company noted on Sep. 12:
“Posted wages are slowing down in the vast majority of occupational sectors, reflecting a broad-based cooldown in the U.S. labor market. Only 22% of sectors had wage growth in August equal to or above their February 2023 level. The size of those declines varies by sector, but they have been considerable across wage tiers.”
Please see below:
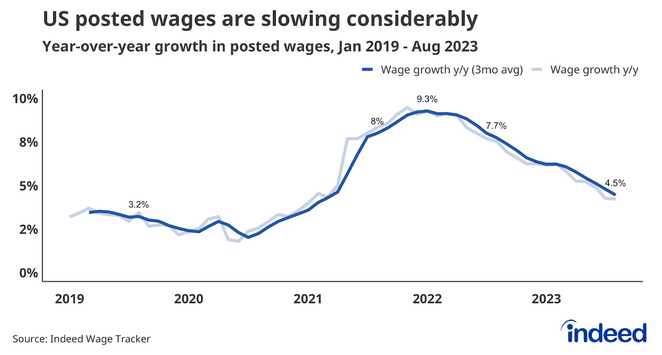
To explain, the blue lines above track Indeed’s Wage Tracker. If you analyze the right side of the chart, you can see that the YoY metric has dipped to 4.5% and is also falling swiftly.
Thus, with job openings, wages, and “poor sales” responses heading in the opposite directions of 2021 and 2022, recession signs are plentiful if you’re paying attention.
Overall, while the S&P 500 has benefited from bullish seasonality, it’s largely been range-bound over the last two months. And with the next major move likely to the downside, in our opinion, storm clouds have formed, and the PMs should suffer mightily when the weather turns.
The Mortgage Meltdown Is a Real Problem for Silver
With silver sinking deeper below its 200-day moving average, the technical damage comforting the white metal is material. Moreover, with real interest rates and the U.S. dollar also uncooperative, a recession should only intensify silver’s collapse.
For example, the Mortgage Bankers Association (MBA) revealed on Sep. 13 that the housing market remains under pressure from the recent surge in long-term Treasury yields. Joel Kan, MBA’s Vice President and Deputy Chief Economist, said:
“Mortgage applications decreased for the seventh time in eight weeks, reaching the lowest level since 1996. Last week’s decline was driven by a 5 percent drop in refinance applications to the weakest reading since January 2023.
“The 30-year fixed mortgage rate increased to 7.27 percent last week and was 40 basis points higher than where it was in late July. Purchase applications increased over the week despite the increase in rates, pushed higher by a 2 percent gain in conventional loans. Given how high rates are right now, there continues to be minimal refinance activity and a reduced incentive for homeowners to sell and buy a new home at a higher rate.”
So, while the crowd considers the alarming results inconsequential, a recessionary bear market for gold could be closer than many assume. With the housing market already in trouble from higher rates, a weaker labor market and frailer rents add to the problem.
Please see below:
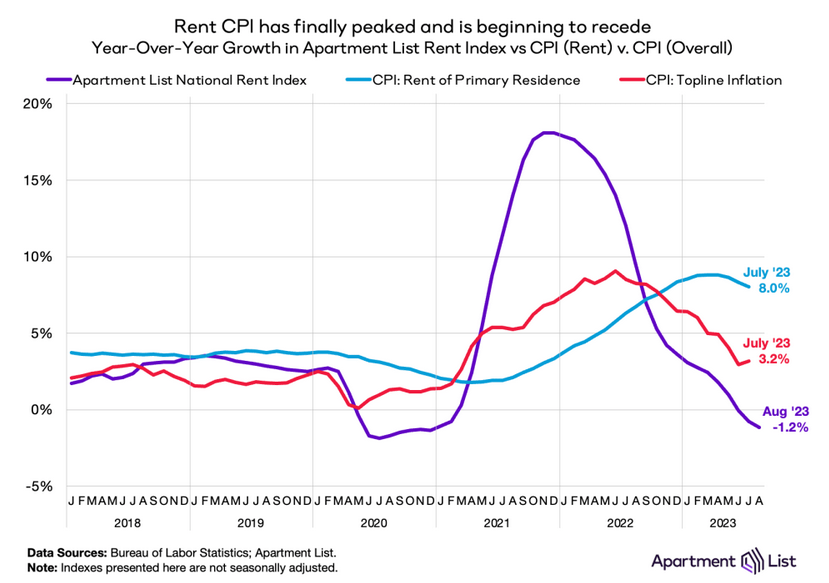
To explain, Apartment List revealed on Aug. 30 that its rent index (the purple line) has declined by 1.2% YoY. In contrast, the rent Consumer Price Index (CPI) (the light blue line) remains extremely elevated.
However, we warned about the shelter inflation surge in 2021, and if you analyze the middle area of the chart, you can see that the purple line soared well in advance of the light blue line, which means the CPI lags. Similarly, the right side of the chart shows how the purple line sunk well before the light blue line turned. Therefore, with more Shelter inflation downside on the horizon, inflation concerns should turn to growth concerns in the months ahead.
The Real Deal
Investors fail to appreciate the ramifications of slower growth and the Shelter CPI’s weakness. Remember, the Shelter CPI accounts for more than 30% of the headline CPI’s movement. And if (when) the former follows Apartment List’s rent index, inflation should seem less problematic.
Yet, even if the Fed follows through with its 100 basis points of rate cuts in 2024, financial conditions should still tighten and boost short-term real yields.
Please see below:
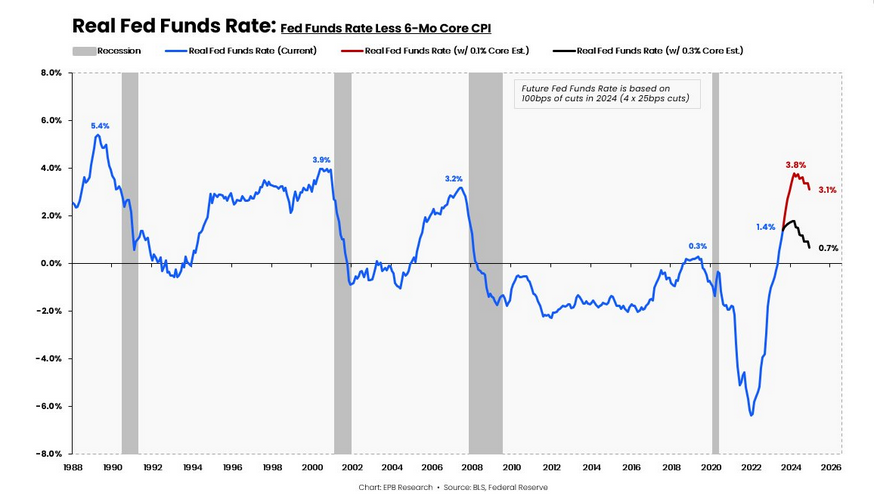
To explain, the blue line above tracks the inflation-adjusted (real) federal funds rate, and the red line at the right side of the chart highlights how high it could rise if the Shelter CPI declines and the Fed cuts 100 basis points. As you can see, the metric could hit 3.8%, which is near the levels that preceded the 2001 and 2008 recessions.
More importantly, the development would be extremely bullish for the USD Index.
Please see below:
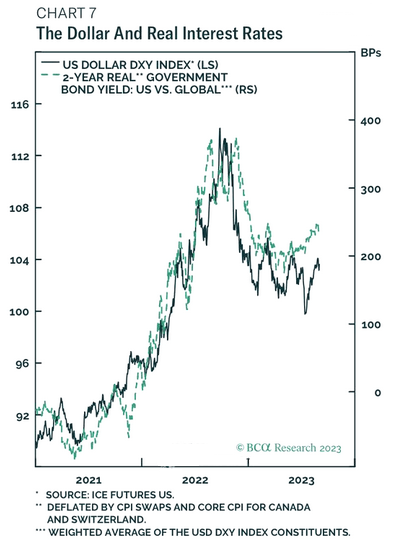
To explain, the black line above tracks the USD Index, while the green dashed line above tracks the spread between the U.S. 2-year real yield and the global 2-year real yield. When the green dashed line rises, it means that U.S. short-term real interest rates are outperforming their global counterparts and the USD Index benefits when the spread increases.
Consequently, if the real FFR rises due to the Shelter CPI deceleration, the 2-year real yield should follow suit and brighten the U.S. dollar’s medium-term outlook. As a result, there are several reasons to be bullish on the USD Index in the months ahead, while the PMs are on the wrong side of these developments.
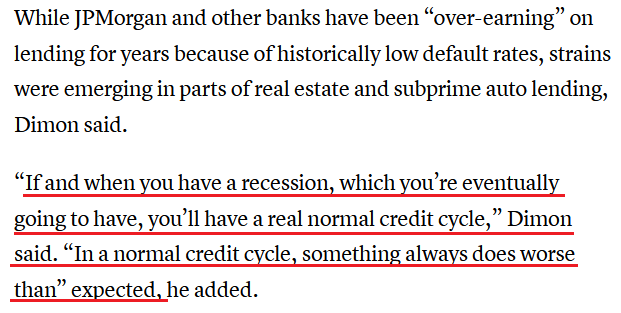
Finally, while oil prices disagree, JPMorgan CEO Jamie Dimon – who heads the largest bank in the U.S. – warned on Sep. 11 that investors are too focused on the present and blinded to the risks on the horizon. He said:
“To say the consumer is strong today, meaning you are going to have a booming environment for years, is a huge mistake. Businesses feel pretty good because they look at their current results. But those things change, and we don’t know what the full effect of all this is going to be 12 or 18 months from now.”
Thus, while the crowd assumes that a recession is extremely unlikely, we view their hopes as Transitory 2.0, and the S&P 500 should face the music before this cycle ends.
Overall, the fundamentals continue to align with our expectations. Hawkish Fed policy and higher interest rates materialized, as we predicted, and the GDXJ ETF (our short position) suffered mightily.
Now, recession clouds are forming, and the crowd has signaled the all-clear at a time when they should be cautious. Therefore, the PMs’ bear market lows should coincide with lower interest rates and a new high for the USD Index.
The Bottom Line
While our technical and fundamental predictions have proven immensely accurate over the last several months, the latter has reached an inflection point. With a resilient U.S. economy showing signs of slippage, green lights have turned yellow, and caution is warranted. And while it won’t turn red overnight, recession watch is officially underway.
In conclusion, the precious metals were mixed on Sep. 14, as silver ended the day in the red. But the outlook remains bearish, and we expect more weakness in the fall and winter.
Technically Speaking
The prices moved in an interesting manner yesterday, as all sorts of data were released. In particular, during surprising news announcements from Europe, the markets can behave quite erratically, and one has to be careful not to draw premature conclusions.
That was the case yesterday as the European Central Bank hiked the interest rates once again while the market expected a pause.
The bottom line is bearish because just as globally declining interest rates were bullish for the prices of precious metals, globally rising interest rates are bearish.
Let’s start today’s technical analysis with chart featuring the price of gold along with marked U.S. Labor Days.
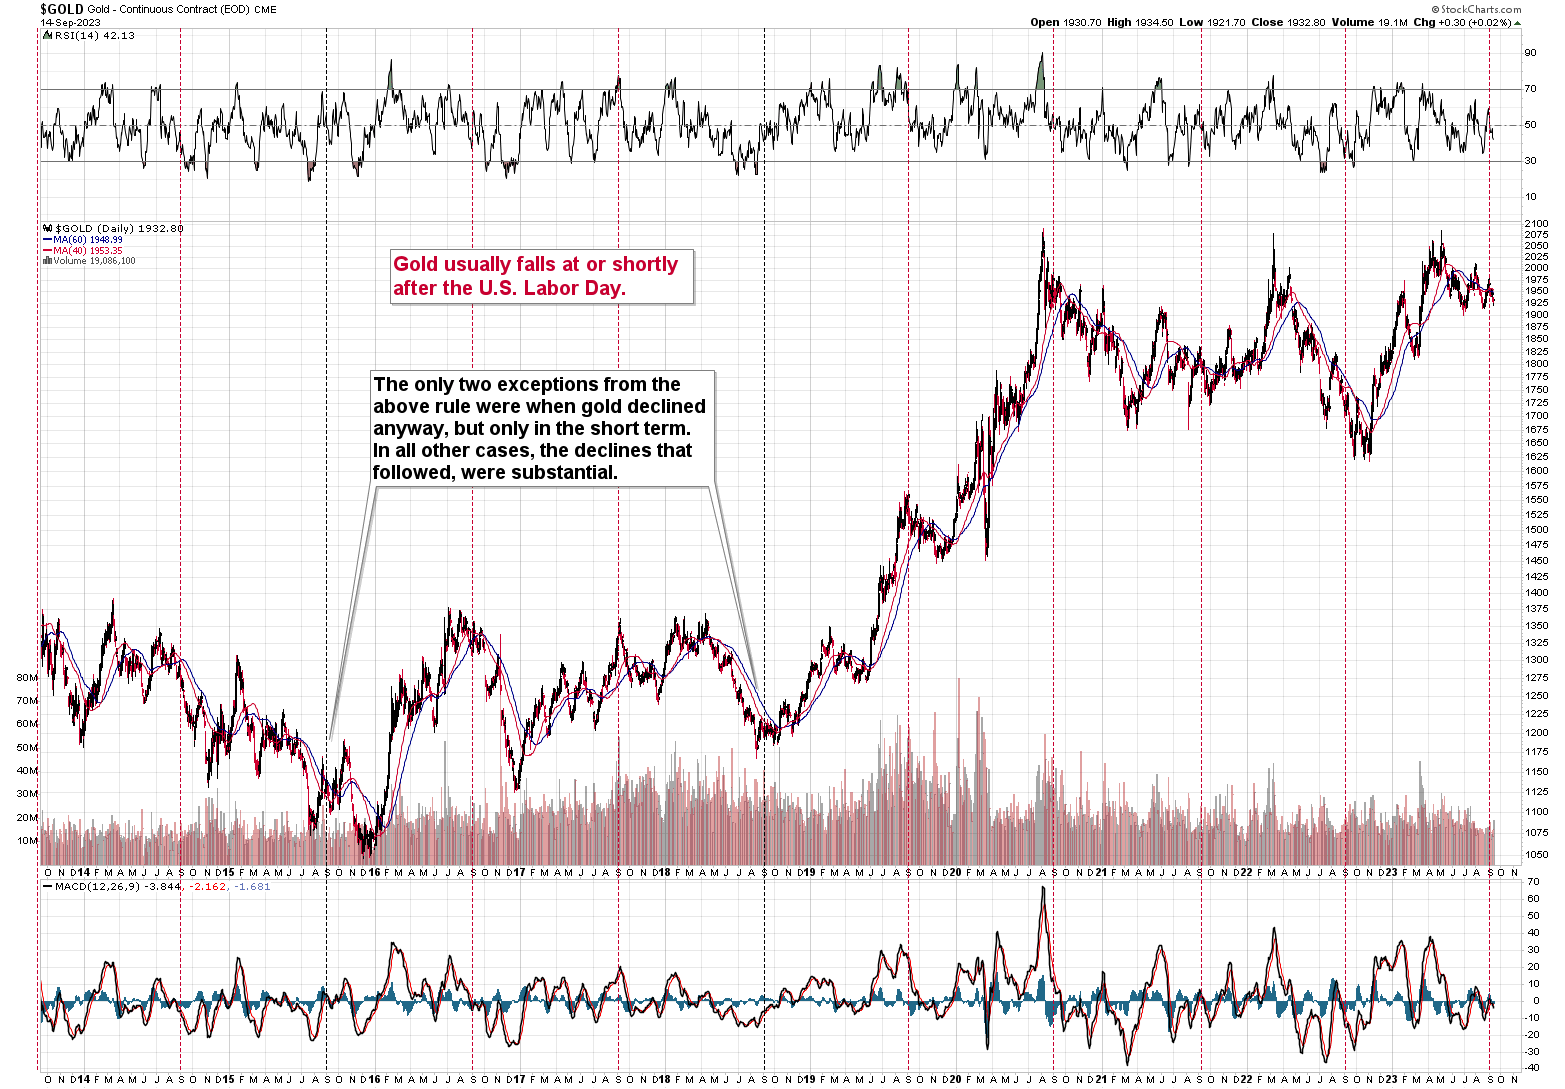
The reason we’re doing it is because this specific seasonality is still in play. I previously wrote that gold was likely to turn around close to Labor Day, and that’s exactly what happened.
However, the size of the decline that we saw recently is much smaller than what we used to see after the previous Labor Days. Consequently, gold is likely to slide further.
Of course, the long-term cyclical turning point (the vertical lines) in gold is also at play, which – as its name suggests – means that gold just formed a major top. The move that immediately preceded the turning point was down.
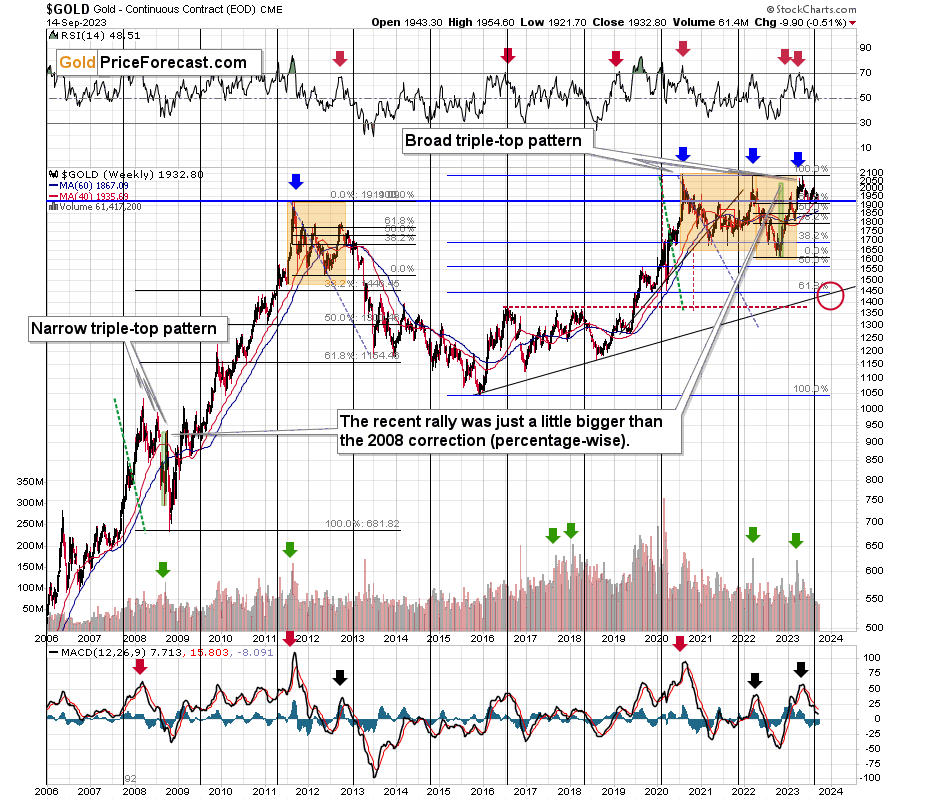
Now, given gold’s recent consolidation similar to what happened in 2012 and 2013 (it’s more visible on the HUI Index chart, and the above chart confirms it), it’s likely that the next big move lower is already underway. Please note that in late 2012 and early 2013, the decline took a back-and-forth movement, which is also happening right now.
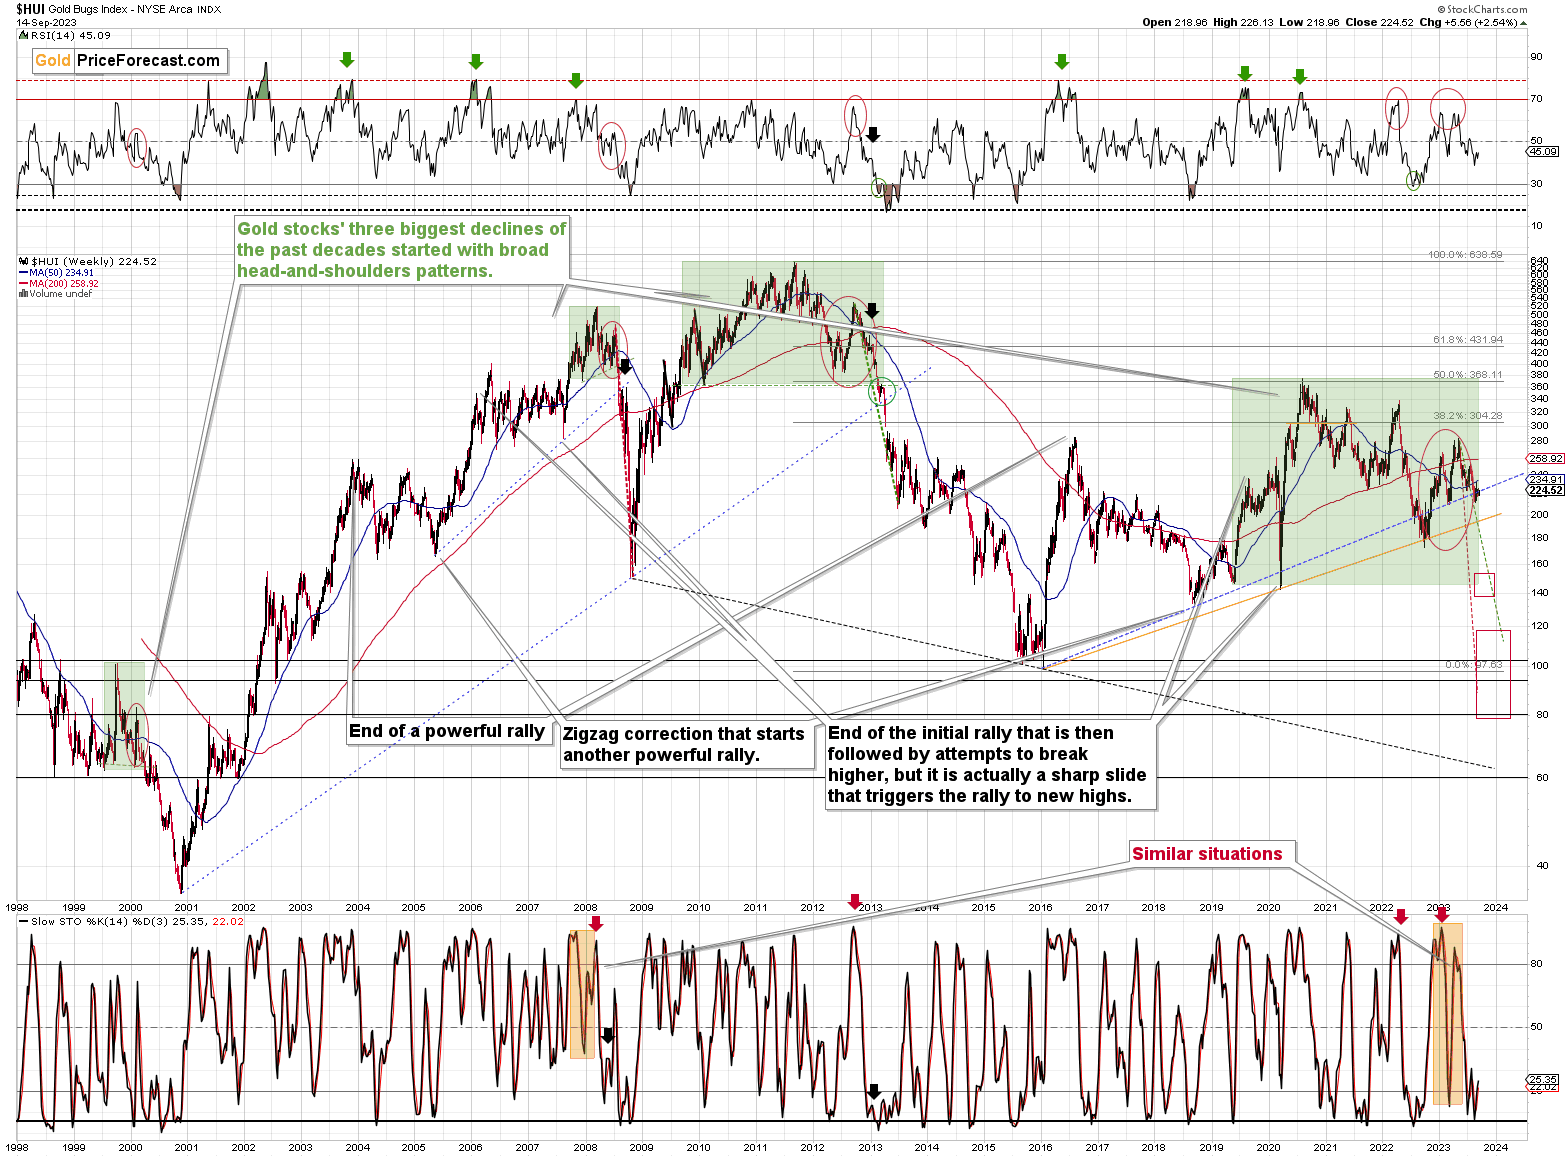
The recent market movement that I marked with green is similar to what happened between late 2009 and early 2013. Based on this analogy, we can expect a truly epic slide to follow within the next several months.
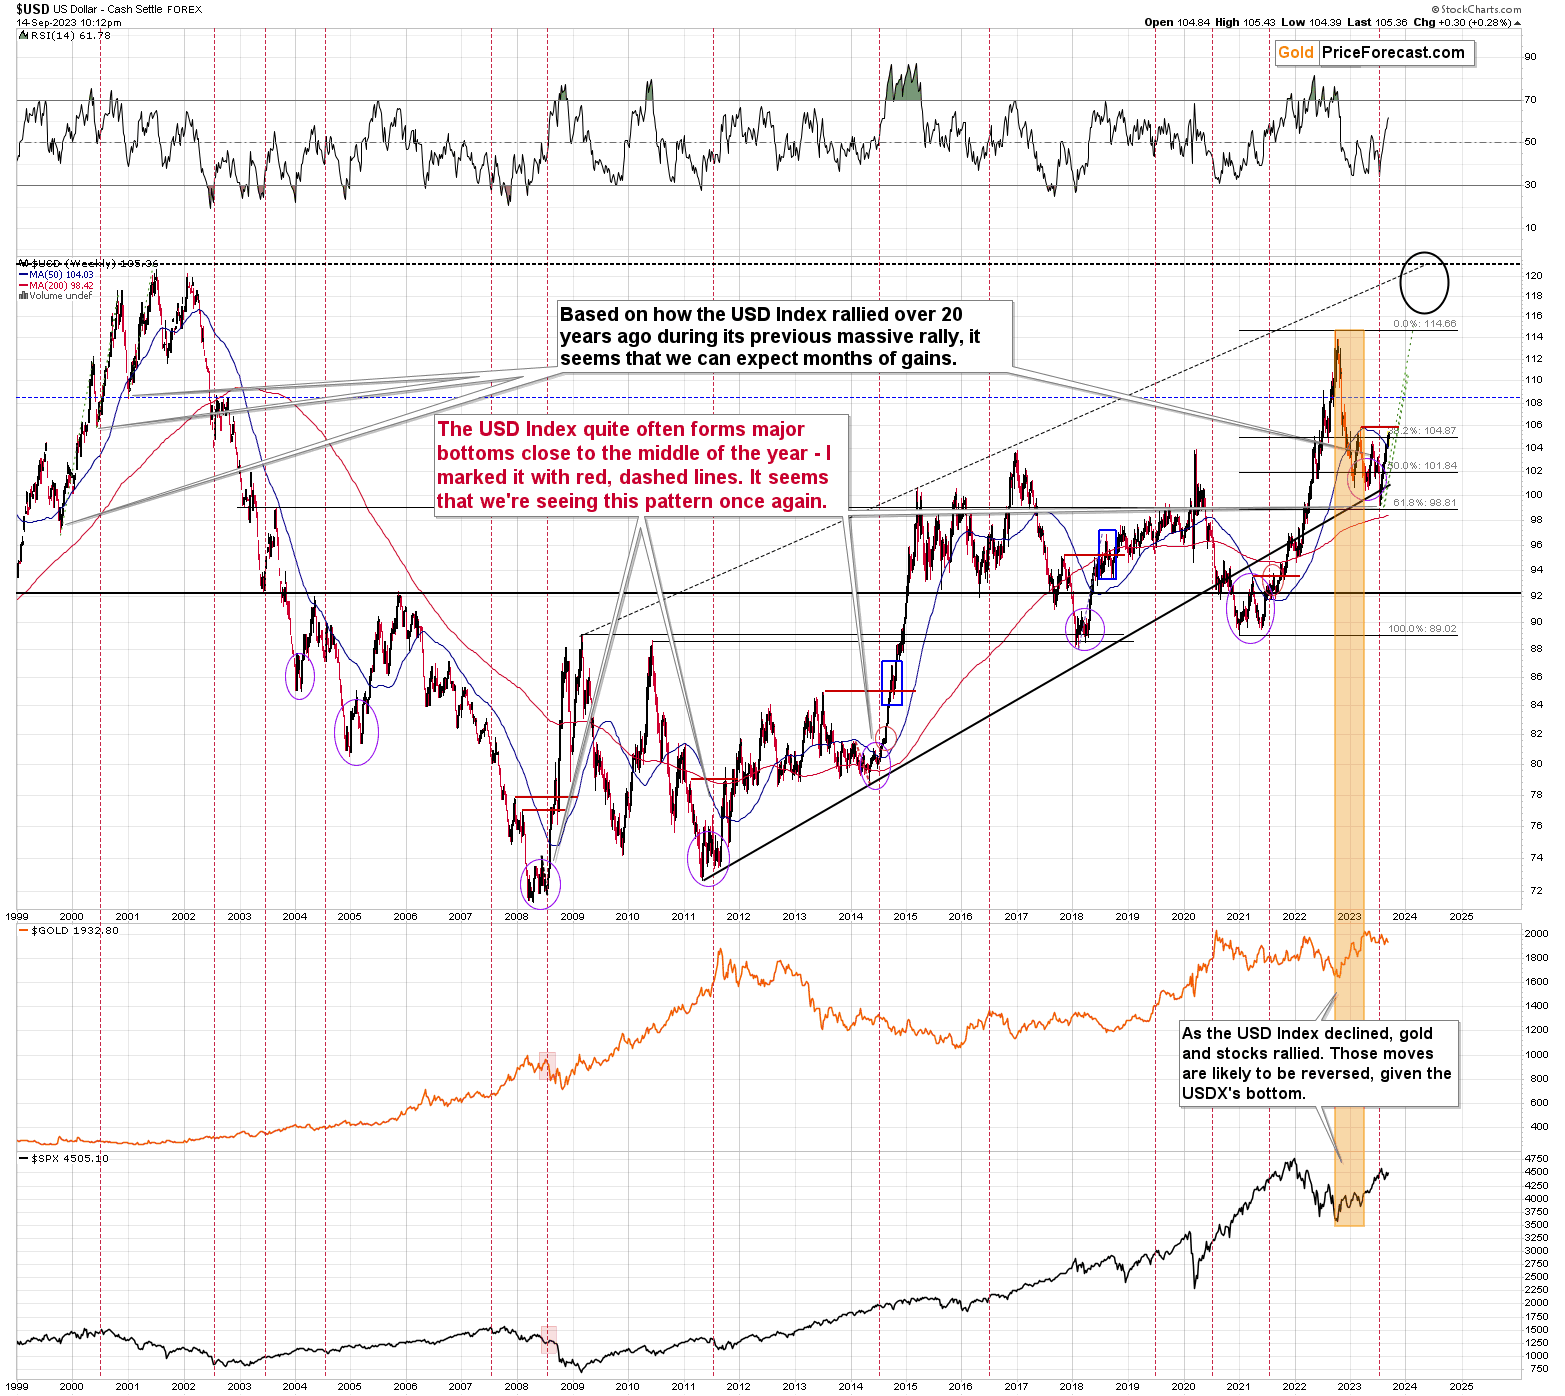
Higher USD Index prices would perfectly fit the above-mentioned scenario, and it looks like another huge move higher is underway.
I copied the sizes of medium-term rallies from 2000 (when we saw a previous rally from similar price levels), and I marked them on the current situation with green. Based on what already happened, the USDX can keep on rallying until 110 or so before another meaningful (!) pullback. There might be smaller pullbacks earlier, though.
From the short-term point of view, we see that the USD Index is already rallying after verifying the breakout above the May/June highs (below 105).
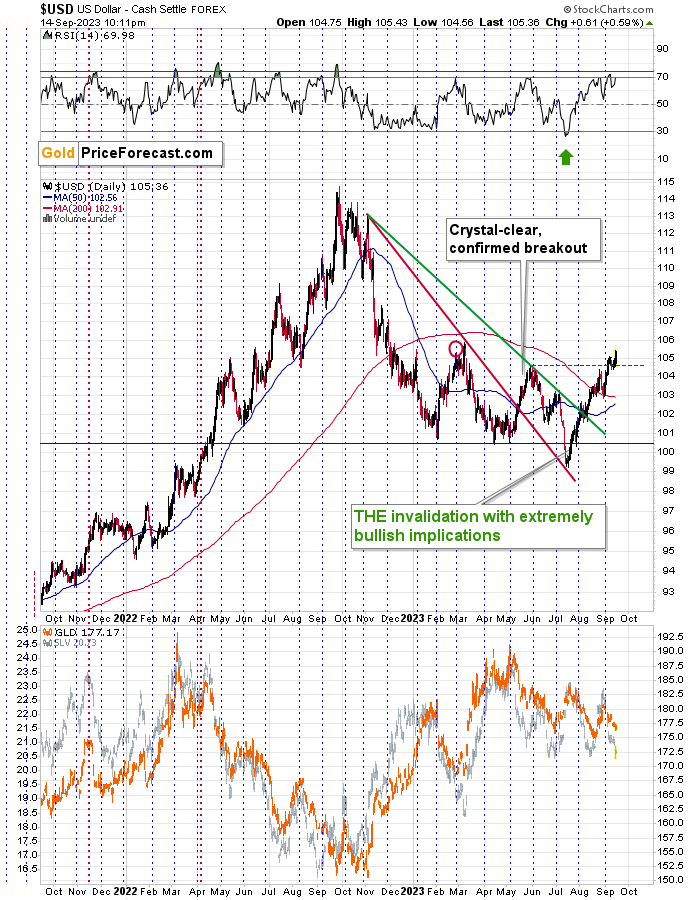
The breakout was verified, and yesterday’s rally suggests that the next big move is likely already here.
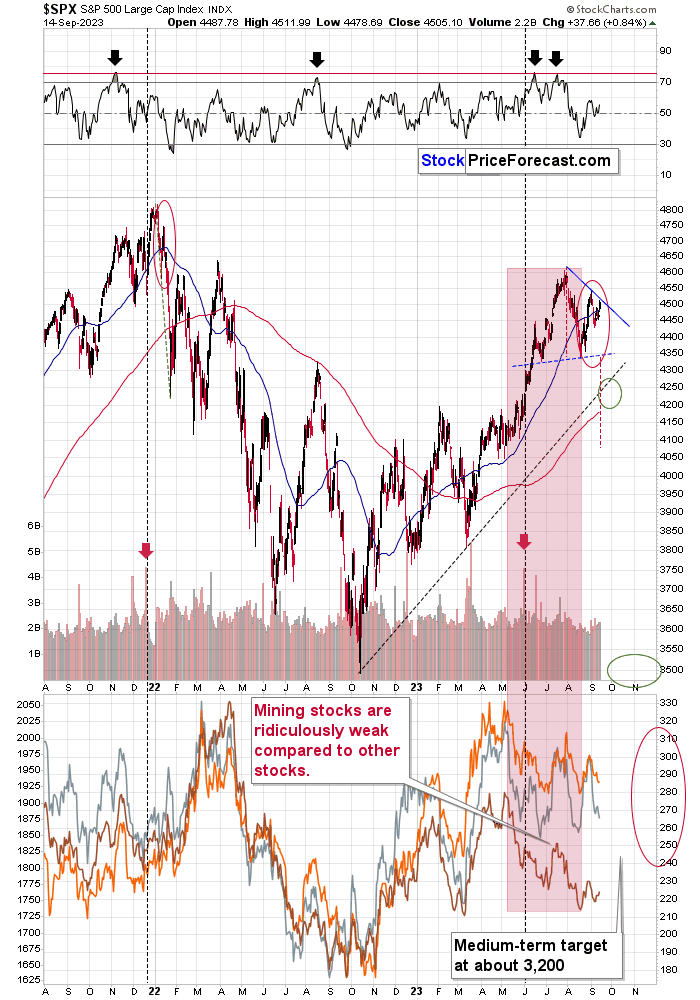
The S&P 500 moved higher, but it didn’t move above its declining blue resistance line, so it was not a big deal.
The bearish head and shoulders pattern that started in June will be completed once stocks move below 4,350. Then, they will be on their way to slide to about 4,100, which in turn is likely to lead to much lower precious metals prices, in particular junior mining stocks’ prices, which are highly correlated with stocks.
From the short-term point of view, we see that gold formed a bullish reversal on strong volume, which seems bullish. But is it?
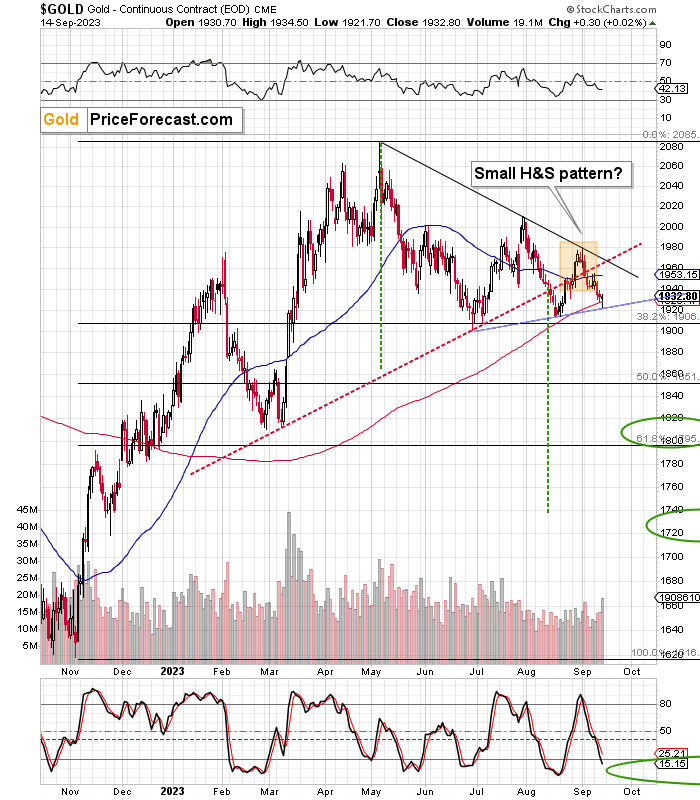
The markets already have a history of behaving erratically when something unexpected happens in the Eurozone, and one shouldn’t necessarily trust yesterday’s candlestick. On the other hand, even though it doesn’t make much sense fundamentally for gold to rally here (rates were hiked), the big-volume reversal could trigger a several-day-long rally, which is why we’re limiting our current short position.
Also, the next triangle-vertex-based reversal is due next week, so it seems that we could get a rally here that’s not THAT big and then another huge wave lower.
The maximum upside (realistically speaking; of course, I can’t promise that the price won’t go higher) is at about $1,965, where both resistance lines cross.
If one wants to day-trade this upswing, it might be a moment to go long, but that’s not what we’re going to do. Instead, we’re limiting the size of the short position. This time – especially given the USD Index’s breakout – we’ll keep the short position intact, but we’re greatly limiting its size.
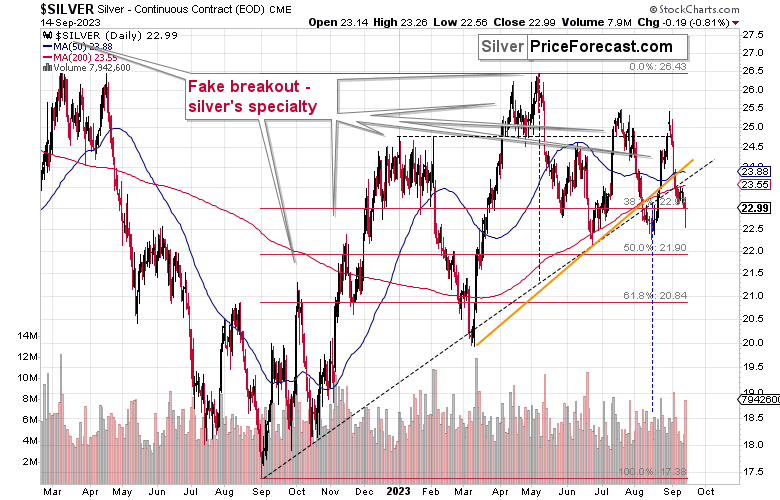
Silver reversed as well, so the question is how high can it rally before it slides again. $23.8 – $24.5 seem like the realistic upside targets.
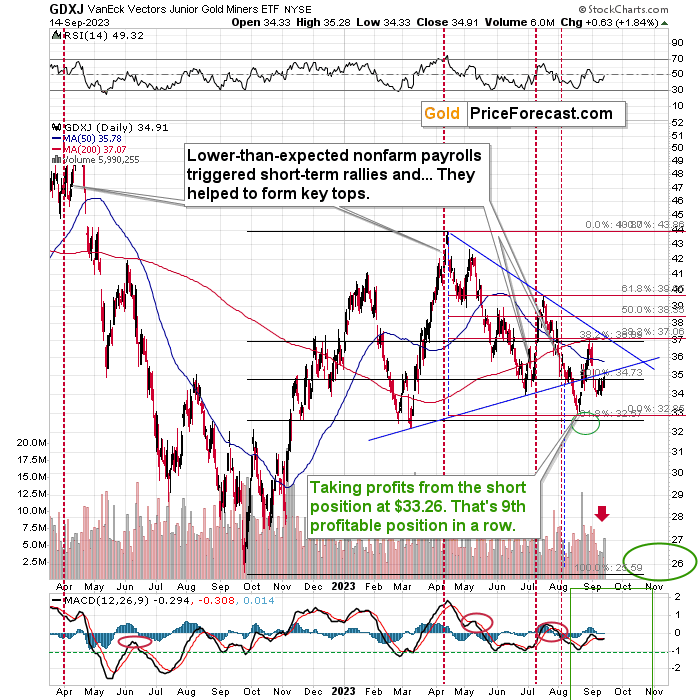
Determining the upside target for junior miners at this time is rather difficult, which is another reason due to which, I’m not opening a long position here.
For now, the GDXJ remains below the rising blue resistance line, so the technical outlook remains bearish.
Then again, if gold rallies by $30 here, the GDXJ might move higher in a visible manner, too. I wouldn’t rule out a move to the August high at about $37, but it’s not something that I actively expect to see. It’s not a high-probability move but rather a low-probability possibility.
Finally, copper stocks, like FCX are likely to slide, too.
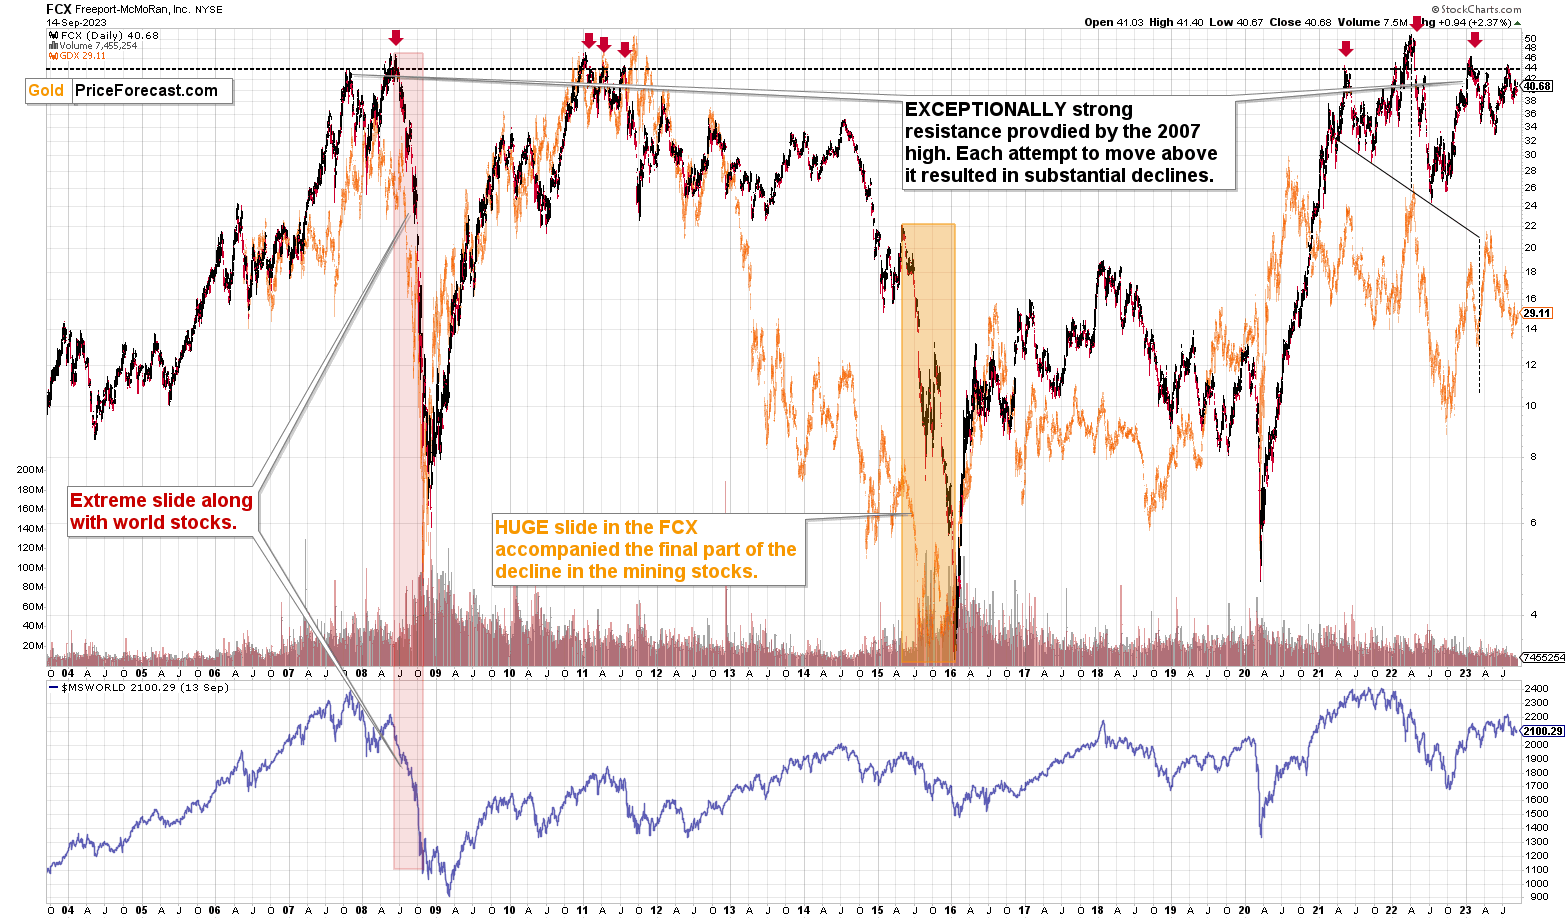
FCX just invalidated its attempt to move above its 2007 high and – just like in previous cases when the same happened – it’s now likely to slide.
What does it all mean? It means that the precious metals market is likely to slide, quite likely profoundly so, and junior mining stocks’ prices are likely to truly slide. While I can’t promise any specific rate of return, it seems to me that the profits on this decline are going to become astronomical.
===
If you’d like to participate in my Mastering Multidimensional Wealth | 1:1 Coaching Experience (perhaps by re-investing some of your profits into yourself), or become a partner/investor in Golden Meadow, you’ll find more details in the above links.
Overview of the Upcoming Part of the Decline
- It seems that the recent – and probably final – corrective upswing in the precious metals sector is over.
- If we see a situation where miners slide in a meaningful and volatile way while silver doesn’t (it just declines moderately), I plan to – once again – switch from short positions in miners to short positions in silver. At this time, it’s too early to say at what price levels this could take place and if we get this kind of opportunity at all.
- I plan to switch from the short positions in junior mining stocks or silver (whichever I’ll have at that moment) to long positions in junior mining stocks when gold / mining stocks move to their 2020 lows (approximately). While I’m probably not going to write about it at this stage yet, this is when some investors might consider getting back in with their long-term investing capital (or perhaps 1/3 or 1/2 thereof).
- I plan to return to short positions in junior mining stocks after a rebound – and the rebound could take gold from about $1,450 to about $1,550, and it could take the GDXJ from about $20 to about $24. In other words, I’m currently planning to go long when GDXJ is close to $20 (which might take place when gold is close to $1,450), and I’m planning to exit this long position and re-enter the short position once we see a corrective rally to $24 in the GDXJ (which might take place when gold is close to $1,550).
- I plan to exit all remaining short positions once gold shows substantial strength relative to the USD Index while the latter is still rallying. This may be the case with gold prices close to $1,400 and GDXJ close to $15 . This moment (when gold performs very strongly against the rallying USD and miners are strong relative to gold after its substantial decline) is likely to be the best entry point for long-term investments, in my view. This can also happen with gold close to $1,400, but at the moment it’s too early to say with certainty.
- The above is based on the information available today, and it might change in the following days/weeks.
You will find my general overview of the outlook for gold on the chart below:
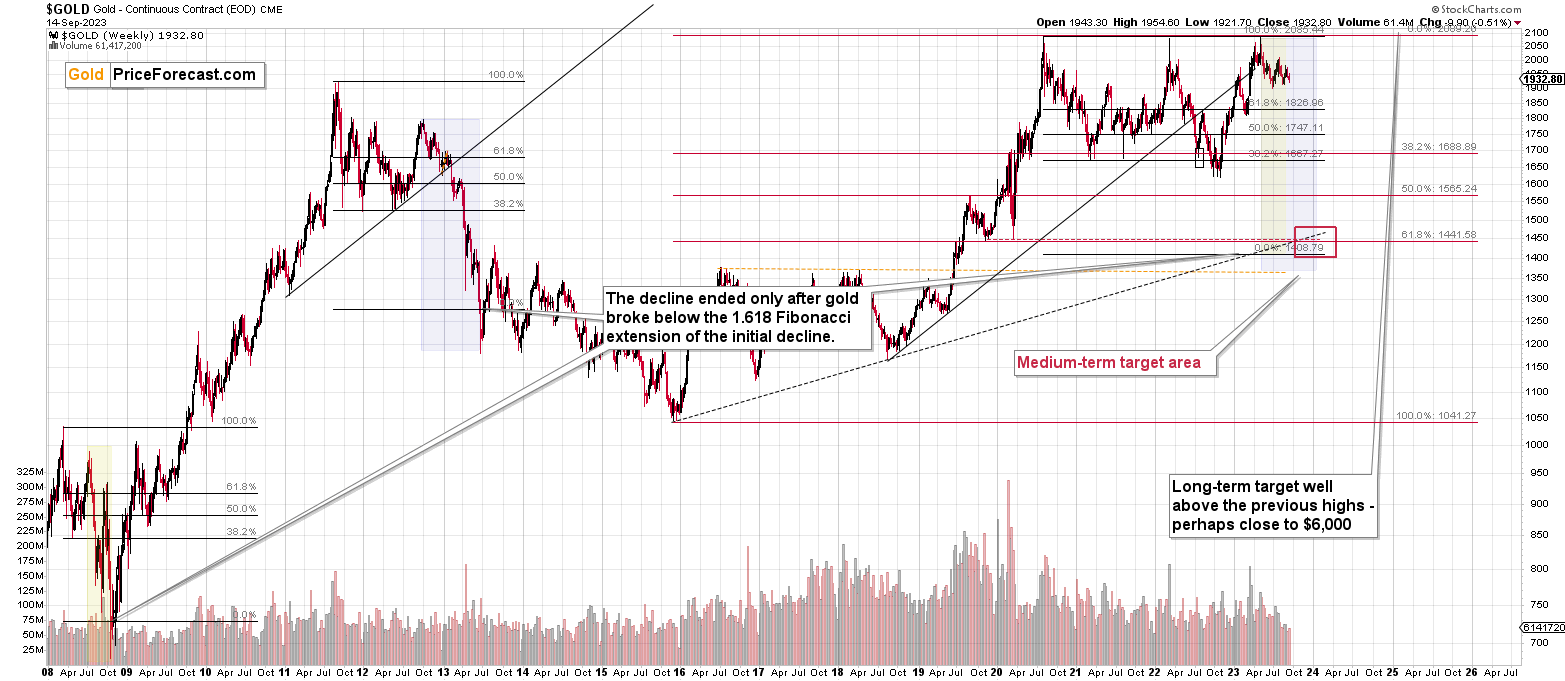
Please note that the above timing details are relatively broad and “for general overview only” – so that you know more or less what I think and how volatile I think the moves are likely to be – on an approximate basis. These time targets are not binding nor clear enough for me to think that they should be used for purchasing options, warrants, or similar instruments.
Letters to the Editor
Please post your questions in the comments feed below the articles, if they are about issues raised within the article (or in the recent issues). If they are about other, more universal matters, I encourage you to use the Ask the Community space (I’m also part of the community), so that more people can contribute to the reply and enjoy the answers. Of course, let’s keep the target-related discussions in the premium space (where you’re reading this).
Summary
To summarize, the medium-term trend in the precious metals sector remains clearly down, and it seems that the corrective upswing is already over and the profits on our current short position are going to increase. We just caught the 10th profitable trade in a row – congratulations. The outlook for the short positions in junior miners and in the FCX remains very favorable.
===
To summarize:
Finally, since 10th profitable trade in a row is such a great piece of news (and the same goes for the fact that the current short position is already profitable), here’s… Even more great news! The possibility to extend your subscription for up to three years (at least by one year) with a 20% discount from the current prices is still open.
Locking in those is a great idea not only because it’s perfect time to be ready for what’s next in the precious metals market, but also because the inflation might persist longer than expected and prices of everything (including our subscriptions) are going to go up in the future as well. Please reach out to our support – they will be happy to assist you and make sure that your subscription days are properly extended at those promotional terms. So, for how many years would you like to lock-in your subscription?
Short-term outlook for the precious metals sector (our opinion on the next 1-6 weeks): Bearish
Medium-term outlook for the precious metals sector (our opinion for the period between 1.5 and 6 months): Bearish initially, then possibly Bullish
Long-term outlook for the precious metals sector (our opinion for the period between 6 and 24 months from now): Bullish
Very long-term outlook for the precious metals sector (our opinion for the period starting 2 years from now): Bullish
As a reminder, Gold Investment Updates are posted approximately once per week. We are usually posting them on Monday, but we can’t promise that it will be the case each week.
Our preferred ways to invest in and to trade gold along with the reasoning can be found in the how to buy gold section. Additionally, our preferred ETFs and ETNs can be found in our Gold & Silver ETF Ranking.
Moreover, Gold & Silver Trading Alerts are posted before or on each trading day (we usually post them before the opening bell, but we don’t promise doing that each day). If there’s anything urgent, we will send you an additional small alert before posting the main one.
Thank you.
Przemyslaw K. Radomski, CFA
Founder, Editor-in-chief

