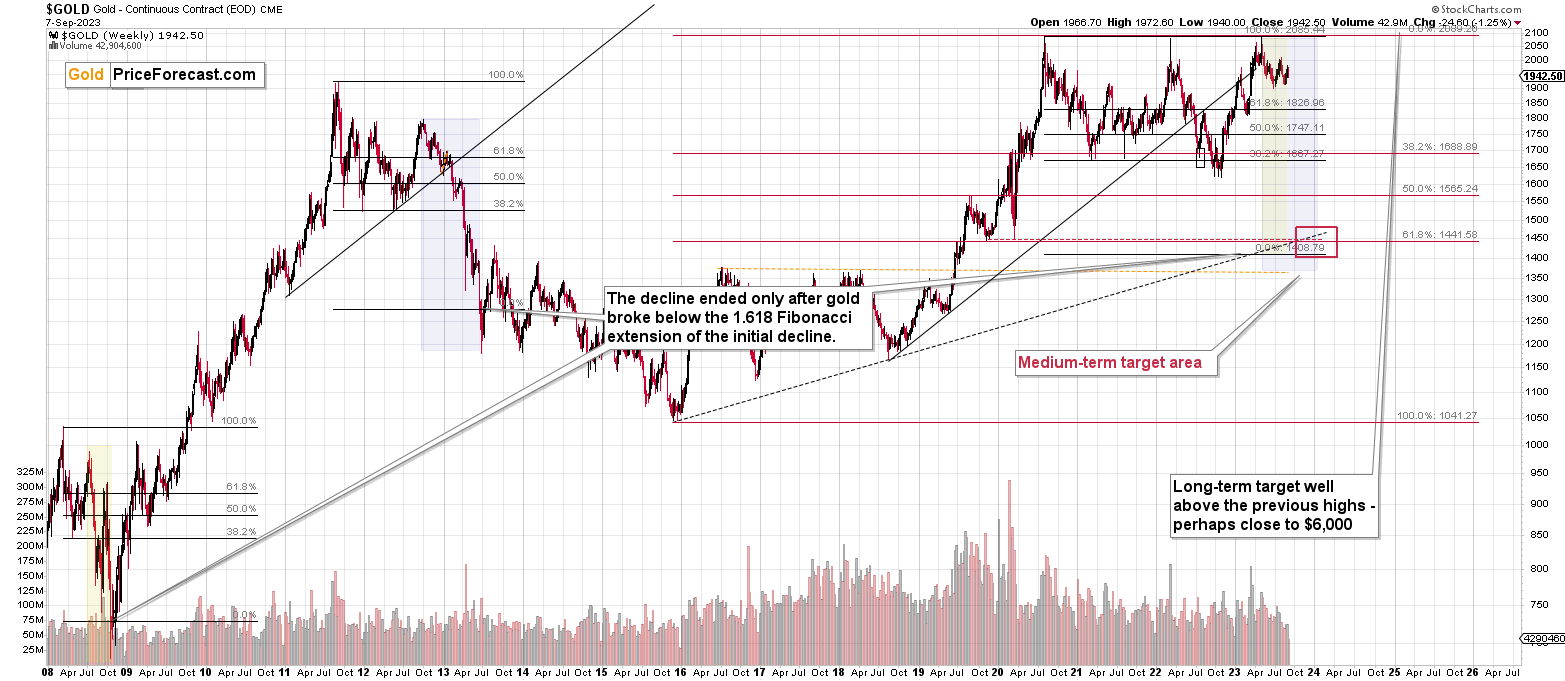
Briefly: gold and the rest of the precious metals market are likely to decline in the next several weeks/months and then start another powerful rally. Gold’s strong bullish reversal/rally despite the USD Index’s continuous strength will likely be the signal confirming that the bottom is in.
Welcome to this week's Gold Investment Update.
Predicated on last week’s price moves, our most recently featured medium-term outlook remains the same as the price moves align with our expectations (and we not only took profits from the previous short position, but we profited on the rebound, and are now making money on the short side again). On that account, there are parts of the previous analysis that didn’t change at all in the earlier days and are written in italics.
The key things that are happening this week are the following: the precious metals (PMs) and the general stock market remain under pressure (as interest rates stay high), the USD Index continues to strengthen, and weak economic data provokes recession fears.
We’ll begin with the fundamental outlook, and then dive into the technical aspects that have proven so prescient over the last several months.
Recession Fears Scare Gold
With the PMs declining again on Sep. 7, our GDXJ short position posted another day of profits. Moreover, with gold closing below its 50-day moving average, we think more downside should materialize in the weeks ahead.
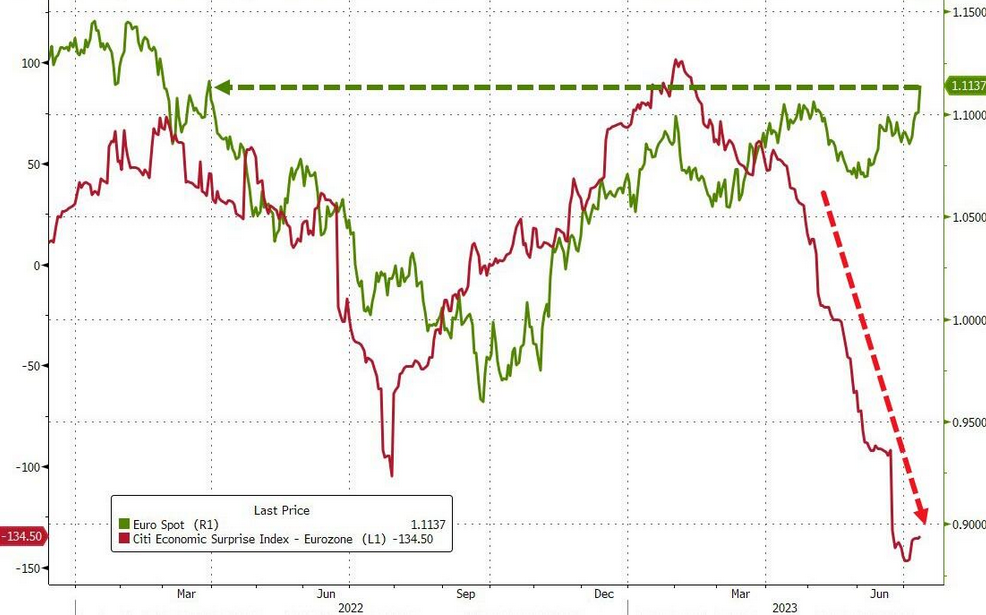
For example, the U.S. dollar is one of the main components in our bearish precious metals thesis. And with the EUR/USD accounting for nearly 58% of the USD Index’s movement, Europe’s economic fright fest has pressured the currency pair. Furthermore, we warned this would occur on Jul. 14. We wrote:
Euro optimism contrasts the realities on the ground, and the bulls should suffer mightily in the months ahead.
Please see below:
The green line above tracks the EUR/USD, while the red line above tracks Citigroup’s Eurozone Economic Surprise Index. For context, a positive ‘surprise’ occurs when a data point outperforms economists’ consensus estimate, while a negative surprise is the opposite. And if you analyze the right side of the chart, you can see that the red line has crashed, as Eurozone economic data has come in much weaker than expected.
Therefore, while gold benefits from the euro’s uprising, the ominous fundamentals plaguing the Eurozone should come home to roost and uplift the U.S. dollar.
To that point, S&P Global/HCOB revealed on Sep. 5 that “the Eurozone economy declined at the fastest rate in nearly three years in August.” The report added:
“For the first time in 2023 so far, output fell in both the services and manufacturing sectors. The service sector ended a seven-month run of growth with the steepest contraction since February 2021. Goods production meanwhile dropped for the fifth month running and at another rapid rate, albeit one that eased since July.”
As a result, with Europe racing toward a recession, the fundamental backdrop continues to align with our expectations of a stronger USD Index.
Please see below:
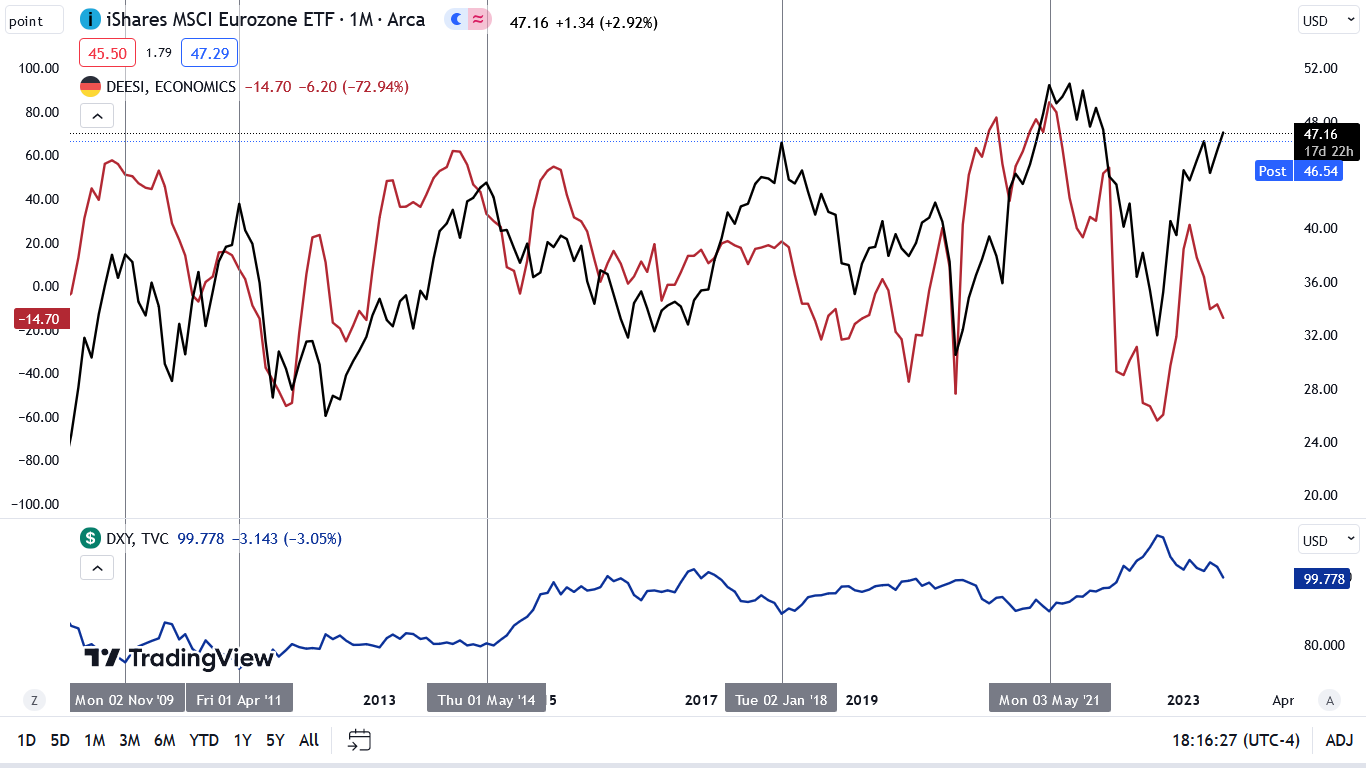
Likewise, we also noted the relationship between the USD Index and European stocks. We added on Jul. 14:
While no one cares right now, investors’ appetite for European risk assets should come under immense pressure over time, and the USD Index should be a primary beneficiary.
Please see below:
To explain, the black line above tracks the monthly movement of the iShares MSCI Eurozone (EZU) ETF, while the red line above tracks the German ZEW Economic Sentiment Index. As you can see, when weak economic sentiment plagues Europe, its stock markets suffer mightily.
Yet, if you analyze the right side of the chart, you can see that the EZU ETF closed at a new 2023 high on Jul. 13, while the ZEW ESI has materially diverged. However, since 2009, the EZU ETF has not been able to prosper when the ZEW ESI crashes, and this time should be no different.
To that point, please turn your attention to the blue line at the bottom, as it tracks the USD Index. If you analyze the vertical gray lines, you can see that when the EZU ETF peaks and begins its descent, the USD Index bottoms and begins its ascent.
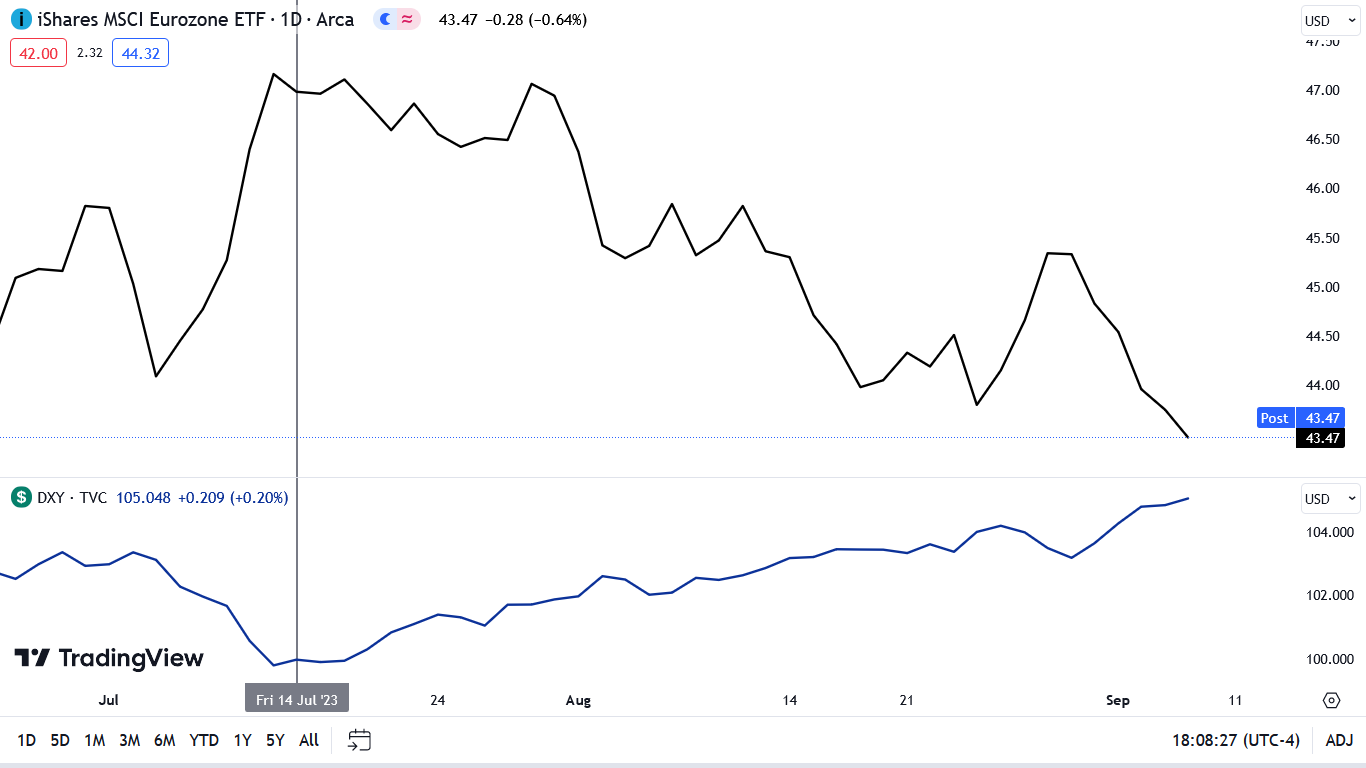
Thus, with the prediction proving prescient, the EZU ETF’s downfall has coincided with a USD Index rally.
Please see below:
To explain, the black line above tracks the EZU ETF, while the blue line above tracks the USD Index. If you analyze the horizontal gray line near the left side of the chart, you can see that when the EZU ETF began to stumble on Jul. 14, the USD Index found its footing and the pair went in opposite directions. Consequently, the fundamentals continue to align with our thesis, and the outlooks for gold, mining stocks and silver remain bearish.
More Dollar Fuel
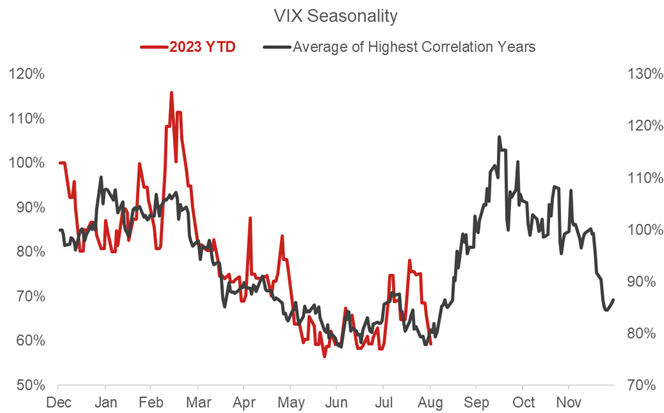
While a Eurozone malaise helps support the greenback, more catalysts could supercharge the dollar’s ascent. For example, the Cboe Volatility Index (VIX) has been heavily depressed in recent months. But, with VIX seasonality highly bullish, a material drawdown of the S&P 500 should result in further profits for our GDXJ ETF short position.
Please see below:
To explain, the black line above tracks the VIX’s average movement during the highest correlation years, while the red line above tracks its movement year-to-date (YTD). If you analyze the middle of the chart, you can see that the VIX typically bottoms in the summer before rising sharply in the fall.
So, if the VIX regains its swagger in the weeks ahead, it should result in more USD Index upside, which is bearish for the PMs.
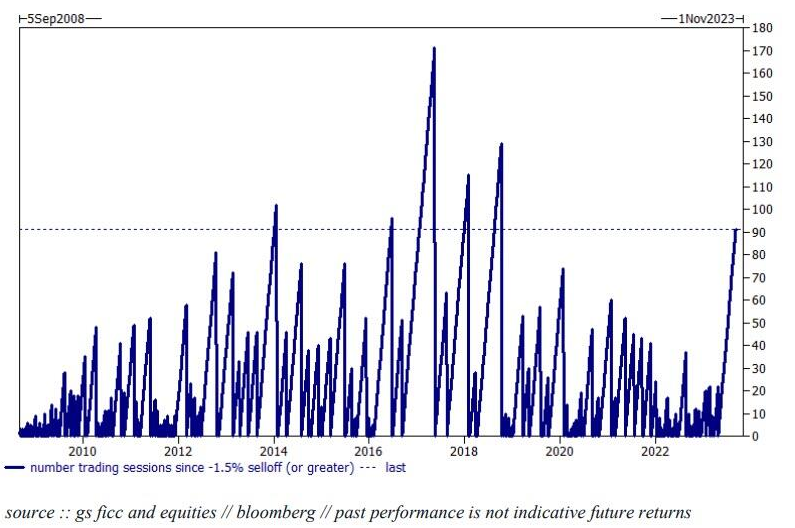
As another sign of stock market complacency, the S&P 500 has gone 92 days without suffering a daily decline of 1.5% or more. And with the streak near the highs seen over the last ~13 years, a Minsky Moment could be even more painful considering the abnormally bullish behavior.
Please see below:
To explain, the blue line above tracks the number of days it took for the S&P 500 to experience a 1.5% or more daily drawdown. If you analyze the horizontal dotted line, you can see that there aren’t many occurrences where the S&P 500 was more tranquil. As a result, we should see this streak end in the weeks ahead.
Overall, the fundamentals have not deviated from our expectations. High interest rates and a stronger U.S. dollar remain bearish for the PMs, and recession clouds make the backdrop even worse. Moreover, higher oil prices reduce Americans’ disposable incomes, and student loan repayments restart in October. Therefore, recession winds should grow stronger over the next few months.
Silver Loses Its 200-Day MA Again
After another beatdown on Sep. 7, silver closed below its 200-day MA. And with the technical damage poised to elicit steeper losses in the months ahead, we think the shorts will emerge victorious until our indicators become more constructive.
For example, we highlighted the economic plight across Europe and how a resurgent VIX could provide further fuel for the U.S. dollar. But, the liquidity backdrop is highly precarious, and the U.S. and Europe continue to siphon cash out of the system.
Please see below:
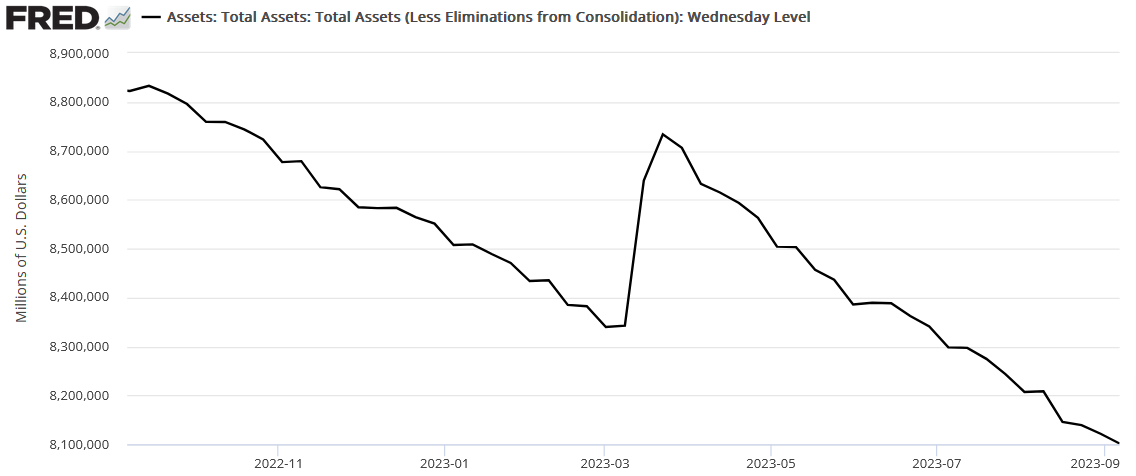
To explain, the Fed’s balance sheet hit a new cycle low on Sep. 7, as quantitative tightening (QT) remains alive and well. And with the downtrend poised to continue until a recession materializes (in our opinion), silver is stuck between a rock and a hard place, while gold shouldn’t fare much better.
As further evidence, the liquidity fundamentals in Europe are also extremely troublesome.
Please see below:
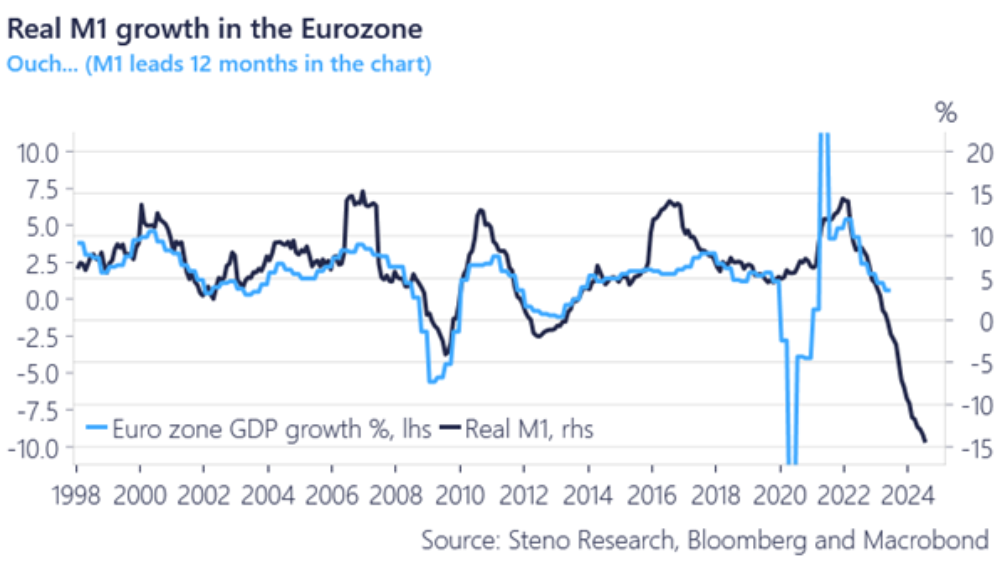
To explain, the light blue line above tracks Eurozone GDP growth, while the dark blue line above tracks real M1 money supply growth. If you analyze the relationship, you can see that fewer euros in the system is often bad news for economic output. And with money supply growth falling to its lowest level in roughly 25 years, the U.S. dollar should be the main beneficiary from the unfolding liquidity drought.
Labor Concerns
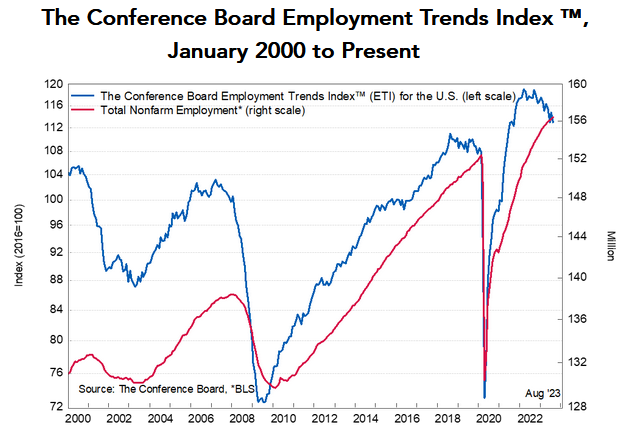
The U.S. labor market’s strength was the main reason we faded the recession narratives in 2021 and 2022. However, with the outlook weakening, job losses should cause even more anxiety in the months ahead. As evidence, The Conference Board released its Employment Trends Index (ETI) on Sep. 5. Selcuk Eren, Senior Economist at The Conference Board, said:
“Some industries are already shedding jobs, including information services and transportation and warehousing. The ETI suggests that weakness in the job market will eventually broaden to the rest of the labor market.
“The number of employees working in temporary help services, an important early indicator for hiring in other industries, has declined steadily since it peaked in March 2022. While still elevated compared to pre-pandemic levels, Job openings – an indicator of opportunities available to workers – are declining rapidly.”
Please see below:
To explain, the blue line above tracks The Conference Board’s ETI, while the red line above tracks total nonfarm payrolls. If you analyze the relationship, you can see that when the ETI suffers sustained declines, nonfarm payrolls are not far behind. Moreover, with the blue line showcasing a noticeable drop on the right side of the chart, the downtrend should continue as higher long-term interest rates further suppress the U.S. economy.
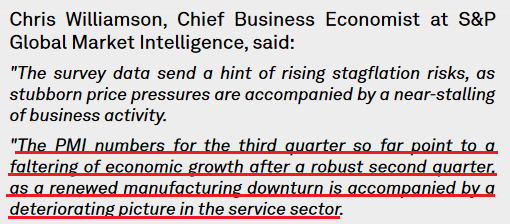
Speaking of which, the ISM released its services PMI on Sep. 1. And while the results were optimistic – with output and employment increasing – they contrasted the findings from S&P Global. And with the latter more accurate in our opinion, we prioritized S&P Global’s data in 2021 and 2022 and will continue to do so now. The report stated:
“Service sector firms meanwhile recorded only a fractional rise in employment midway through the third quarter…. The softer uptick in workforce numbers reflected emerging evidence of spare capacity across the service sector, amid the renewed drop in new business. Backlogs of work fell for a second month running, declining at the steepest rate since November 2022.”
Please see below:
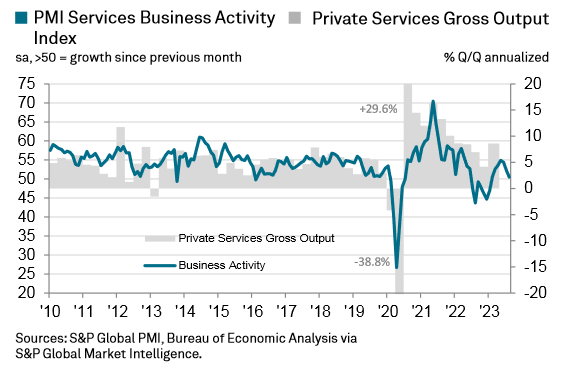
To explain, the blue line above tracks S&P Global’s services PMI, while the gray bars above track services firms’ gross output. As you can see, a lower blue line is often bearish for services output and signals weaker growth in the months ahead. And with manufacturing already in contraction, a services turn could be the final nail in the coffin for the S&P 500 and the PMs.
Overall, the global economic outlook remains precarious, and crude oil’s ascent further suppresses businesses’ profit margins and consumers’ spending power. As such, while higher interest rates and a stronger USD Index were the central parts of our bearish fundamental thesis (the left side of the dollar smile), a recession that culminates with lower interest rates and a surging USD Index should help push the PMs to their long-term lows (the right side of the dollar smile).
The Bottom Line
The fundamentals remain aligned with our expectations, as stubborn inflation helped push long-term interest rates higher and have kept the Fed hawkish for longer than expected. Yet, with long-term Treasury yields poised to weigh on economic activity, this cycle should conclude with a recession that pushes the PMs to their final lows and the USD Index to a new high.
In conclusion, the PMs declined on Sep. 7, as more pain confronted risk assets. And with the bearish fundamentals far from fixed, more downside should commence in the weeks ahead.
Technically Speaking
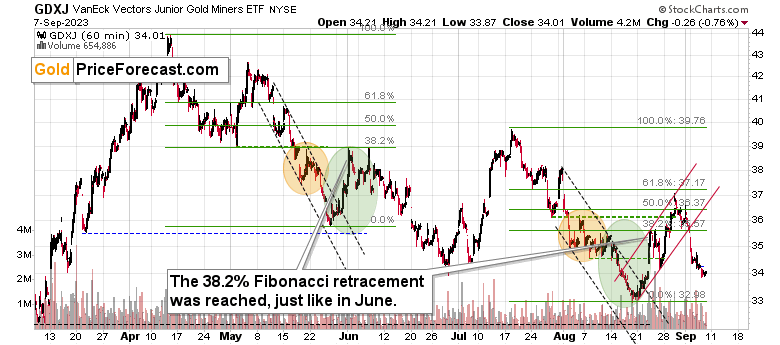
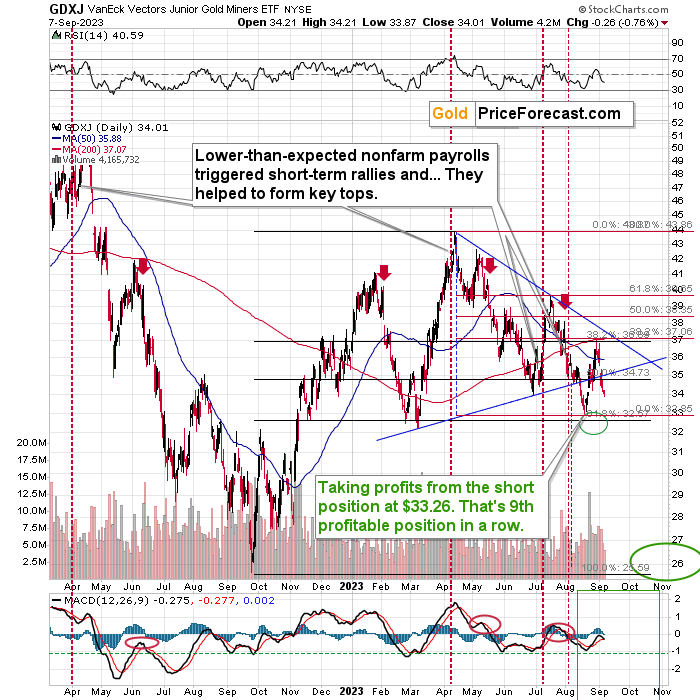
Little changed across the precious metals sector on Sep. 7, as the GDXJ ETF continued its descent, which boosted the profits from our short position. Furthermore, gold and silver also suffered, and the bearish medium-term outlook I warned about continues to unfold as planned. For a complete breakdown, please read my comments from Sep. 7:
Another day, another increase in profits – nice, right? The best part is that it’s just most likely just the beginning!
Remember when I wrote about the tiny breakout in the GDXJ that we saw last Friday? It was barely visible, and yet, it was the thing that triggered the substantial post-U.S.-Labor-Day slide.
We just saw something similar with regard to the previous lows.
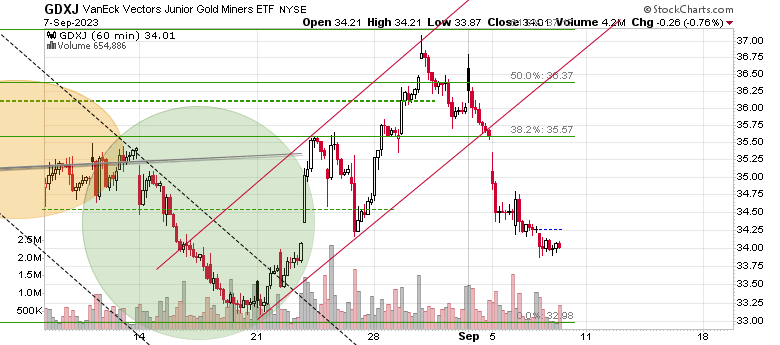
The GDXJ just closed below the late-August low. It’s more visible once we zoom in.
It was not just an intraday move below the late-August low, but it was actually a daily close below those levels. While this doesn’t make the breakdown confirmed on its own, it does indicate that something might be up (or more precisely in this case: down).
Earlier this week, the slide materialized immediately after such a tiny breakdown happened, so the implications are already bearish.
Interestingly, from the daily point of view (the above chart is based on the daily candlesticks), we saw a verification of the move below the rising blue support line. The GDXJ moved back to this line and then it declined once again.
This means that it’s now ready to move lower. Probably MUCH lower. Once junior miners move below their 2023 lows – and that move seems to be just around the corner – they are likely to truly plunge.
There is no significant support all the way down to the $26 - $28 area. Just as the move up from those levels was fast, the same is likely to be the case for the move lower.
The difficult part of making money on this move lower might be not to get out too early. People have tendency to let losing positions grow, while cutting the winners too early. Please keep the above note about support levels in mind, as the GDXJ slides to new yearly lows. It’s really likely to slide substantially before correcting in a meaningful manner.
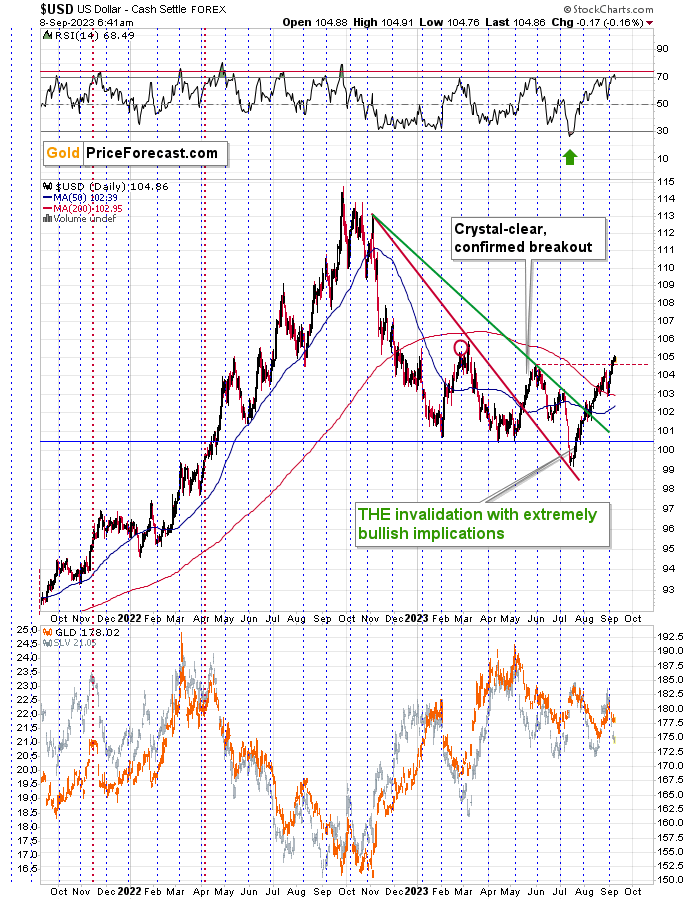
Meanwhile, the USD Index refused to invalidate the move above its previous high, so the situation is developing in line with my yesterday’s comments:
The USD Index just moved above its May highs, and even though the RSI is close to 70, I don’t see a decline from here as a likely outcome.
Why?
Because of the invalidation of the breakdown to new yearly lows that we saw in July. Back then, I wrote that this event was much more important than it seemed at first sight, and that the implications will be visible in the many weeks to come.
It’s true that the USD Index tends to reverse its course close to the turn of the month, but that already happened. We saw a small correction, and the USD Index rallied shortly thereafter.
Besides, given the importance of the above-mentioned invalidation, it’s likely that a much bigger rally is ahead, and when we saw one in 2021 and 2022, when RSI was in a similar position, we haven’t necessarily saw huge declines.
I marked two similar cases with red, dotted lines. Back in November 2021, it was actually a local top in gold and silver. And back in April 2022, a big, medium-term decline following in the precious metals sector, while the USD Index soared.
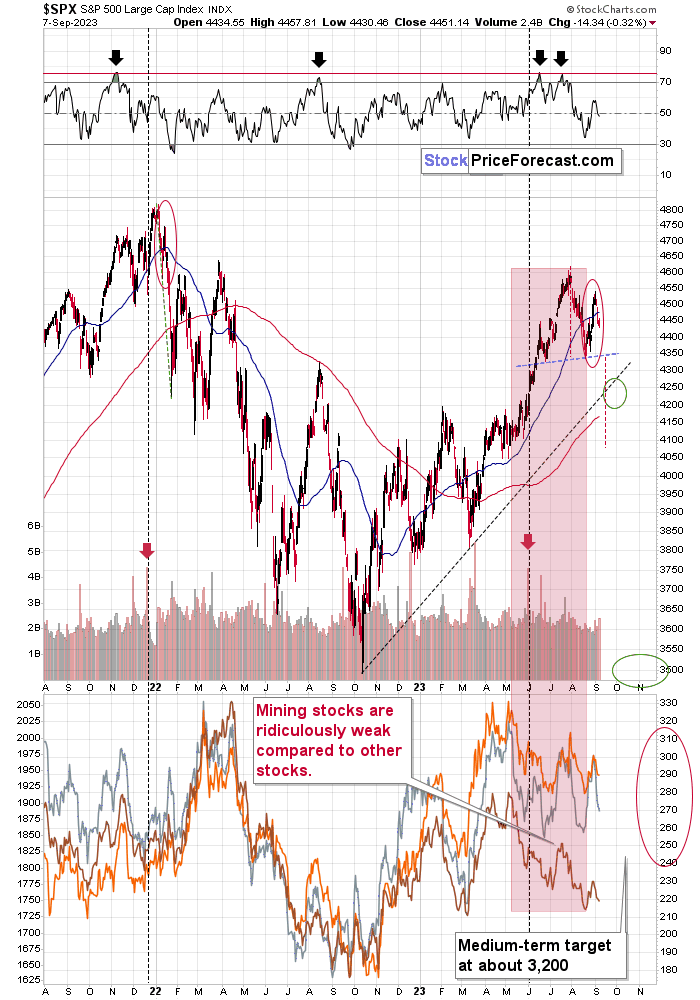
Also, please note that stocks finally moved lower, probably forming the bearish head-and-shoulders top pattern.
Some time ago I marked the current trading range with a red ellipse and I argued that it appeared similar to what happened in early 2022, right after the final top. This week’s decline confirms this scenario. Of course, the implications for the precious metals sector are bearish – especially for junior mining stocks.
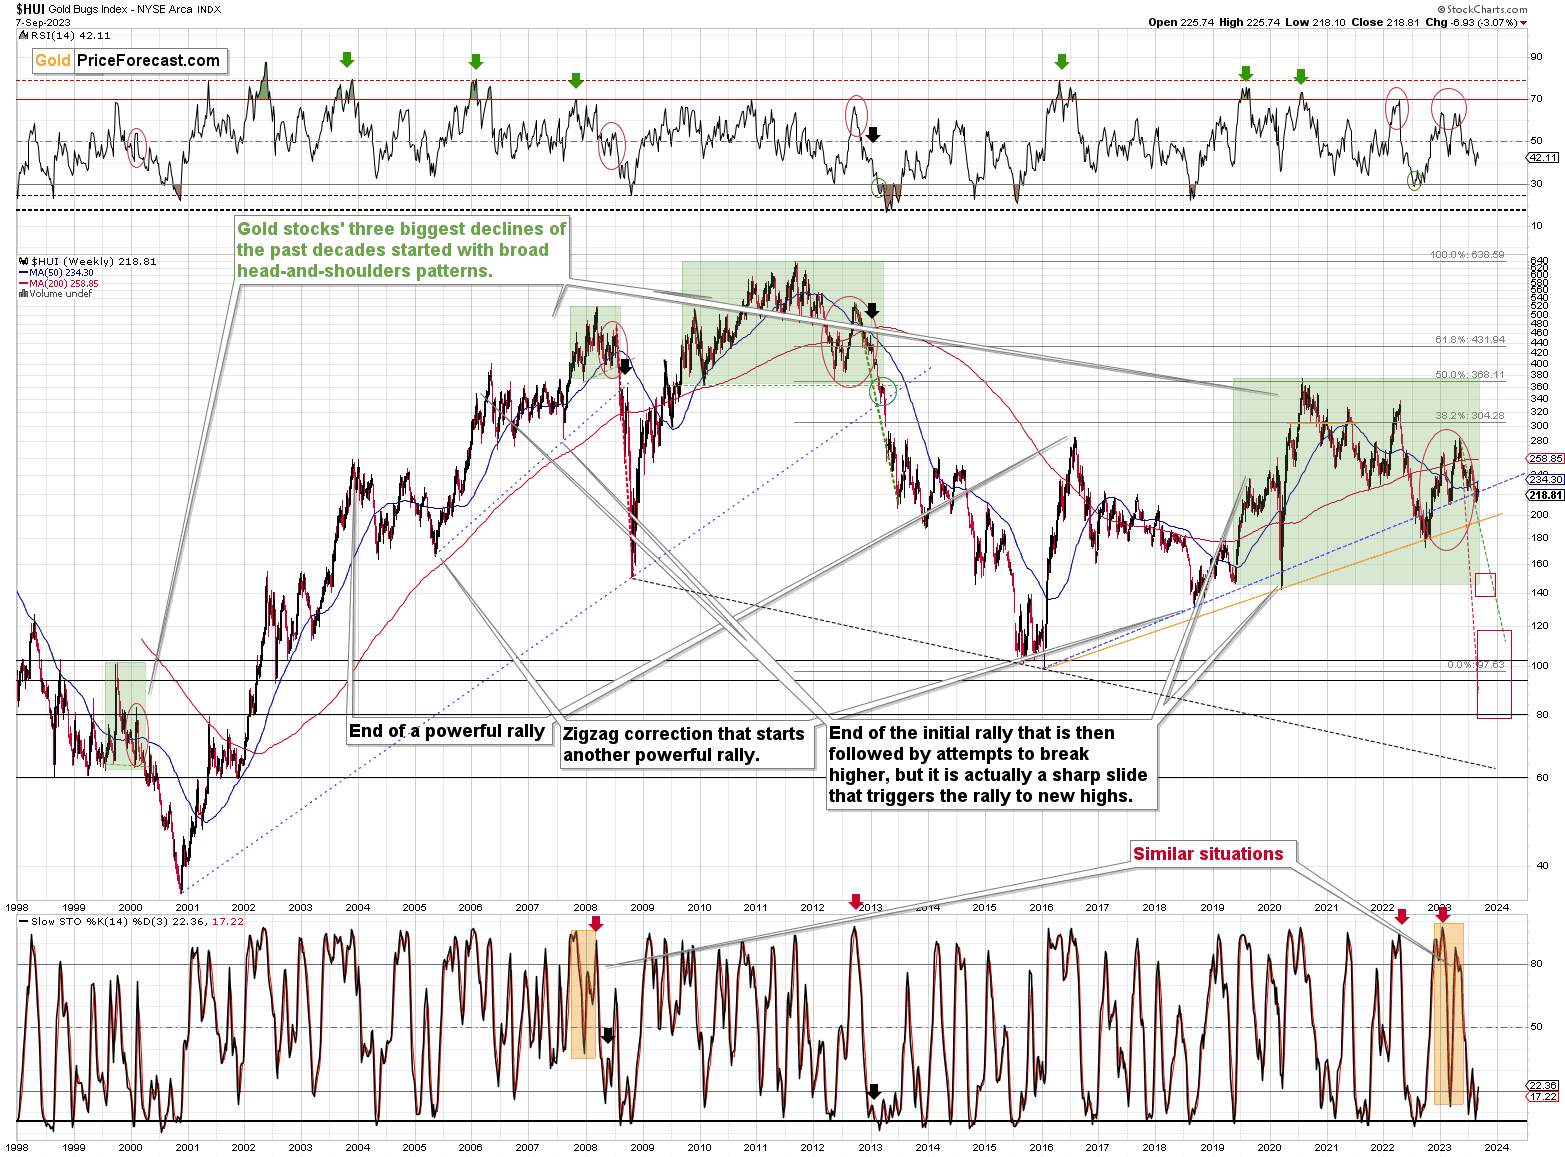
Also, let’s keep in mind that the recent weakness in mining stocks has profound implications from the long-term point of view.
With the rising, blue support line in the HUI Index being broken, the next huge slide appears to be already underway.
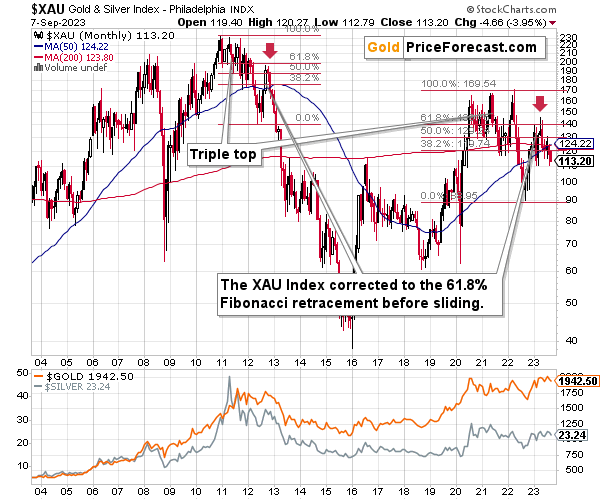
No wonder, the XAU Index is after its massive sell signal.
The invalidation of the small move above the 61.8% Fibonacci retracement that we saw earlier this year meant serious trouble, as it made the link to 2012 – 2013 obvious.
The implications have only begun to unfold – a much bigger decline appears to be just ahead.
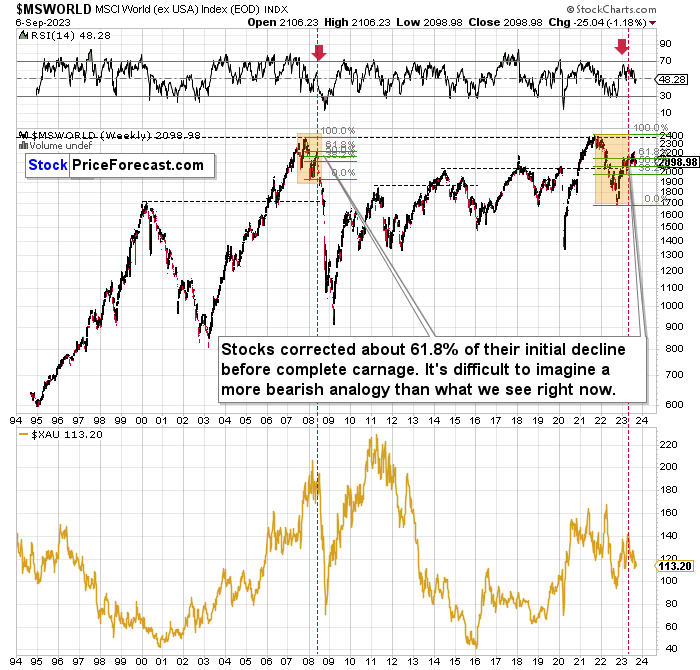
The same goes for world stocks – they behave just like they did in 2008, which means that mining stocks are likely to get a massive bearish push.
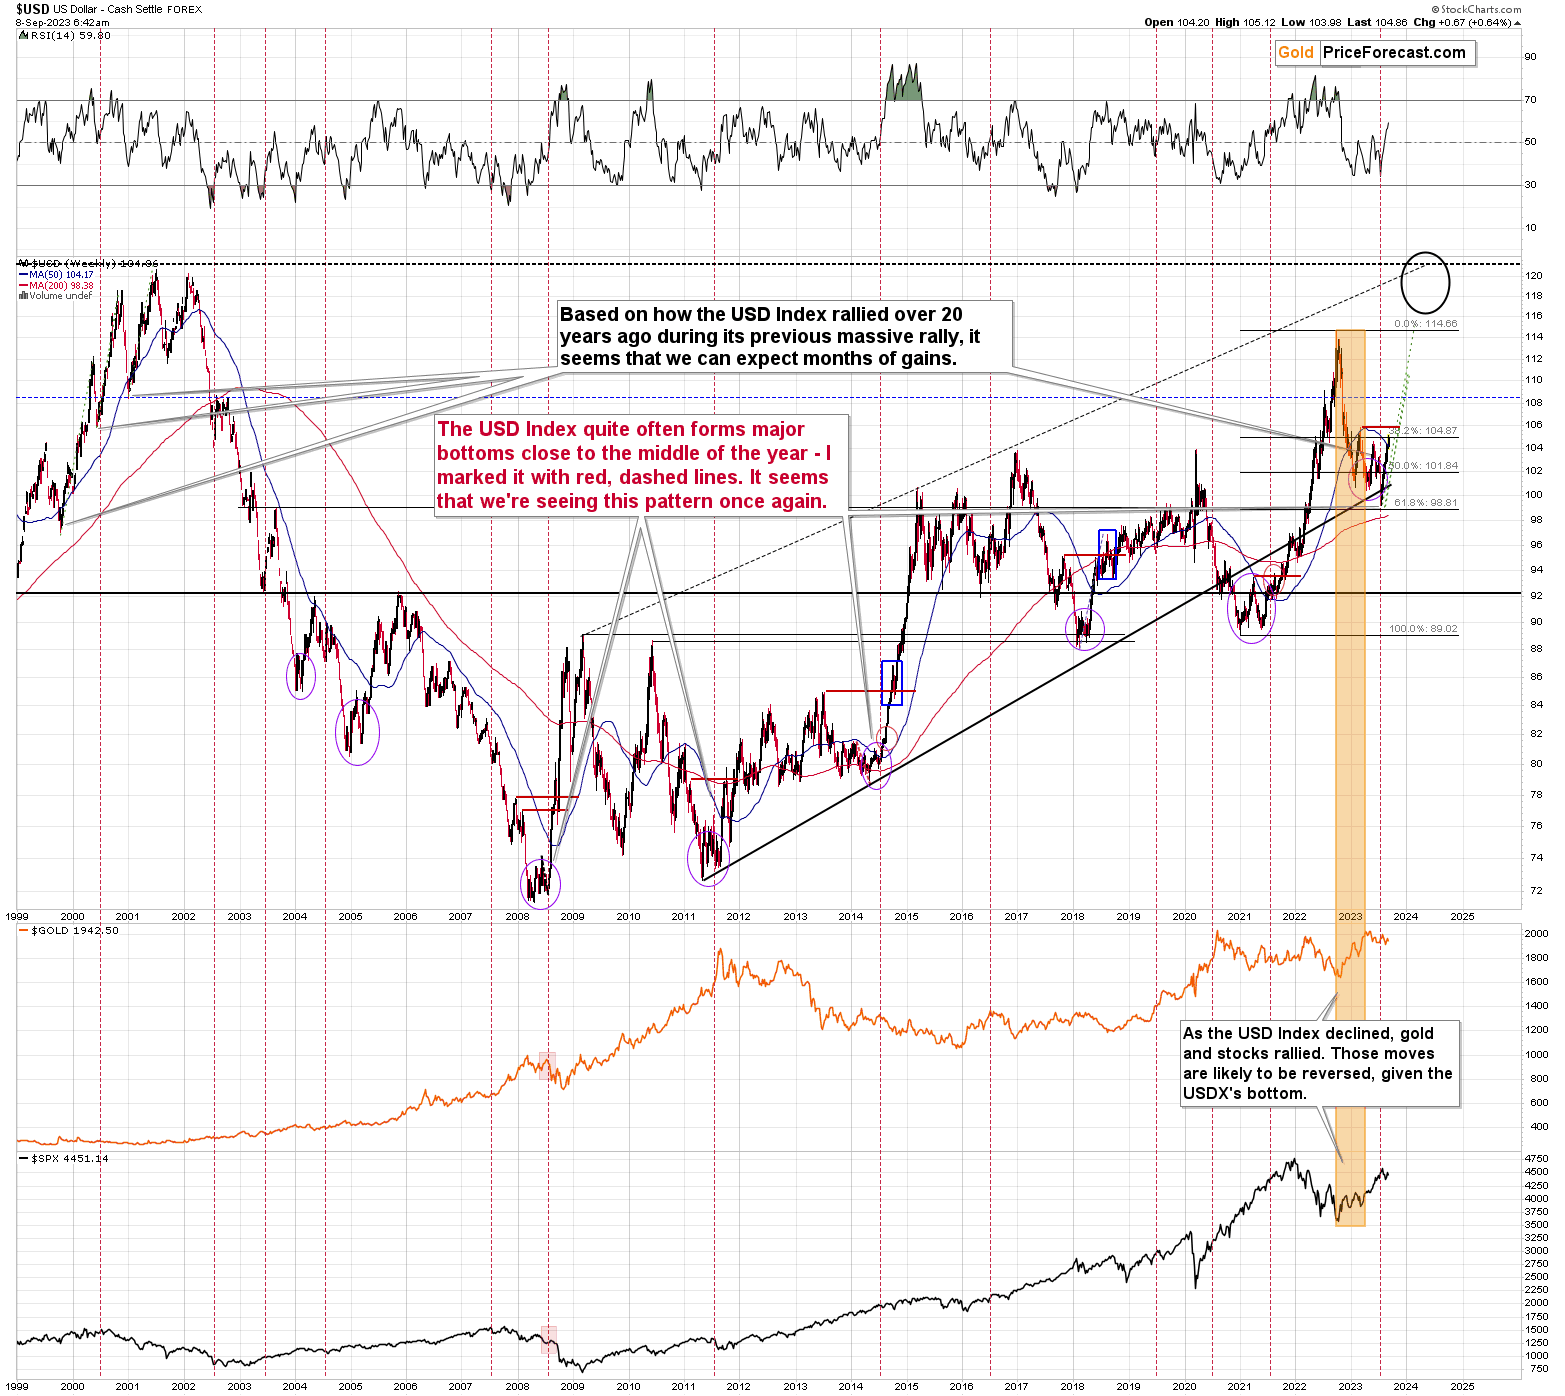
Also, while we’re in the very long-term timeframe, please note that the RSI based on the USD Index’s weekly candlesticks is not overbought. In fact, it just moved above the middle of its trading range. So, yes, we can – and are likely to see – a massive rally soon.
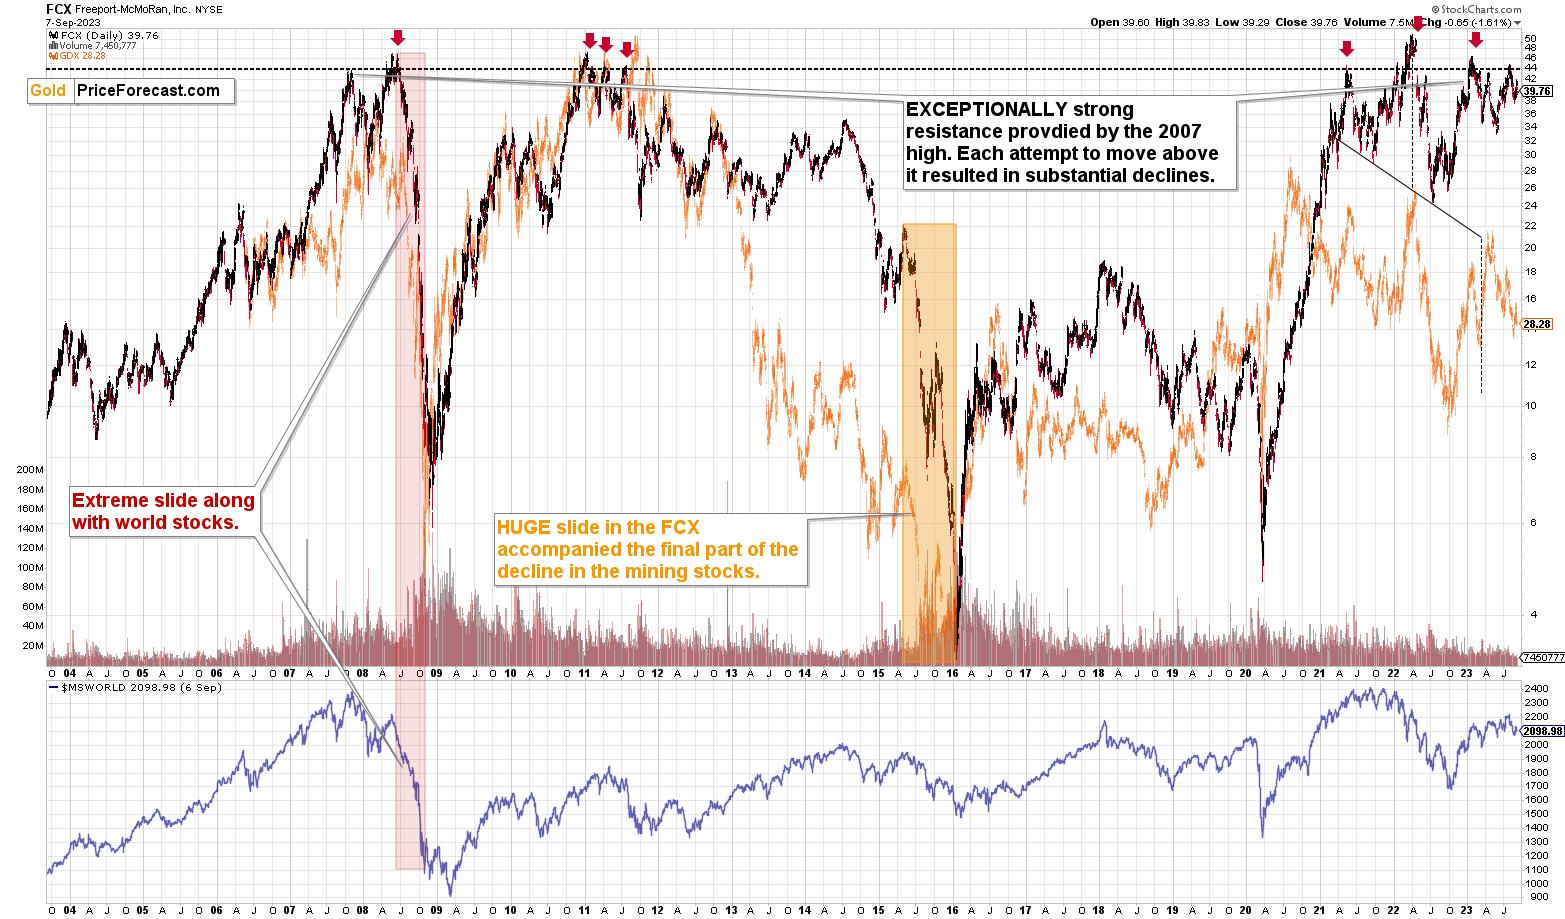
Finally, copper stocks, like FCX are likely to slide, too.
FCX just invalidated its attempt to move above its 2007 high and – just like in previous cases when the same happened – it’s now likely to slide.
What does it all mean? It means that the precious metals market is likely to slide, quite likely profoundly so, and junior mining stocks’ prices are likely to truly slide. While I can’t promise any specific rate of return, it seems to me that the profits on this decline are going to become astronomical.
===
If you’d like to participate in my Mastering Multidimensional Wealth | 1:1 Coaching Experience (perhaps by re-investing some of your profits into yourself), or become a partner/investor in Golden Meadow, you’ll find more details in the above links.
Overview of the Upcoming Part of the Decline
- It seems that the recent – and probably final – corrective upswing in the precious metals sector is over.
- If we see a situation where miners slide in a meaningful and volatile way while silver doesn’t (it just declines moderately), I plan to – once again – switch from short positions in miners to short positions in silver. At this time, it’s too early to say at what price levels this could take place and if we get this kind of opportunity at all.
- I plan to switch from the short positions in junior mining stocks or silver (whichever I’ll have at that moment) to long positions in junior mining stocks when gold / mining stocks move to their 2020 lows (approximately). While I’m probably not going to write about it at this stage yet, this is when some investors might consider getting back in with their long-term investing capital (or perhaps 1/3 or 1/2 thereof).
- I plan to return to short positions in junior mining stocks after a rebound – and the rebound could take gold from about $1,450 to about $1,550, and it could take the GDXJ from about $20 to about $24. In other words, I’m currently planning to go long when GDXJ is close to $20 (which might take place when gold is close to $1,450), and I’m planning to exit this long position and re-enter the short position once we see a corrective rally to $24 in the GDXJ (which might take place when gold is close to $1,550).
- I plan to exit all remaining short positions once gold shows substantial strength relative to the USD Index while the latter is still rallying. This may be the case with gold prices close to $1,400 and GDXJ close to $15 . This moment (when gold performs very strongly against the rallying USD and miners are strong relative to gold after its substantial decline) is likely to be the best entry point for long-term investments, in my view. This can also happen with gold close to $1,400, but at the moment it’s too early to say with certainty.
- The above is based on the information available today, and it might change in the following days/weeks.
You will find my general overview of the outlook for gold on the chart below:
Please note that the above timing details are relatively broad and “for general overview only” – so that you know more or less what I think and how volatile I think the moves are likely to be – on an approximate basis. These time targets are not binding nor clear enough for me to think that they should be used for purchasing options, warrants, or similar instruments.
Letters to the Editor
Please post your questions in the comments feed below the articles, if they are about issues raised within the article (or in the recent issues). If they are about other, more universal matters, I encourage you to use the Ask the Community space (I’m also part of the community), so that more people can contribute to the reply and enjoy the answers. Of course, let’s keep the target-related discussions in the premium space (where you’re reading this).
Summary
To summarize, the medium-term trend in the precious metals sector remains clearly down, and it seems that the corrective upswing is already over and the profits on our current short position are going to increase. We just caught the 10th profitable trade in a row – congratulations. The outlook for the short positions in junior miners and in the FCX remains very favorable.
To summarize:
Short-term outlook for the precious metals sector (our opinion on the next 1-6 weeks): Bearish
Medium-term outlook for the precious metals sector (our opinion for the period between 1.5 and 6 months): Bearish initially, then possibly Bullish
Long-term outlook for the precious metals sector (our opinion for the period between 6 and 24 months from now): Bullish
Very long-term outlook for the precious metals sector (our opinion for the period starting 2 years from now): Bullish
As a reminder, Gold Investment Updates are posted approximately once per week. We are usually posting them on Monday, but we can’t promise that it will be the case each week.
Our preferred ways to invest in and to trade gold along with the reasoning can be found in the how to buy gold section. Additionally, our preferred ETFs and ETNs can be found in our Gold & Silver ETF Ranking.
Moreover, Gold & Silver Trading Alerts are posted before or on each trading day (we usually post them before the opening bell, but we don’t promise doing that each day). If there’s anything urgent, we will send you an additional small alert before posting the main one.
Thank you.
Przemyslaw K. Radomski, CFA
Founder, Editor-in-chief


