

Briefly: gold and the rest of the precious metals market are likely to decline in the next several weeks/months and then start another powerful rally. Gold’s strong bullish reversal/rally despite the USD Index’s continuous strength will likely be the signal confirming that the bottom is in.
Welcome to this week's Gold Investment Update.
Predicated on last week’s price moves, our most recently featured medium-term outlook remains the same as the price moves align with our expectations (and we remain on a streak of 11 realized – unleveraged – trades). On that account, there are parts of the previous analysis that didn’t change at all in the earlier days and are written in italics.
Every now and then, the market behaves in a way that’s surprising. That’s what markets do. If this wasn’t the case, one would always be able to tell what’s definitely going to happen instead of what’s probable. The “probable” word implies that every now and then, something other than what’s likely will happen.
This week, the precious metals market moved higher; even though the main trend is down, especially in silver and mining stocks, the entire precious metals market moved higher. Why? The Fed spoke about lowering rates by 0.75% in 2024, so the market’s expectations toward interest rates changed.
Even though it’s not really justified, the markets cheered the Fed’s decision. After all, in the very short-term the markets tend to be emotional, and the default interpretation prevailed: expectations of lower credit cost is good for business.
Why wouldn’t it be justified? Well, we commented on that last week, and this part of the analysis remains very much up-to-date:
Debunking Rate-Cut Optimism
The recent narrative uplifting stocks and the PMs is the belief that a pivot is bullish. Conversely, pivots are not bullish, and risk assets often crash when they realize why rate cuts are occurring.
Please see below:
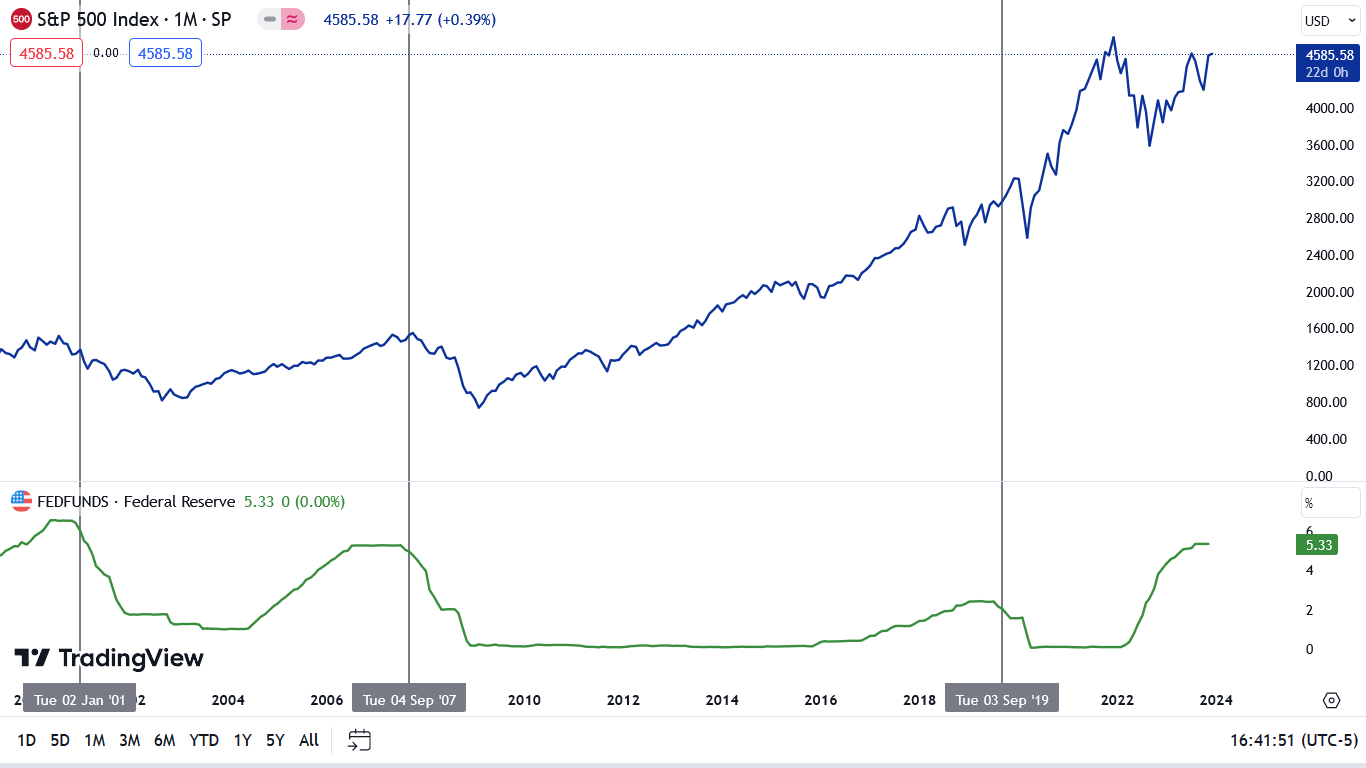
To explain, the blue line above tracks the S&P 500, while the green line tracks the federal funds rate (FFR). If you analyze the horizontal gray lines, you can see that the last three times the Fed cut the FFR, the S&P 500 was already sinking or was approaching a cliff.
Therefore, while it may seem like new highs are inevitable for all assets, the recent optimism is more of a ‘buy the rumor, sell the news’ type trade. In other words, investors will likely bail on the S&P 500 and the GDXJ ETF when the Fed actually cuts rates. To that point, with oil prices resuming their crash, it’s a bad look for global growth when crude oil falls below $70.
Overall, the fundamentals continue to unfold as expected, with higher rates weighing heavily on the U.S. economy. And while the ‘bad news is good news’ trade remains intact, history shows it should end with sharp drawdowns of the S&P 500 and the GDXJ ETF, and a meaningful rise in the USD Index.
Later, I added:
Again, the immediate-term reaction is one thing, as people reacted emotionally to more dovish approach. We also saw an immediate-term rally in 2019, but then a decline materialized, anyway.
So, no, the current move higher doesn’t change the outlook. The big move is still likely to be to the downside. I know that it might be difficult to think so while gold jumped over $30, but this really is the case. Remember how difficult it was to doubt gold’s breakout to new highs? On Dec 4, 2023, I wrote that the breakout is likely to be invalidated and followed by a massive slide. I started that day’s analysis with the following sentence:
“During sharp rallies, it’s nearly impossible to convince investors that this move is about to end. And yet, that’s exactly what is likely.”
That was the top.
And this sentence applies also today. The breakdown below the rising support line in gold was not invalidated and the next big move is likely to be to the downside.
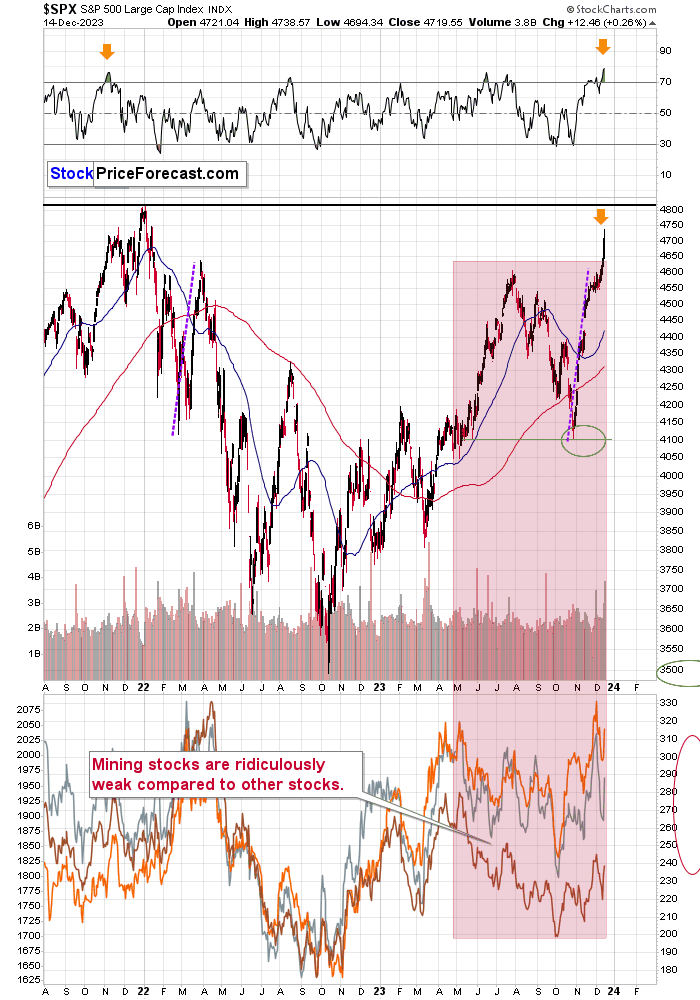
The S&P 500 Index moved much higher recently, and based on the RSI indicator, it’s most overbought in years. This suggests that the stock market is not likely to break to new highs now. It’s likely to reverse its course, and decline, just like it did from similar price levels in early 2022. Perhaps Paul Rejczak will take profits from his long positions in stocks in this area.
Anyway, yesterday’s small reversal might indicate that the top is already in.
Let’s keep in mind how weak mining stocks have been relative to the stock market in the previous months – the red rectangle shows how far stocks rallied and how far miners declined despite that. This means that once stocks decline, miners are likely to truly slide.
Speaking of stocks, please note that the situation in world stocks hasn’t really improved recently.
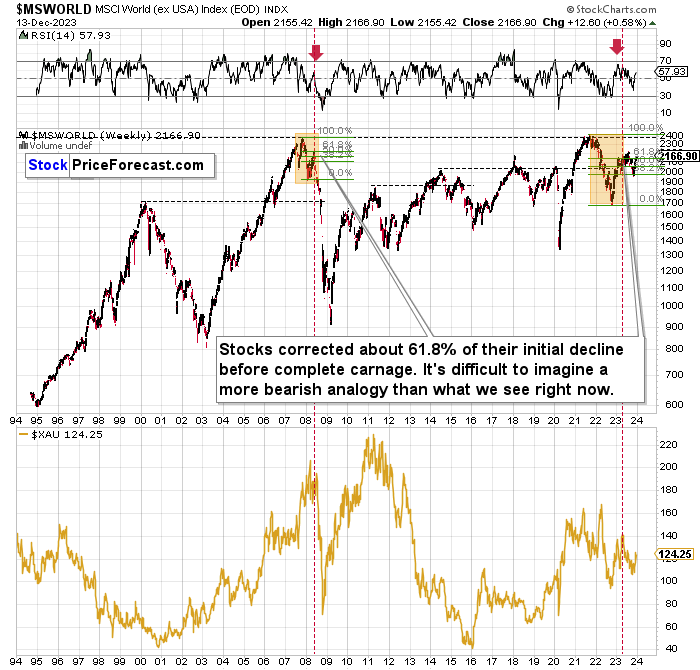
The situation continues to be very similar to what we saw in 2008, with the main difference being that now the initial decline was bigger. Because of that, it’s no wonder that the corrective upswing is also bigger, and it takes longer.
In both cases, world stocks corrected to approximately 61.8% Fibonacci retracement, and they declined thereafter. This time, there were two corrections to that level, which is not that odd, given that the initial decline was bigger this time.
The implications remain very bearish, not just for stocks, but also for mining stocks.
As you can see, miners (the XAU Index) suffered enormously in 2008 in the aftermath of the situation that’s so similar to the current one. Let’s take a closer look.
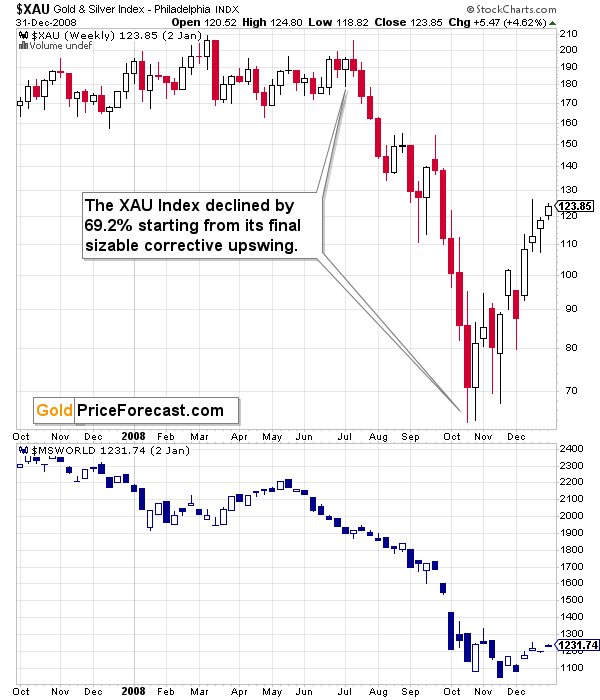
This analogy has very bearish implications for the following months.
And while we’re discussing stock market indices and their long-term charts, let’s not forget about the critical situation in the Toronto Stock Exchange Venture Index – one of the proxies for junior mining stocks.
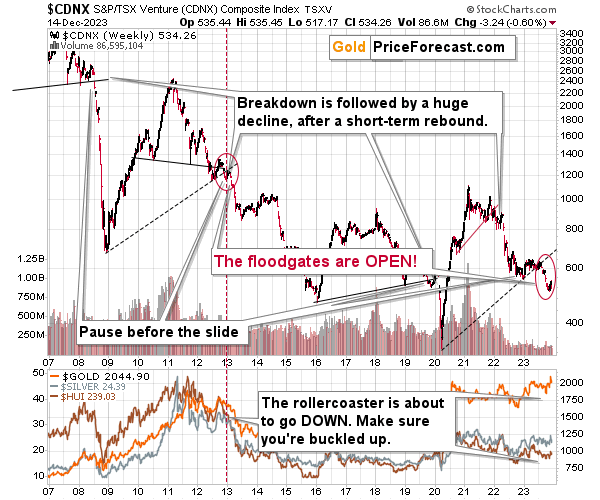
The TSXV is after a massive breakdown below the rising support line, that’s analogous to the one that we saw in early 2013 – and, to a smaller extent, to the one seen in 2008.
Now we see a pause in the decline, but given that the breakdown was already confirmed, the decline is likely to resume after the pause, and it’s likely to put a very bearish pressure on the precious metals and mining stock prices.
The long-term analogy to 2013 and 2008 is also present on a chart featuring a proxy for senior gold stocks – the HUI Index.
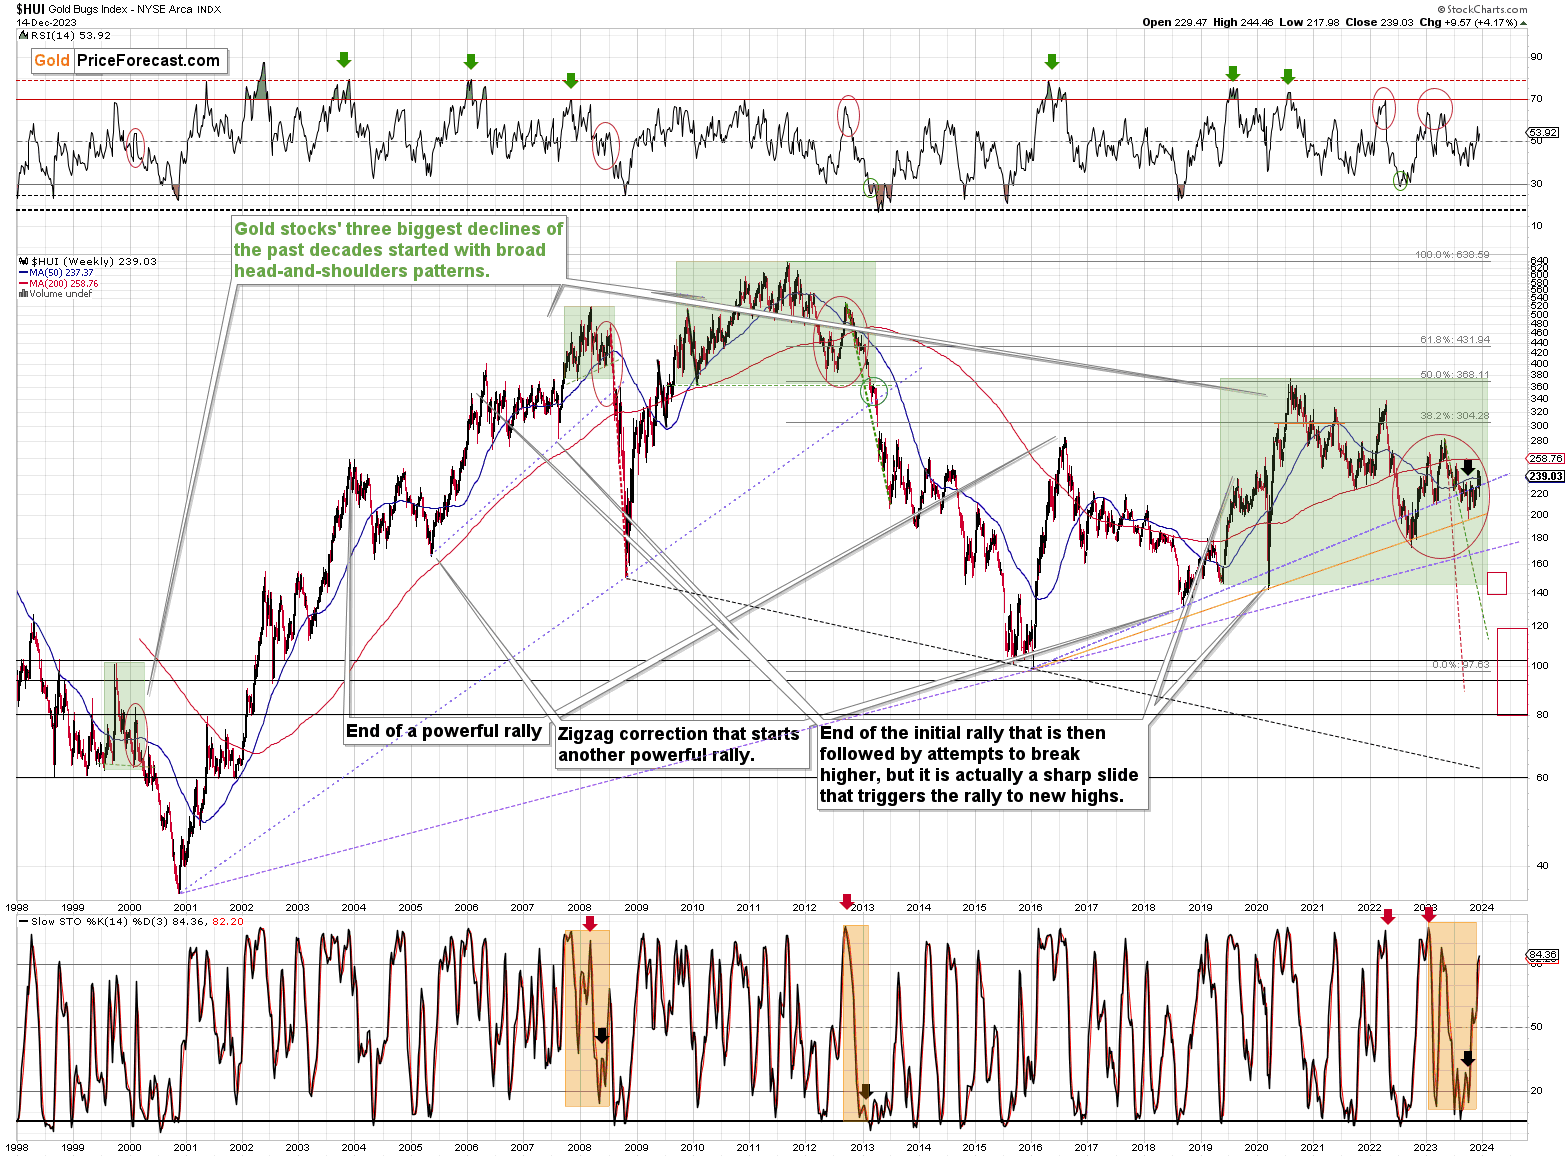
The huge declines in gold stocks tend to be preceded by broad head-and-shoulders patterns. I marked them with green rectangles.
Those patterns are not identical, but when they form, they tend to be relatively symmetrical. In the current pattern, the 2020 and 2022 bottoms appear symmetrical, and the 2020 decline is similar to the 2022-2023 rally. This means that the current rally might be a mirror image of the small, mid-2019 decline.
What preceded this mid-2019 decline was a big rally that started in 2018. If the mirror image continues, we can expect to see a big decline to – approximately – the 2022 lows (at least).
Zooming in, we see that the situation in mining stocks is very volatile on a short-term basis, but the medium-term downtrend remains intact and that the immediate-term rally might already be over.
In yesterday’s regular Gold Trading Alert, I wrote the following:
What’s next? While the next 1-3 days are a bit unclear, the entire roadmap that I featured for the GDXJ ETF in my previous Gold Trading Alert remains very much up-to-date.
In yesterday’s intraday Alert, I added:
The reason that I wrote about this lack of clarity regarding the today and the early part of next week is that sometimes it takes that extra time for the market’s emotional responses to cool down. We might have just seen the rally burning itself out.
I followed the above with the description of the reversal on the GLD ETF chart, and I’ll move to that shortly, but another reason supporting the above statement is miners’ reversal below their recent high. This suggests that the top might be in, in tune with the high-volume analogy that I covered previously:
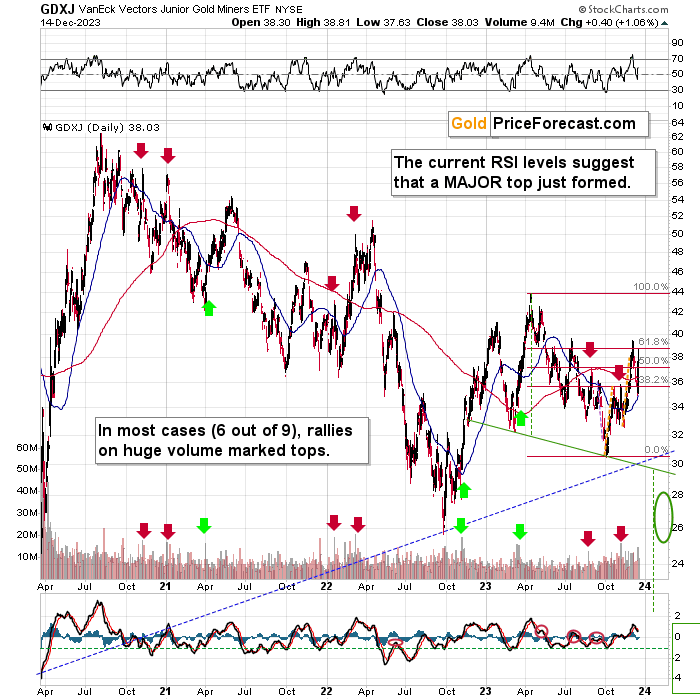
Junior miners – the GDXJ ETF – rallied sharply as well. They also did so on very strong volume.
In case of this ETF, the link between big-volume rallies and local tops is not as clear as it is in case of silver, but it’s still present. I marked the similar cases with arrows and in 6 out of 9 such cases, big-volume rallies marked local tops, or those tops followed very soon. Only in 3 out of 9 cases, big rallies followed.
Interestingly, all those three bullish cases were preceded by declines that were much bigger than what we saw recently. This suggests that the bullish analogies are not the correct ones. The bearish ones are.
What’s next? While the next 1-3 days are a bit unclear, the entire roadmap that I featured for the GDXJ ETF in my previous Gold Trading Alert remains very much up-to-date.
The markets usually don’t move up or down in a straight line, so some kind of correction is likely to take place in the future, anyway. The question is from what price levels.
My best candidate for the first correction (based on the data that I have available right now) is The $30.5 - $32 range, which is based on the previous lows. I don’t expect a huge rally from those levels, though. Perhaps a move from $30.5 to $32, and then the decline would continue.
The next target is more important. After breaking to new 2023 lows, the move to the 2022 low (close to $26) becomes a good possibility – I marked this area with a green ellipse.
Once this level is reached, I then expect the GDXJ to correct in a more visible manner. After all, at that point, it will be after important breakdowns:
- Below the rising blue support line
- Below the previous 2023 low
- Below the green support line
Consequently, a verification of those breakdowns by a move back to them, would be quite normal. This means a move back to $29 - $30. Then, after a successful verification of those breakdowns, I’d expect the GDXJ to slide lower – to the 2020 low or close to them – at about $20.
There’s also a good possibility of seeing a bottom at about $22, as that’s where we have a downside target based on the head-and-shoulders pattern that is most likely being formed right now. It could also be the case that the GDXJ slides to about $20 on an intraday basis only to recover and close the day at about $22. In a way, both targets would be reached in this case.
There are many IFs around the above-mentioned scenario, and the situation might (and it probably will) change as we go. Remaining open-minded and flexible regarding the new information is key, but having a roadmap is very useful, too, as it shows how things could develop on a more-or-less basis. This can help you prepare for those – or similar – price moves.
Looking at the GDXJ from a very short-term point of view, we see another reason for its price to move lower.
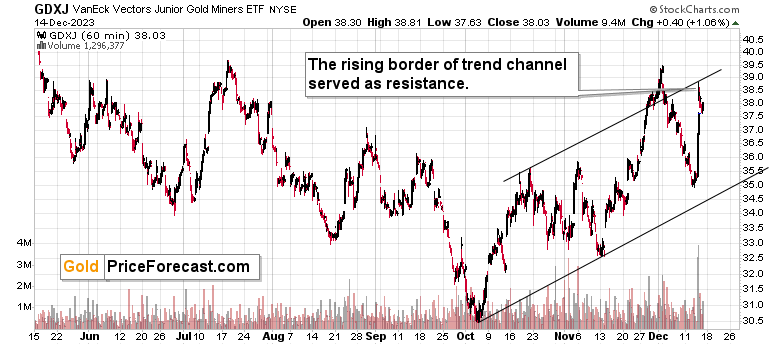
The upper border of the trend channel was reached, and the GDXJ reversed from there.
Based on the above chart alone, we’re likely to see a move lower, quite likely to $35 or so. However, based on many other charts, it’s likely that the move to $35 will be just the first step in a way to much lower levels.
After all, the indications from short-term charts are less important than ones from medium-term charts, which in turn are less important than ones from long-term charts.
Having said that, let’s take a look at the above-mentioned GLD ETF. Starting with a quote from yesterday’s intraday Alert:
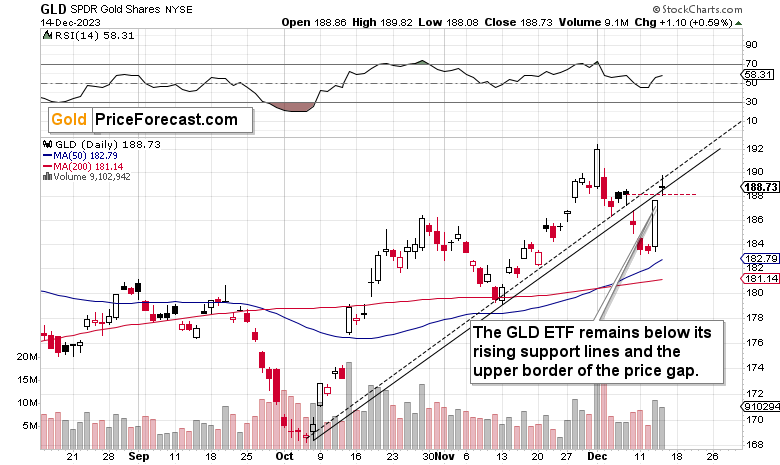
(…) the GLD ETF just moved to its upper rising resistance line and then moved back down.
As long as the GLD closes below this line, the breakdown’s bearish implications will remain intact.
Also, while GLD is up by 0.54%, SLV is up by 1.56%, and as you may know, when silver outperforms gold on a very short-term basis, it’s a sell signal.
Silver continued outperforming gold, and GLD didn’t move above its upper resistance line. Consequently, the recent price action appeared to be nothing more than a verification of the breakdown despite it being so volatile. The news that hit the market was important, so the size of the rally was also quite significant, and that’s quite normal. Either way, due to the reversal, it’s quite likely that the top is in or at hand.
As far as silver is concerned, then it’s an analogy to previous periods where it outperformed gold and it rallied on particularly strong volume remains up-to-date:
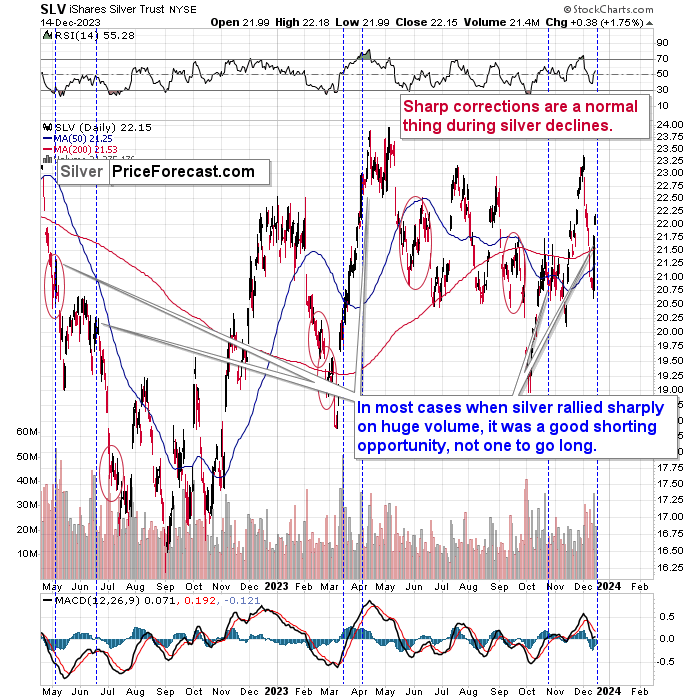
Silver soared by over 4% initially and then by almost 2% - and the rally was sharp. It took place on strong volume, so many traders – especially those new to the silver market – probably view this as a bullish sign.
In case of many other markets, a big rally on strong volume would indeed be a bullish sign. Silver is different, though.
The white metal is not only known for fake breakouts (and the last – failed – breakout above the January highs proves it once again), but it’s also known for fake rallies in the middle of big moves lower.
I marked similar rallies with red ellipses, and I marked huge-volume rallies with dashed lines.
As you can see, even the high-volume rallies turned out to be fake moves most of the time. So, was this week’s move higher in silver really bullish?
No, it wasn’t.
Besides, please note that the recent back-and-forth movement in silver is similar to what silver did in late 2012 and early 2013.
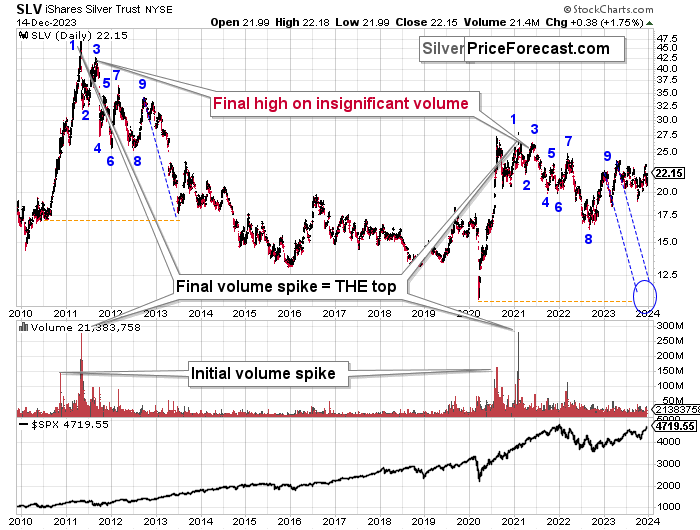
The final tops (2011, 2021) formed on huge volume, and that was preceded by an initial volume spike. Then, the SLV ETF declined in a back-and-forth manner, where we saw 9 bigger highs and lows. Then, after the final (9) top, silver declined in a back-and-forth manner in a smaller range.
We see the same thing right now. The current price movement is what preceded one of the biggest declines in silver’s recent history, so it’s difficult to view the recent performance as something bullish.
The analogy to 2011-2013 had very bearish implications for the following weeks and months, so the implications here are bearish, not bullish.
The USD Index moved to new short-term lows yesterday, and my comments from yesterday’s intraday Gold Trading Alert remain up-to-date:
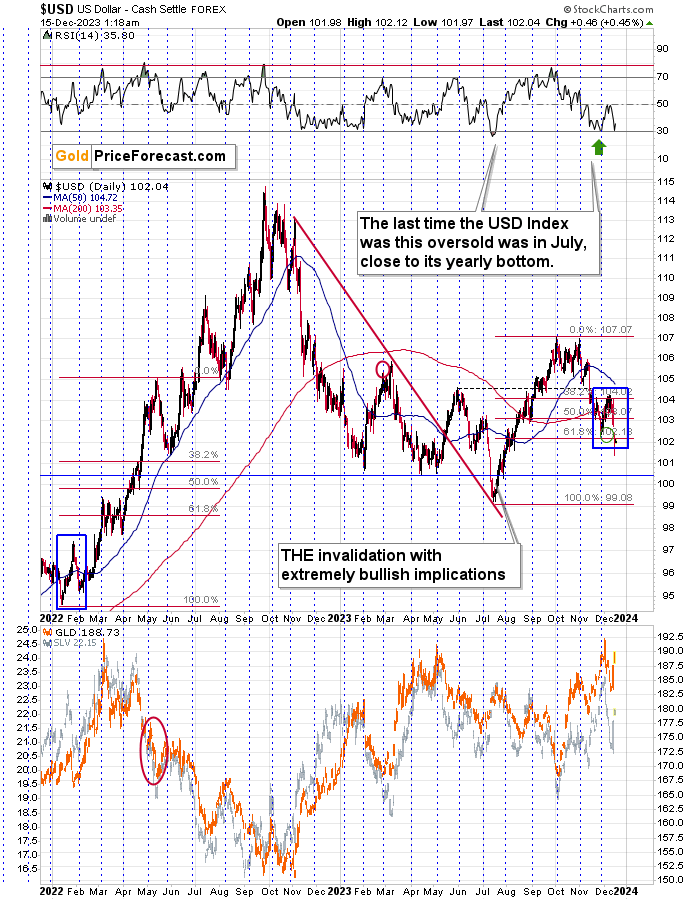
At the same time, gold, silver, and mining stocks are weak compared to signals coming from the USD Index. The latter just moved below its recent low and below its 61.8% Fibonacci retracement based on the 2023 rally, but gold, silver, and miners didn’t move to new highs.
Also, please note that the session is not over yet, and USDX’s breakdown is far from being confirmed. The previous attempt to break below the 61.8% Fibonacci retracement level failed, and the same is likely to happen now.
The USD Index did close the day below the 61.8% retracement, but two more daily closes would be needed to confirm the breakdown. For now, a rebound is still the most likely outcome, especially that the RSI just moved to 30 once again.
I recently wrote that RSI on its own might not be enough to trigger a rally, but in this case, we have other signals (e.g. the support provided by the 61.8% retracement and the previous low) that suggest a rebound, so it’s very likely to happen.
Also, if we look at USD Index’s greatest component, the EUR/USD exchange rate, we see that what happened recently is a part of a one big – and normal – bearish pattern.
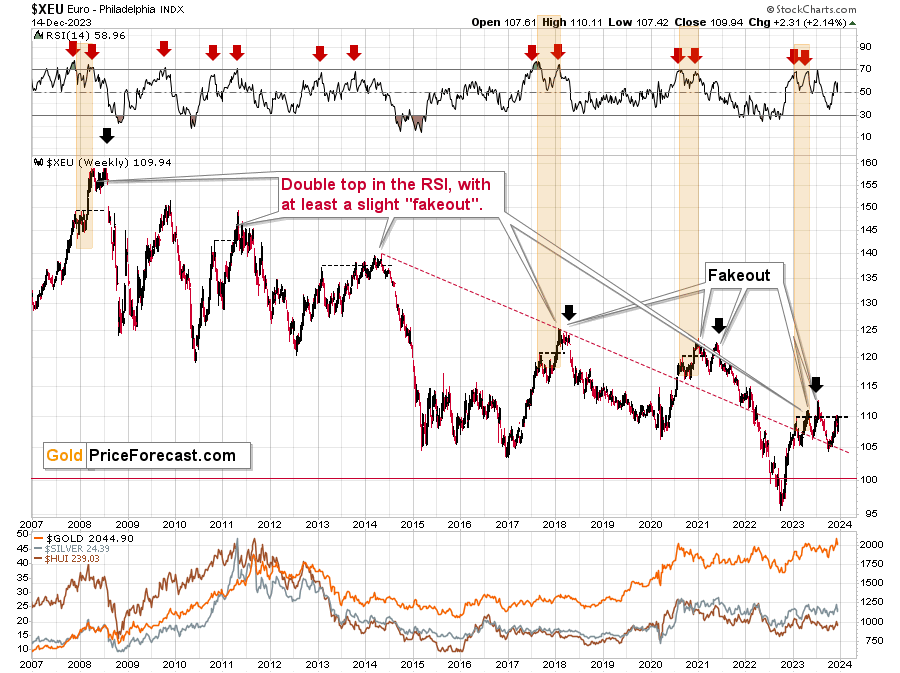
The European currency moved once again to its early-2023 top, thus likely creating a multi-top pattern. This has been a common way for the EUR/USD to top and I marked the previous cases on the above chart.
In 2008 and in 2011 there were sharp, final comebacks to this level before the decline continued. The one in 2014 was small, but it was still there, and the same goes for the one seen in 2021.
What might see chaotic or a game-changer from the short-term point of view, often becomes normal and orderly when looked at from a bigger perspective.
The situation in copper also confirms that a turnaround is here or just around the corner.
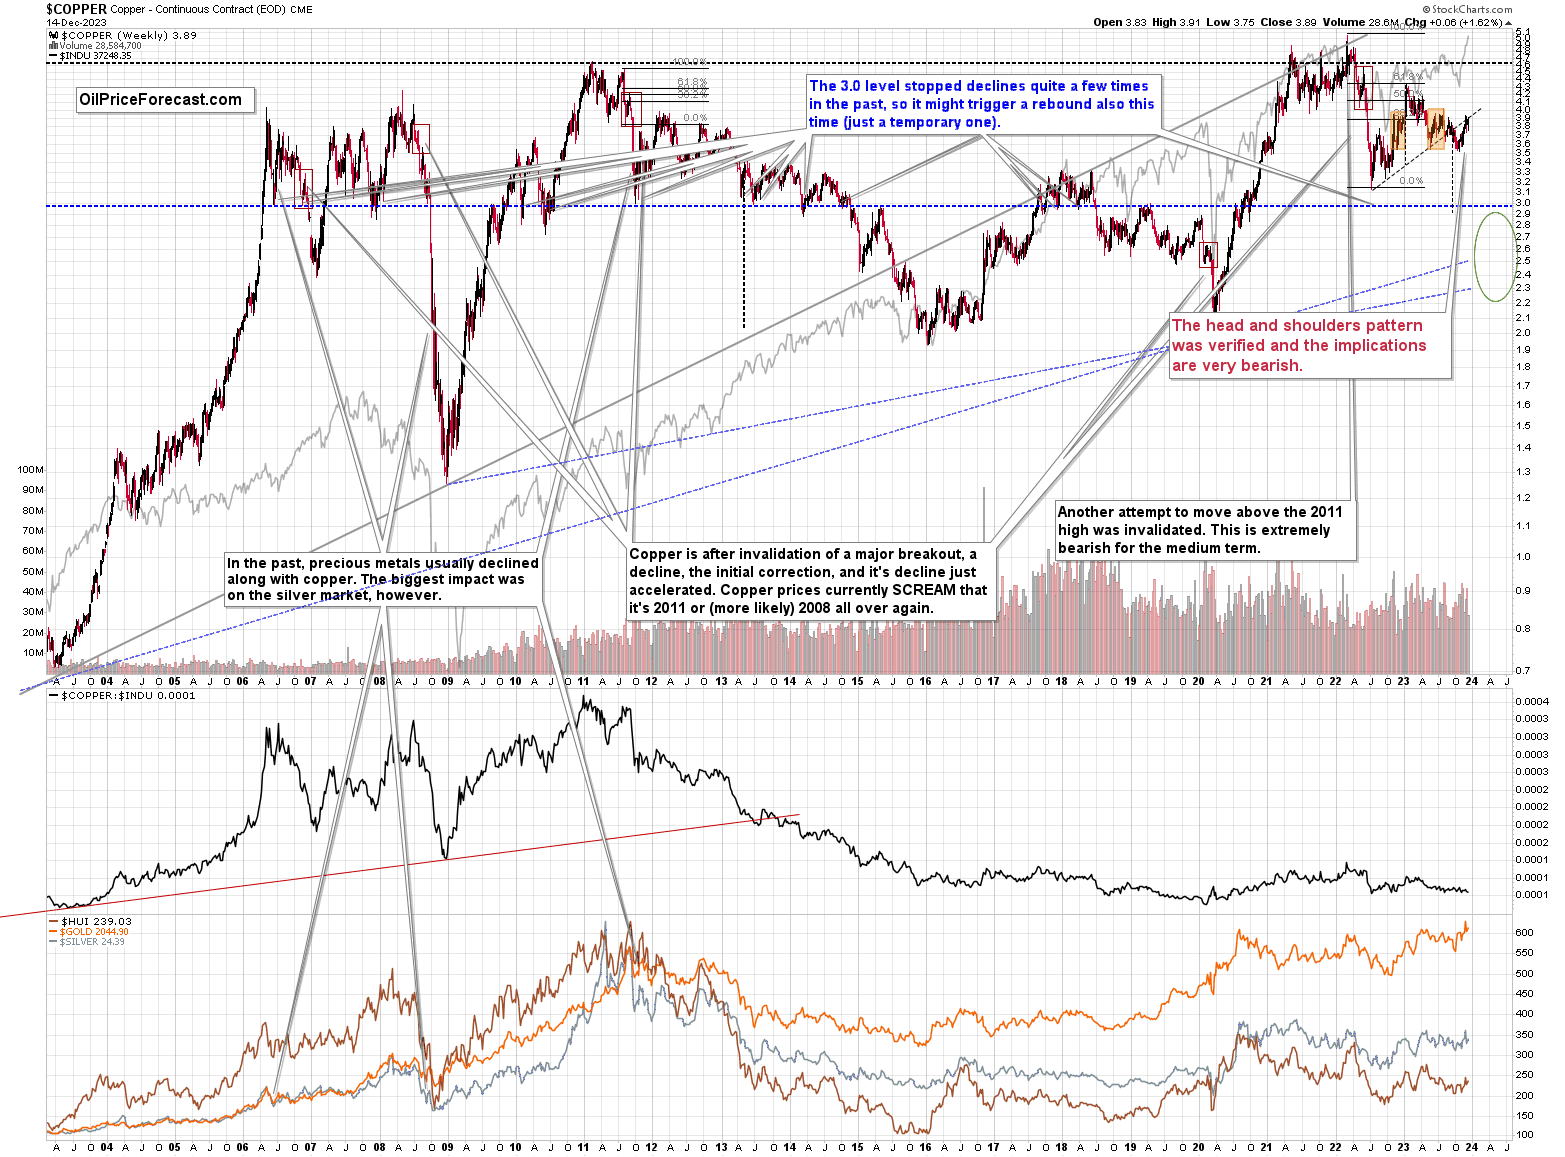
The recent rally was quite sharp, but it took copper back to its rising resistance line, which is also the neck level of the head-and-shoulders formation. A decline from here would be a natural consequence of the verification of the breakdown. The target based on the head-and-shoulders formation is below 3.0, and that’s where copper is likely heading, at least initially.
Naturally, the above would be likely to have a very negative impact on the prices of copper stocks, like FCX.
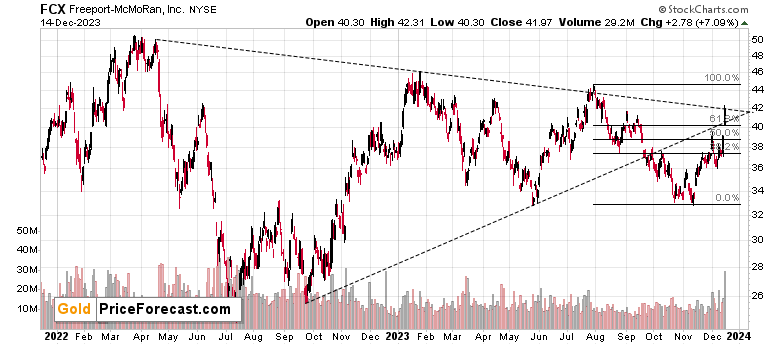
Right now, FCX moved to its declining resistance line based on the April 2022 and January 2023 highs, so it’s a good point from which it could move lower. And since the move higher was sharp, the move back down could be just as sharp, especially that FCX’s move above the rising resistance line was not confirmed (while the previous breakdown was).
Since the price target for copper is well below its current price, FCX is likely to fall far from the current levels as well.
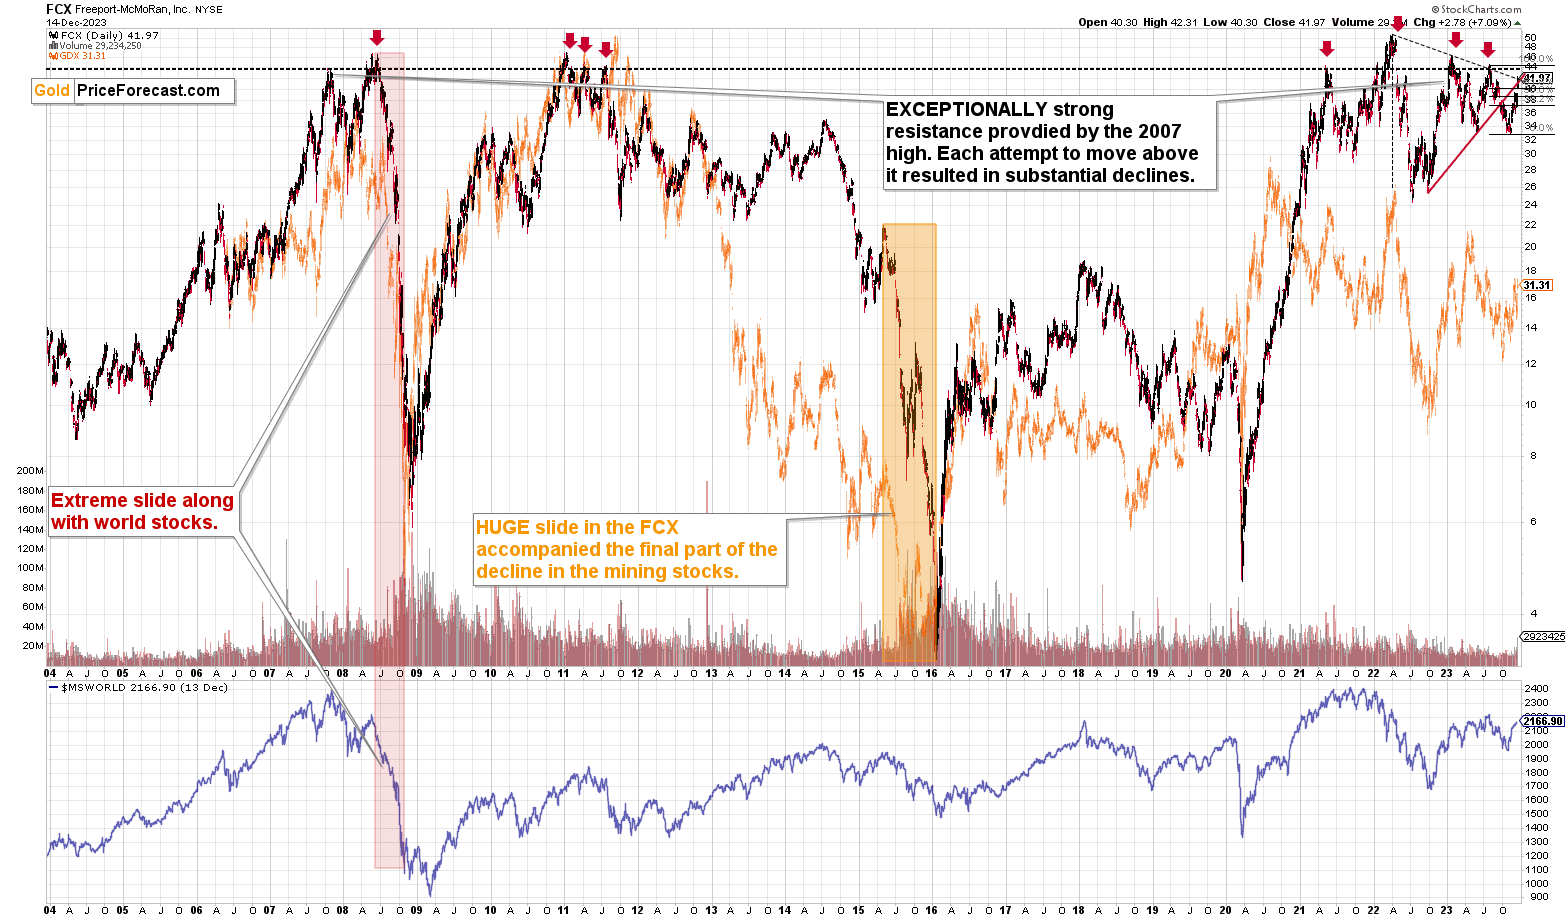
The declines from the current levels after failed breakouts above the 2007 high were big, and in some cases (in 2008) they were enormous. The downside potential is waaaay bigger than what you can see on FCX’s short-term chart.
What’s next? I already wrote the below roadmap earlier today, but it seems to be the best way to end today’s analysis, so here it is once again – yes, it does remain up-to-date despite this week’s quick run-up.
The markets usually don’t move up or down in a straight line, so some kind of correction is likely to take place in the future, anyway. The question is from what price levels.
My best candidate for the first correction (based on the data that I have available right now) is The $30.5 - $32 range, which is based on the previous lows. I don’t expect a huge rally from those levels, though. Perhaps a move from $30.5 to $32, and then the decline would continue.
The next target is more important. After breaking to new 2023 lows, the move to the 2022 low (close to $26) becomes a good possibility – I marked this area with a green ellipse.
Once this level is reached, I then expect the GDXJ to correct in a more visible manner. After all, at that point, it will be after important breakdowns:
- Below the rising blue support line
- Below the previous 2023 low
- Below the green support line
Consequently, a verification of those breakdowns by a move back to them, would be quite normal. This means a move back to $29 - $30. Then, after a successful verification of those breakdowns, I’d expect the GDXJ to slide lower – to the 2020 low or close to them – at about $20.
There’s also a good possibility of seeing a bottom at about $22, as that’s where we have a downside target based on the head-and-shoulders pattern that is most likely being formed right now. It could also be the case that the GDXJ slides to about $20 on an intraday basis only to recover and close the day at about $22. In a way, both targets would be reached in this case.
There are many IFs around the above-mentioned scenario, and the situation might (and it probably will) change as we go. Remaining open-minded and flexible regarding the new information is key, but having a roadmap is very useful, too, as it shows how things could develop on a more-or-less basis. This can help you prepare for those – or similar – price moves.
Again, as always, I’ll keep you – my subscribers – updated.
= = =
If you’d like to become a partner/investor in Golden Meadow, you’ll find more details in the above link.
Overview of the Upcoming Part of the Decline
- It seems that the recent – and probably final – corrective upswing in the precious metals sector is over.
- If we see a situation where miners slide in a meaningful and volatile way while silver doesn’t (it just declines moderately), I plan to – once again – switch from short positions in miners to short positions in silver. At this time, it’s too early to say at what price levels this could take place and if we get this kind of opportunity at all.
- I plan to switch from the short positions in junior mining stocks or silver (whichever I’ll have at that moment) to long positions in junior mining stocks when gold / mining stocks move to their 2020 lows (approximately). While I’m probably not going to write about it at this stage yet, this is when some investors might consider getting back in with their long-term investing capital (or perhaps 1/3 or 1/2 thereof).
- I plan to return to short positions in junior mining stocks after a rebound – and the rebound could take gold from about $1,450 to about $1,550, and it could take the GDXJ from about $20 to about $24. In other words, I’m currently planning to go long when GDXJ is close to $20 (which might take place when gold is close to $1,450), and I’m planning to exit this long position and re-enter the short position once we see a corrective rally to $24 in the GDXJ (which might take place when gold is close to $1,550).
- I plan to exit all remaining short positions once gold shows substantial strength relative to the USD Index while the latter is still rallying. This may be the case with gold prices close to $1,400 and GDXJ close to $15 . This moment (when gold performs very strongly against the rallying USD and miners are strong relative to gold after its substantial decline) is likely to be the best entry point for long-term investments, in my view. This can also happen with gold close to $1,400, but at the moment it’s too early to say with certainty.
- The above is based on the information available today, and it might change in the following days/weeks.
You will find my general overview of the outlook for gold on the chart below:
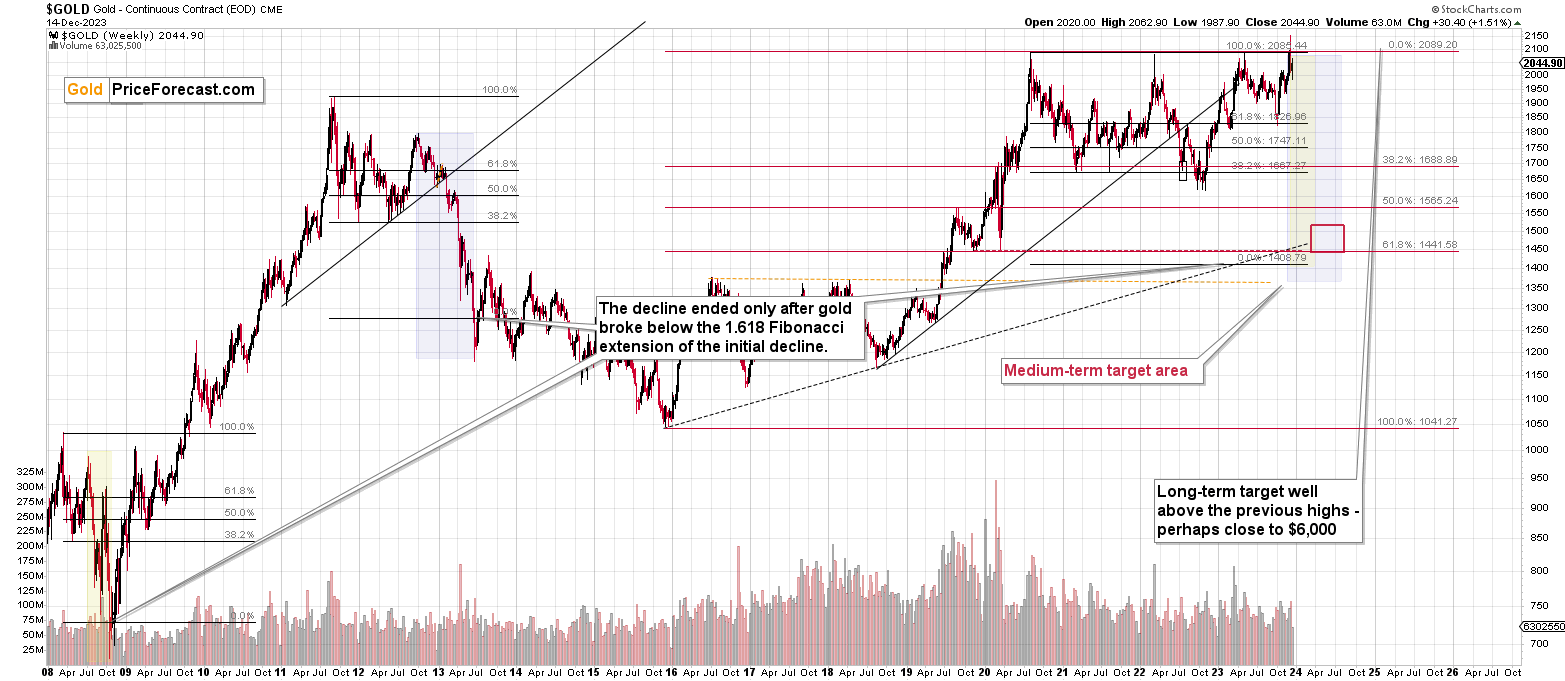
Please note that the above timing details are relatively broad and “for general overview only” – so that you know more or less what I think and how volatile I think the moves are likely to be – on an approximate basis. These time targets are not binding nor clear enough for me to think that they should be used for purchasing options, warrants, or similar instruments.
Letters to the Editor
Please post your questions in the comments feed below the articles if they are about issues raised within the article (or in the recent issues). If they are about other, more universal matters, I encourage you to use the Ask the Community space (I’m also part of the community) so that more people can contribute to the reply and enjoy the answers. Of course, let’s keep the target-related discussions in the premium space (where you’re reading this).
Summary
To summarize, the medium-term trend in the precious metals sector remains clearly down and given that the fear has most likely peaked, and the current technical indications point to lower precious metals prices, it seems that we won’t have to wait for much lower prices for long. The same goes for the FCX stock price.
To summarize:
Short-term outlook for the precious metals sector (our opinion on the next 1-6 weeks): Bearish
Medium-term outlook for the precious metals sector (our opinion for the period between 1.5 and 6 months): Bearish initially, then possibly Bullish
Long-term outlook for the precious metals sector (our opinion for the period between 6 and 24 months from now): Bullish
Very long-term outlook for the precious metals sector (our opinion for the period starting 2 years from now): Bullish
As a reminder, Gold Investment Updates are posted approximately once per week. We are usually posting them on Monday, but we can’t promise that it will be the case each week.
Our preferred ways to invest in and to trade gold along with the reasoning can be found in the how to buy gold section. Additionally, our preferred ETFs and ETNs can be found in our Gold & Silver ETF Ranking.
Moreover, Gold & Silver Trading Alerts are posted before or on each trading day (we usually post them before the opening bell, but we don’t promise doing that each day). If there’s anything urgent, we will send you an additional small alert before posting the main one.
Thank you.
Przemyslaw K. Radomski, CFA
Founder, Editor-in-chief

