

Briefly: gold and the rest of the precious metals market are likely to decline in the next several weeks/months and then start another powerful rally. Gold’s strong bullish reversal/rally despite the USD Index’s continuous strength will likely be the signal confirming that the bottom is in.
NOTE TO READERS:
Dear Subscribers,
Due to PR’s travel schedule, there will be no regular weekly Gold Investment Update this Friday (July 22). Therefore, as subscribers, today and tomorrow you will receive Gold & Silver Trading Alerts as compensation. However, we must mention that due to the Author's unavailability, they will only consist of fundamental parts.
Stay tuned!
Welcome to Gold Investment Update. Predicated on last week’s price moves,
our most recently featured outlook remains the same as the price moves align with our
expectations. On that account, there are parts of the previous analysis that didn’t change at all
in the earlier days, which will be written in italics.
Introduction
The PMs were stuck in the red on Jul. 20, as gold declined by 0.61%, silver by 0.24%, the GDX ETF by 2.92% and the GDXJ ETF by 2.54%. Moreover, the USD Index rallied by 0.38%. However, with the former being oversold and the latter now the most crowded trade on Wall Street, a reversal of fortunes should occur in the coming days.
Rotation Ripples
With the GDXJ ETF underperforming the general stock market on Jul. 20, the PMs didn’t rally alongside other risk assets. However, with investors’ daily recalibrations likely to reverse in the near future, more upside should confront the PMs in the days ahead.
Please see below:
 Source: Fidelity
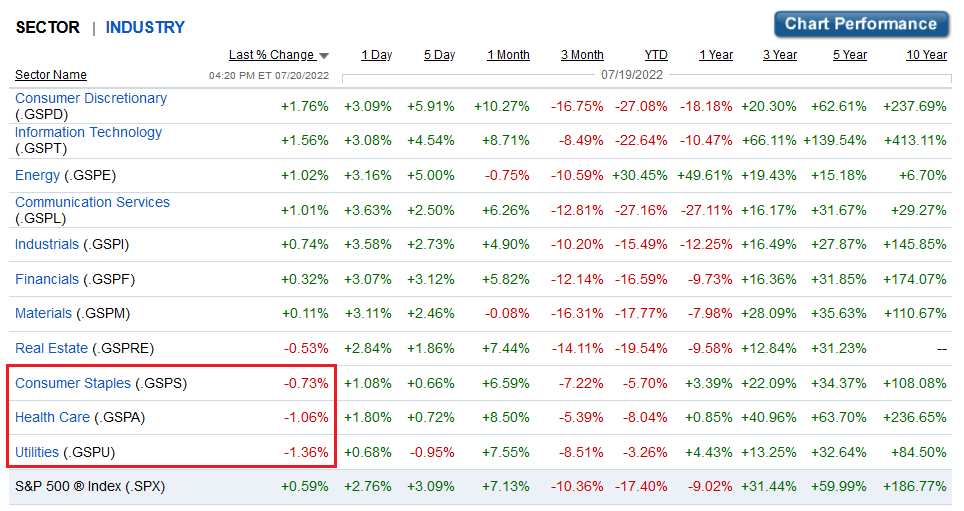
To explain, the bottom row highlights how the S&P 500 rallied by 0.59% on Jul. 20. However, utilities, health care, and consumer staples closed in the red and were the worst-performing sectors. Therefore, while all three are risk assets, they’re considered defensive risk assets; and with earnings optimism pushing investors into high beta risk assets like technology and consumer discretionary, they rotated out of low volatility sectors and into high volatility sectors.
As a result, the PMs suffered from this rotation as gold is also considered a defensive risk asset. However, with the worst performers on one day often the best performers on the next, the PMs should benefit in the days ahead.
Likewise, I’ve noted how oversold conditions support a short-term rally for the GDXJ ETF. Moreover, with fund flows emphasizing the technical conclusions, it’s important to remember that too much bearishness is often bullish.
Please see below:
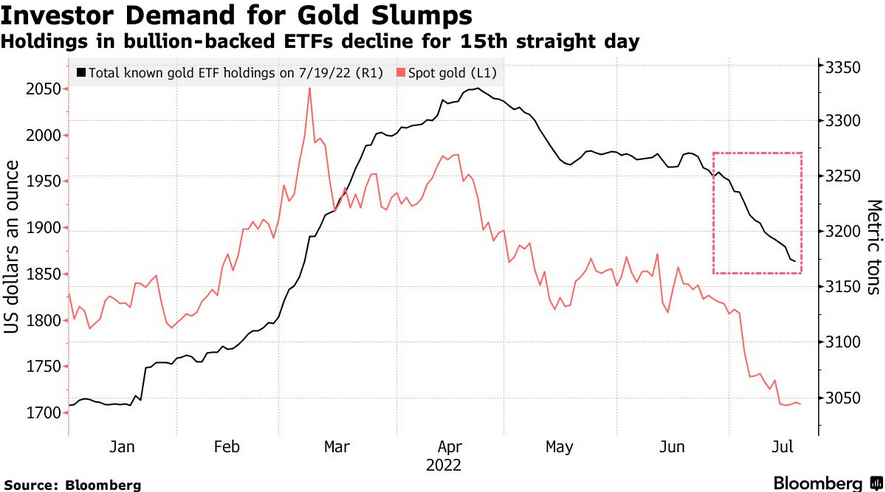
To explain, the red line above tracks the spot gold price, while the black line above tracks gold-backed ETF holdings as of Jul. 19. If you analyze the right side of the chart, you can see that gold-backed ETFs have suffered 15-straight days of outflows. Moreover, with the PMs declining on Jul. 20, the tally is likely at 16 days.
Furthermore, Suki Cooper, a precious metals analyst at Standard Chartered Plc, said: “There’s actually scope for a relief rally coming up to the July FOMC meeting where we can see a little bit of a bounce and perhaps prices heading back toward $1,750 in the near term.” As such, with the next FOMC meeting scheduled for Jul. 26-27, a reversal should materialize sooner rather than later.
To that point, while I’ve noted that too many bears expecting drawdowns is bullish for the S&P 500, and therefore, the GDXJ ETF, data from Vanda Research signals more room to run for the S&P 500’s relief rally.
Please see below:
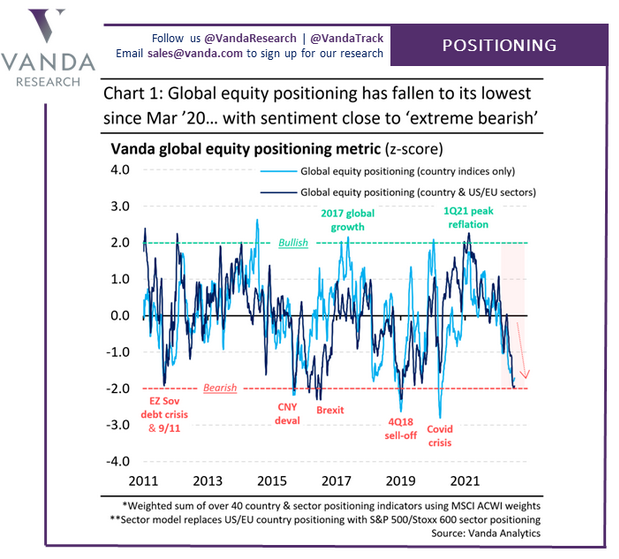
To explain, the light and dark blue lines above track investors’ global equity positioning at the country and country plus U.S/Eurozone sector level. If you analyze the right side of the chart, you can see that the lines are near or at two standard deviations below the average. Furthermore, while positioning can still move lower, we’re in an area of extreme pessimism that often marks short-term turning points.
As a result, since the GDXJ ETF is more correlated with the general stock market than its precious metals peers, a reversal of the pessimism is bullish for junior miners.
Medium-Term Trouble
Because asset prices don’t move in a straight line, we expect the GDXJ ETF to muster a short-term relief rally. However, with the PMs stuck in medium-term downtrends, their final lows will likely materialize in the months ahead.
For example, the financial markets move in counterintuitive ways. Therefore, while investors assumed that high inflation was bullish for the PMs (conventional wisdom), I warned on numerous occasions that unanchored inflation rattles the bond market and wakes up central banks. Thus, while inflation rose sharply in 2021 and 2022, it’s no surprise that the GDXJ ETF collapsed.
Moreover, with the liquidity drain still in the early innings, more pain should confront the PMs as central banks accelerate their war against inflation.
Please see below:
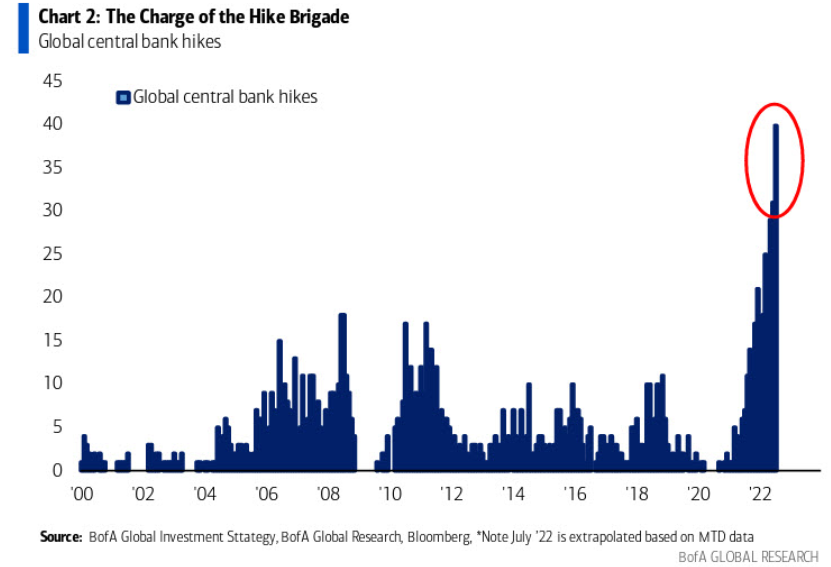
To explain, the blue bars above track the cumulative number of rate hikes administered by global central banks. If you analyze the right side of the chart, you can see that the current liquidity drain dwarfs all other comparable periods over the last ~22 years. As such, assets that benefit from QE and lower real yields are caught in central banks' crosshairs.
However, with inflation still unanchored in many regions, central banks' hawkish policies have done little to alleviate the pricing pressures. For example, I've noted that Canada is the canary in the coal mine for future Fed policy. With the two regions closely aligned geographically and in economic trade, they often share in each other's prosperity and pain.
Moreover, while Canada's headline Consumer Price Index (CPI) underperformed expectations and came in at 8.1% year-over-year (YoY) versus the 8.4% YoY expected on Jul. 20 (though still a new 2022 high), the core CPI outperformed.
Please see below:
 Source: Investing.com
Thus, while the Bank of Canada (BoC), like the Fed, often cites supply-chain disruptions and the Ukraine war as the reasons for inflation, the core CPI excludes the impact of food and energy prices. As a result, demand has proven much stronger than central bankers expected, and I warned on Mar. 31 that the BoC and the Fed’s war on inflation would be one of attrition. I wrote:
There is a misnomer in the financial markets that inflation is a supply-side phenomenon. In a nutshell: COVID-19 restrictions, labor shortages, and manufacturing disruptions are the reasons for inflation’s reign. As such, when these issues are no longer present, inflation will normalize and the U.S. economy will enjoy a “soft landing.”
However, investors’ faith in the narrative will likely lead to plenty of pain over the medium term. For example, I’ve noted for some time that the U.S. economy remains in a healthy position. And with U.S. consumers flush with cash and a red hot labor market helping to bloat their wallets, their propensity to spend keeps economic data elevated (...).
U.S. households have nearly $3.89 trillion in their checking accounts. For context, this is 288% more than Q4 2019 (pre-COVID-19). As a result, investors misunderstand the amount of demand that’s driving inflation.
To that point, the official Statistics Canada release highlights the challenges that North American central banks confront. The report revealed:
“The easing of public health measures and the increase in tourism which followed has led to higher demand for travel-related services. Travellers across the country faced higher prices for accommodation (+49.7%) compared with June 2021 (…). Prices for air transportation rose 6.4% month over month in June, following a 0.8% decline in May.”
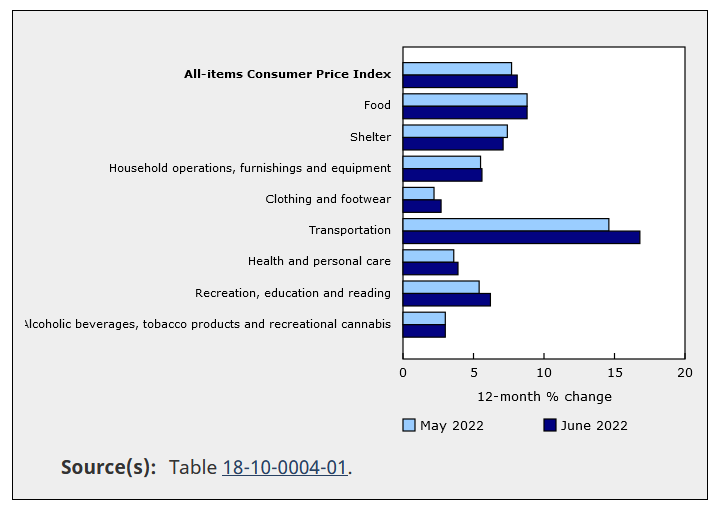
Therefore, while Statistics Canada was understandably light on details due to the troubling report, the key admission was that “price increases remained broad-based with seven of eight major components rising by 3% or more.”
Please see below:
 Source: Statistics Canada
To explain, the dark blue bars above show how costs for household furnishings, clothing and footwear, transportation, health and personal care, and recreation and education all increased relative to May. As such, inflationary pressures stretch far beyond food and energy, and too much demand is why inflation hasn’t subsided in 24+ months.
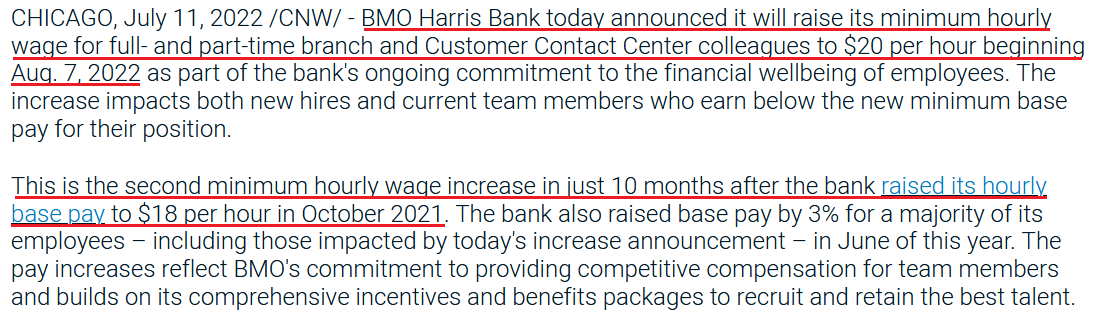
As further evidence, BMO Harris Bank announced on Jul. 11 that it “will raise its minimum hourly wage for full- and part-time branch and Customer Contact Center colleagues to $20 per hour beginning Aug. 7, 2022.”
Moreover, BMO Harris Bank has “more than 500 branches” in the U.S., and the 11.1% wage increase is on top of the “up to 20%” wage increase announced in October 2021. Thus, the data is profoundly inflationary and will only enhance employees’ spending ability.
Please see below:
 Source: BMO Harris Bank
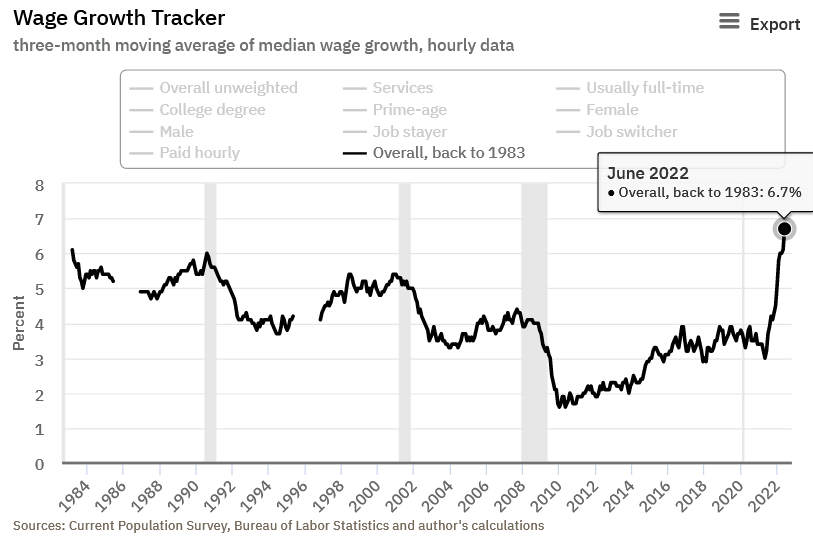
In addition, I noted on Jul. 15 that the Atlanta Fed’s measure of wage inflation is at record highs. I wrote:
The Atlanta Fed updated its Wage Growth Tracker on Jul. 14. And surprise, surprise, wage inflation hit a new all-time high in June.
Please see below:
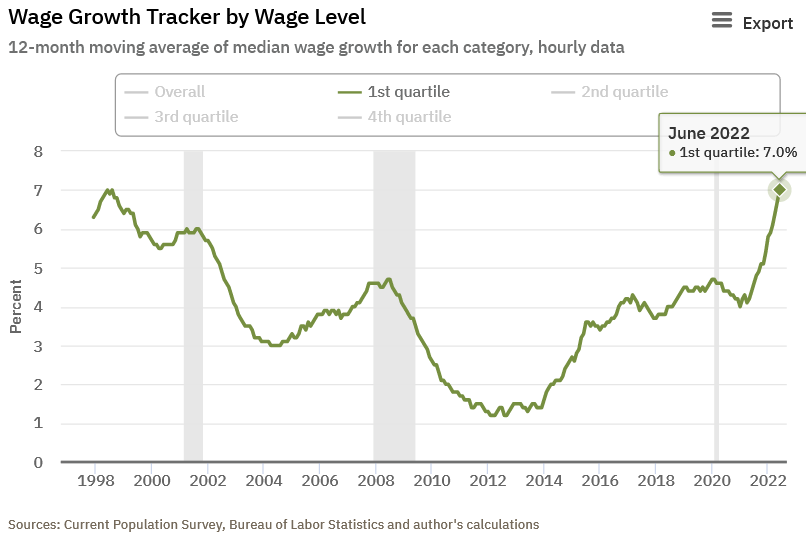
Likewise, the lowest-earning Americans saw their wages increase by 7%.
Please see below:
Thus, with a wage-price spiral unfolding and core CPI measures highlighting the ferocity of excess demand, the 1970s provide insight into the damage that unfolds when the Fed battles inflation.
Please see below:
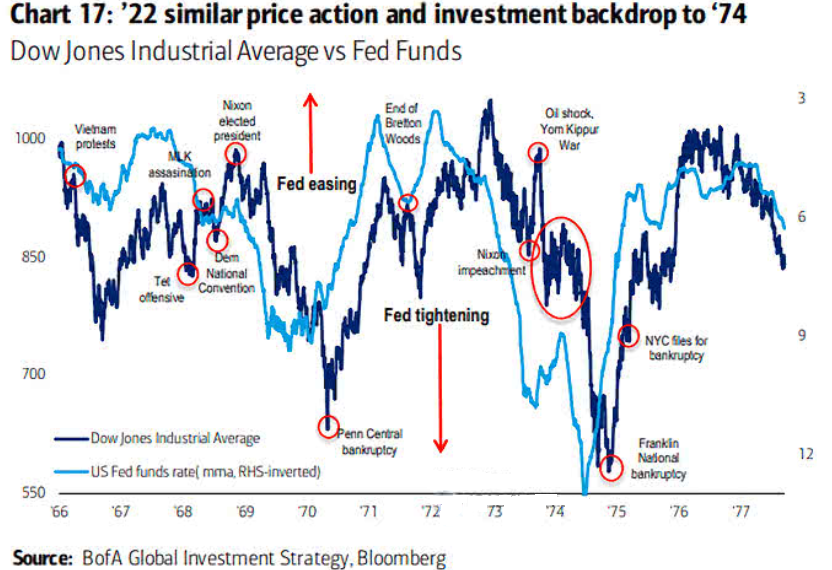
To explain, the dark blue line above tracks the Dow Jones Industrial Average (DJIA) from the late 1960s to the late 1970s, while the light blue line above tracks the inverted (down means up) U.S. federal funds rate.
If you analyze the relationship, you can see that sharp drops in the light blue line (the Fed hikes rates) coincide with major drawdowns in the DJIA. Therefore, with unanchored inflation forcing the Fed into a similar corner today, we’re likely only halfway through the DJIA troughs that occurred in ~1970 and ~1975.
The Bottom Line
Technicals, positioning, and sentiment support a short-term uprising for the GDXJ ETF. Moreover, with persistent gold-backed ETF outflows highlighting investors' distaste for the PMs, it's important to remember that the best buying opportunities often emerge when everyone is selling. Therefore, rallies should be on the horizon. In contrast, the PMs' medium-term outlooks continue to worsen, as inflation is more stubborn than the consensus realizes. As such, the Fed is likely nowhere near a dovish pivot.
In conclusion, the PMs declined on Jul. 20, as defensive assets were left for dead. However, with a reversal of flows likely to occur, the PMs should catch bids in the days ahead. Thus, we still see the short-term outlook as positive.
Naturally, as always, I’ll keep you – my subscribers – informed.
Overview of the Upcoming Part of the Decline
- It seems to me that we’re going to see a corrective upswing here (probably ending in the final week of July) that will then be followed by a very big decline in the precious metals sector.
- If we see a situation where miners slide in a meaningful and volatile way while silver doesn’t (it just declines moderately), I plan to – once again – switch from short positions in miners to short positions in silver. At this time, it’s too early to say at what price levels this could take place and if we get this kind of opportunity at all – perhaps with gold prices close to $1,600.
- I plan to exit all remaining short positions once gold shows substantial strength relative to the USD Index while the latter is still rallying. This may be the case with gold close to $1,400. I expect silver to fall the hardest in the final part of the move.
This moment
(when gold performs very strongly against the rallying USD and miners are strong relative to gold after its substantial decline) is likely to be the best entry point for long-term investments, in my view. This can also happen with gold close to $1,400, but at the moment it’s too early to say with certainty.
- The above is based on the information available today, and it might change in the following days/weeks.
You will find my general overview of the outlook for gold on the chart below:
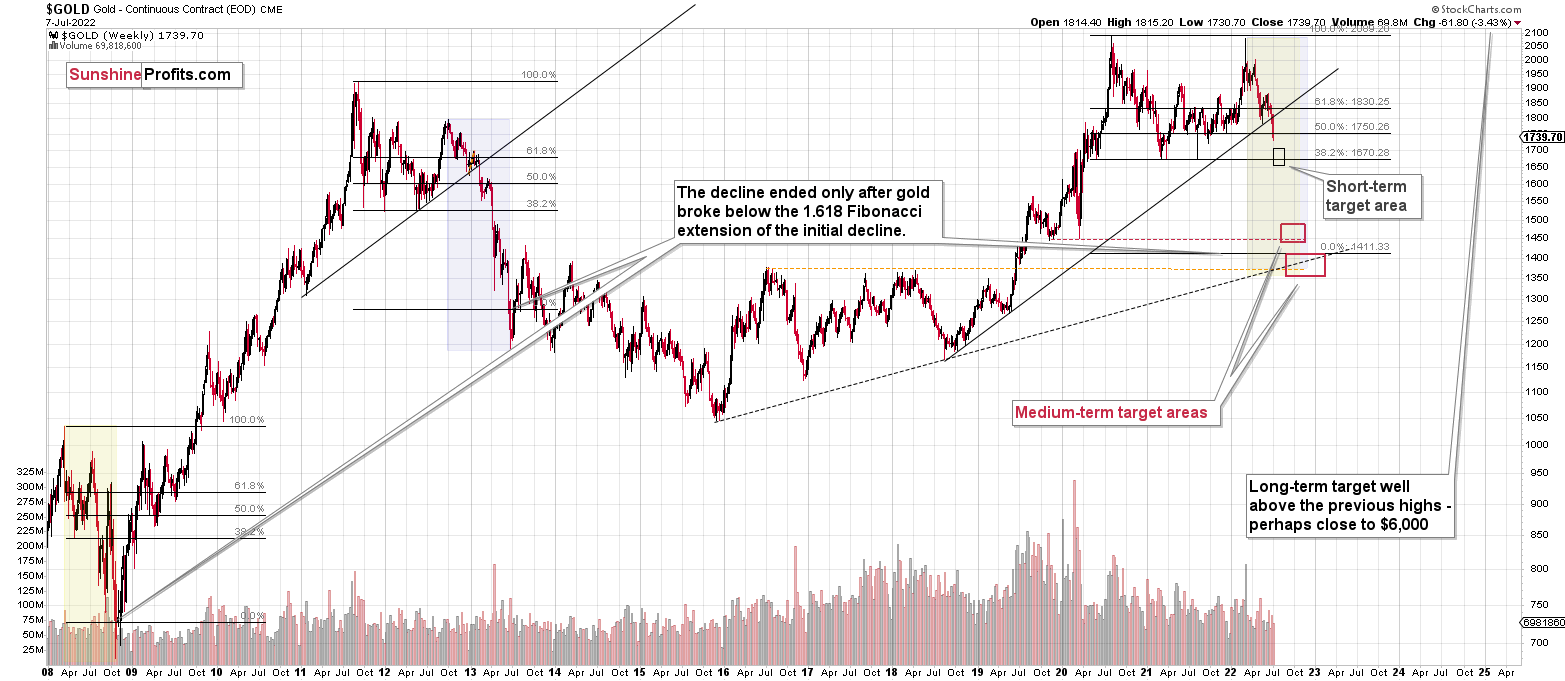
Please note that the above timing details are relatively broad and “for general overview only” – so that you know more or less what I think and how volatile I think the moves are likely to be – on an approximate basis. These time targets are not binding or clear enough for me to think that they should be used for purchasing options, warrants, or similar instruments.
Administrative Announcement
Due to PR’s travel schedule, there will be no regular weekly Gold Investment Update this Friday (July 22). Therefore, as subscribers, today and tomorrow you will receive Gold & Silver Trading Alerts as compensation. However, we must mention that due to the Author's unavailability, they will only consist of fundamental parts.
Summary
I previously wrote that the profits from the previous long position (congratulations once again) were likely to further enhance the profits on this huge decline, and that’s exactly what happened. The profit potential with regard to the upcoming gargantuan decline remains huge.
As investors are starting to wake up to reality, the precious metals sector (particularly junior mining stocks) is declining sharply. Here are the key aspects of the reality that market participants have ignored:
- rising real interest rates,
- rising USD Index values.
Both of the aforementioned are the two most important fundamental drivers of the gold price. Since neither the USD Index nor real interest rates are likely to stop rising anytime soon (especially now that inflation has become highly political), the gold price is likely to fall sooner or later. Given the analogy to 2012 in gold, silver, and mining stocks, “sooner” is the more likely outcome.
After the final sell-off (that takes gold to about $1,350-$1,500), I expect the precious metals to rally significantly. The final part of the decline might take as little as 1-5 weeks, so it's important to stay alert to any changes.
As always, we'll keep you – our subscribers – informed.
To summarize:
Short-term outlook for the precious metals sector (our opinion on the next 1-6 weeks): Bearish
Medium-term outlook for the precious metals sector (our opinion for the period between 1.5 and 6 months): Bearish initially, then possibly Bullish
Long-term outlook for the precious metals sector (our opinion for the period between 6 and 24 months from now): Bullish
Very long-term outlook for the precious metals sector (our opinion for the period starting 2 years from now): Bullish
As a reminder, Gold Investment Updates are posted approximately once per week. We are usually posting them on Friday, but we can’t promise that it will be the case each week.
Our preferred ways to invest in and to trade gold along with the reasoning can be found in the how to buy gold section. Additionally, our preferred ETFs and ETNs can be found in our Gold & Silver ETF Ranking.
Moreover, Gold & Silver Trading Alerts are posted before or on each trading day (we usually post them before the opening bell, but we don’t promise doing that each day). If there’s anything urgent, we will send you an additional small alert before posting the main one.
Thank you.
Przemyslaw Radomski, CFA
Founder, Editor-in-chief

