

Briefly: gold and the rest of the precious metals market are likely to decline in the next several weeks/months and then start another powerful rally. Gold’s strong bullish reversal/rally despite the USD Index’s continuous strength will likely be the signal confirming that the bottom is in.
Welcome to this week's Gold Investment Update.
Predicated on last week’s price moves, our most recently featured medium-term outlook remains the same as the price moves align with our expectations (and we not only took profits from two previous short positions, but we profited on the rebound, and expect more gains in the months ahead). On that account, there are parts of the previous analysis that didn’t change at all in the earlier days and are written in italics.
Pivot mania continues to drive risk assets, as weaker data helps lower Treasury yields and increases the appeal of other securities. In the process, the PMs have benefited, as they see lower real yields and a weaker USD Index ahead. However, the narrative is shortsighted and rivals the ‘transitory’ hopes that dominated the markets in 2021. Moreover, with the technicals and fundamentals aligned in their bearish expectations, profound reversals should unfold in the weeks ahead.
We’ll begin today’s alert by dissecting the fundamentals, and then dive into the technical aspects that have proven so prescient over the last several months.
Gold Shines as the Economic Outlook Darkens
The ‘bad news is good news’ trade continues to dominate the financial markets, as weaker economic data is perceived as bullish for risk assets. In a nutshell: if the Fed pivots and ends QT, all of investors’ problems will disappear. However, while the narrative has helped gold, an ominous economic backdrop should result in much lower prices in the months ahead.
For example, S&P Global released its U.S. Composite PMI on Nov. 24. And while the overall data was somewhat mixed, the last piece of the recession puzzle has begun to take shape. An excerpt read:
“U.S. companies lowered their workforce numbers during November for the first time in almost three-and-a-half years. Although only fractional, employment tipped into contractionary territory following the first drop in service sector headcounts since June 2020. Manufacturers, meanwhile, recorded back-to-back declines in staffing numbers.
“Businesses commonly mentioned that relatively muted demand conditions and elevated cost pressures had led to lay-offs. Other companies noted that hiring freezes were in place amid pressure on margins.”
Thus, while we warned repeatedly that higher long-term interest rates were poised to erode consumer demand, a slowdown in the U.S. labor market should continue for the foreseeable future. And as that occurs, investors’ pivot optimism should turn to recession pessimism.
Remember, rate cuts have been historically bearish, as they typically occur alongside severe economic contractions. And with the crowd pricing in a perfect soft landing, a major surprise should unfold, which is highly bearish for silver, gold and mining stocks.
More Red Flags
Despite investors’ belief that the Fed will pull off the perfect landing (it never does), boom and bust cycles have played out plenty of times throughout history. And with the ominous data hiding in plain sight, it’s likely only a matter of time before investors’ confidence turns to doubt.
LinkUp’s employment index tracks the hiring intentions of the 10,000 largest employers with the most U.S. job openings. And with the metric suffering a serious slide, it’s no wonder crude oil has come under pressure.
Please see below:
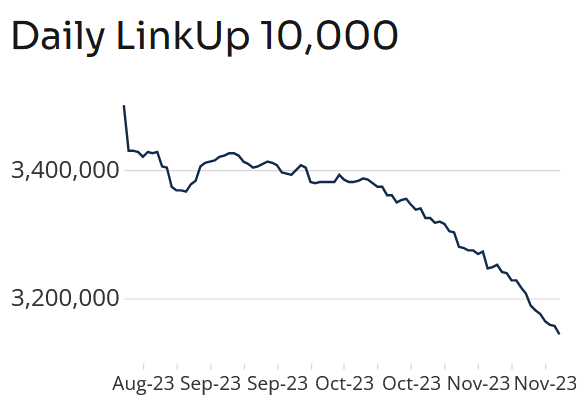
To explain, the blue line above tracks LinkUp’s employment index over the last 100 days. If you analyze the sharp deceleration, you can see that hiring intentions collapsed as long-term interest rates soared. Moreover, while the crowd continues to celebrate the drawdown (pivot hopes), a continued crash should lead to a Minsky Moment in 2024.
As further evidence, continued unemployment claims have risen materially, which adds further fuel to the bearish thesis. The metric measures the number of Americans who have filed for unemployment more than once.
Please see below:
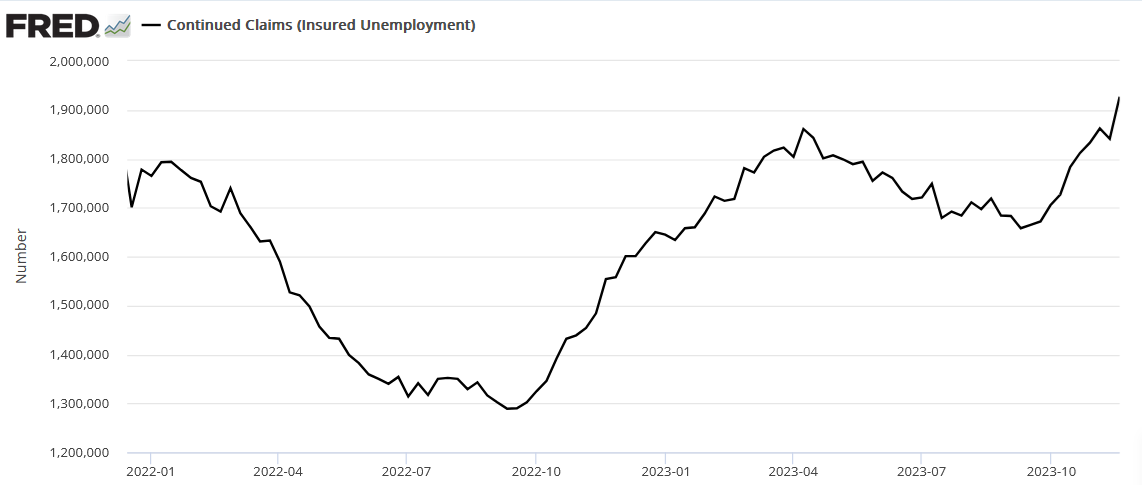
To explain, the sharp rise on the right side of the chart highlights how continued unemployment claims have surpassed their 2022 and 2023 highs. And again, it’s no coincidence the recent surge occurred alongside the rise in long-term interest rates. As a result, the fundamentals continue to unfold as expected, and a recession should be the next catalyst that hammers risk assets and uplifts the USD Index.
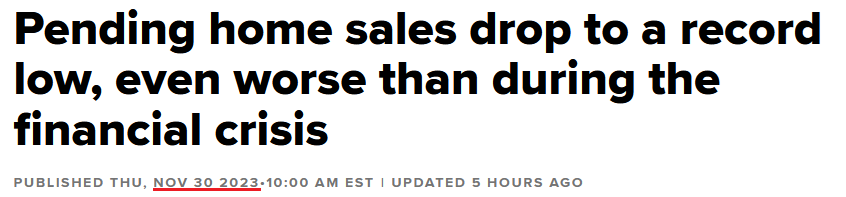
Finally, with U.S. mortgage rates following Treasury yields higher, the housing market remains highly unaffordable for most buyers. And with pending home sales in crash mode, demand remains another casualty of the Fed’s inflation fight.
Overall, the ‘bad news is good news’ narrative has been a boon for the S&P 500. Yet, risk assets are known to place hope before reality, which often leads to sharp reversals when the latter prevails. Consequently, we believe the real drama is yet to come, and mining stocks should suffer profoundly if (when) a recession arrives.
Silver Salivates Over Rate Cuts
While we have warned that a fairytale economic ending is unlikely to materialize, investors are all in on the hopes of a soft landing. And with stocks, silver and gold basking in the glory, risk assets are priced as if risk has evaporated. However, with the economic outlook poised to bite over the medium term, the crowds’ unrelenting optimism should be their undoing.
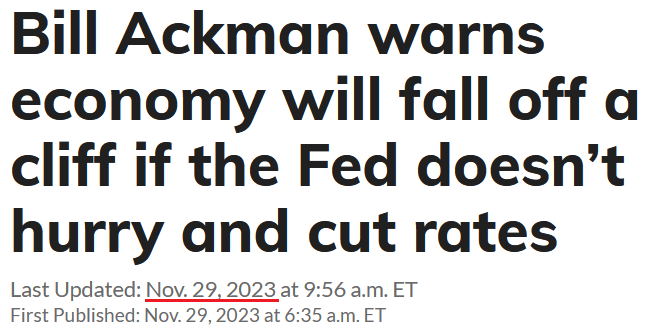
For example, hedge fund manager Bill Ackman was an inflation bull in 2021 and 2022 (like us) and also warned that interest rates were headed materially higher. But, with 2024 shaping up to be a much different story, the ghosts of rate hikes past should make their presence felt over the medium term. He said:
“There has been a huge subsidy in terms of low interest rates, and most companies fixed their rates or debt at very low rates and certainly real-estate investors did the same. And that works until it doesn’t work.
“What’s going to be interesting is to see what happens when people have to reprice their debt. And that can have a certain cliff-like effect. And you’re certainly seeing that in real estate…. I think there’s a risk of a hard landing if the Fed doesn’t start to cut rates pretty soon.”
Thus, while we warned that a serious economic deceleration was underway, prominent investors have adopted our thesis. And while the crowd is programmed to buy the pivot hype, the reality is that when pivots occur, sell-offs across assets like silver are already underway.
Please see below:
To that point, The Conference Board released its Consumer Confidence Index on Nov. 28. And while the expectations index rose, its present situation index hit a new post-recovery low.
Please see below:
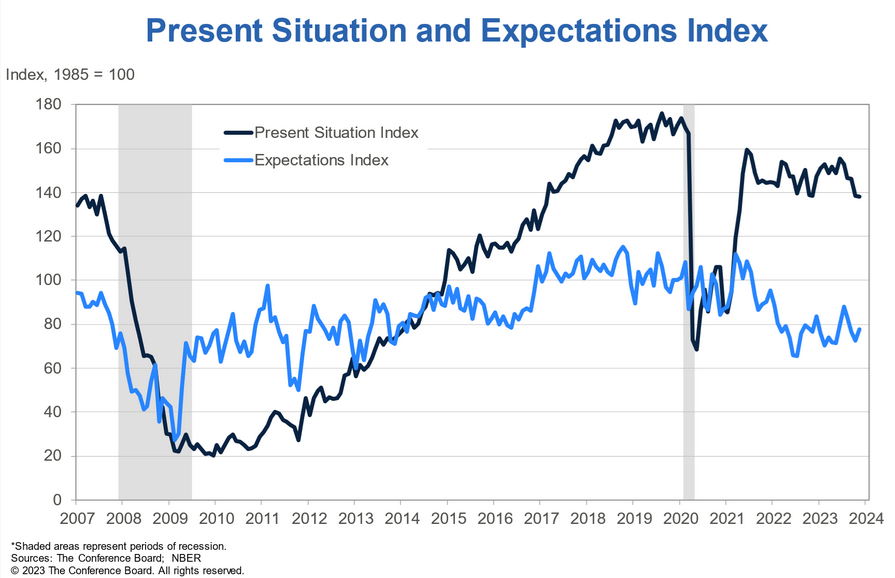
To explain, the light blue line above tracks the expectations index (next six months), while the black line above tracks the present situation index (current conditions). If you analyze the latter's performance, you can see that consumer confidence dropped dramatically alongside higher long-term interest rates. Thus, while crude oil has felt the pain, several assets should get hit before the next bull market begins.
Consumer Struggles
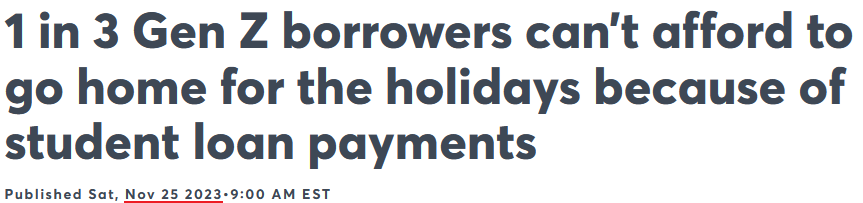
While we warned that the resumption of student loan repayments was a mathematical hindrance to consumer spending, a Credit Karma survey found that 32% of Gen Z Americans (aged 18 to 26) said they can’t afford to travel home for the holidays.
Moreover, 25% said student loans make the festivities unaffordable, and 33% said they wish the holidays were canceled due to the bloated costs. As such, the current economic backdrop is nothing like 2021 or 2022.
Please see below:
Similarly, the Fed’s latest Beige Book (released on Nov. 29) was riddled with ominous results. The report stated:
“Economic activity slowed since the previous report, with four Districts reporting modest growth, two indicating conditions were flat to slightly down, and six noting slight declines in activity.”
In addition, “reductions in headcounts through layoffs or attrition were reported, and some employers felt comfortable letting go low performers.”
Thus, since the ‘bad news is good news’ crowd deems these findings as positive, silver has benefited from the pivot mania, while the USD Index has struggled. However, we expect a reversal of fortunes over the medium term, as economically-driven volatility uplifts the dollar and upends the white metal.
Overall, the fundamentals continue to match our expectations. Higher interest rates have created economic weakness, and the suffering should continue in the months ahead. So, while the S&P 500 celebrates, and the crowd assumes that a weak economy will create strong asset prices, history says otherwise, and a profound shift in sentiment should be on the horizon.
The Bottom Line
Financial markets are at the bridge between higher interest rates/inflation and the new normal that awaits them on the other side. But, while the crowd prices in prosperity, the data and history signal immense trouble ahead. Therefore, we remain cautious and expect much more fireworks over the medium term.
In conclusion, the PMs were mixed on Nov. 30, as gold ended the day in the red. Yet, with mining stocks still materially overvalued, the GDXJ ETF’s long-term downtrend should continue before a buying opportunity emerges.
Technically Speaking
While the GDXJ ETF rallied slightly on Nov. 30, little changed to alter my medium-term thesis. The PMs have enjoyed short-term pivot rallies, but the technicals remain highly bearish. Furthermore, a confluence of indicators help support my conviction, and yesterday’s analysis provides a breakdown for those who are unfamiliar.
Higher gold? Yes, it’s testing the previous 2023 highs. Higher gold stocks? Not even close to their 2023 highs… And it means what you think it means.
It means that the big trend in the precious metals sector remains down, regardless of how much the very short-term price moves make one think (actually: feel) otherwise.
I previously commented on the above chart in the following way, and it remains up-to-date:
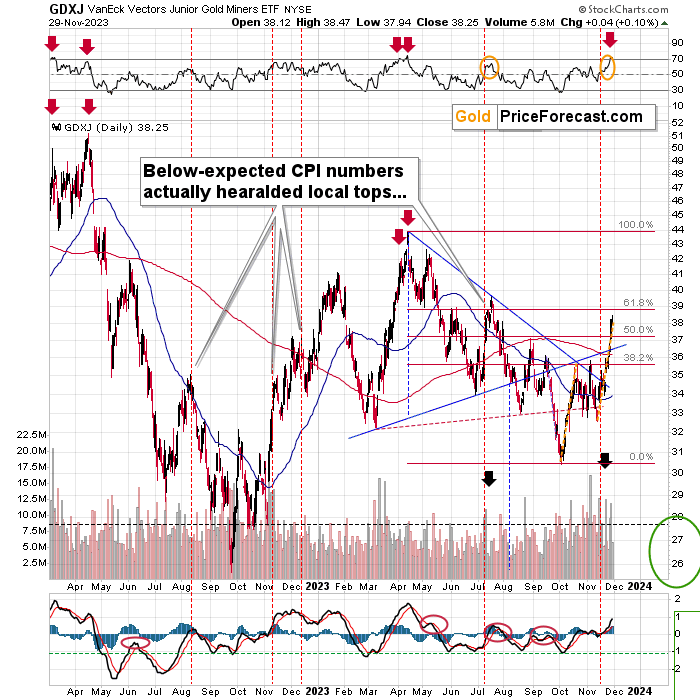
If you feel like the market is running away, and that the bullishness is overwhelming, please keep in mind that this is exactly the feeling that accompanies local tops. This is the trying time, where so many investors panic and get on the wrong side of the trade. Let’s take a look at the GDXJ chart for details.
The GDXJ just did the following:
- Moved slightly above its August high without confirming this move.
- Rallied after below-expected CPI numbers in a way that’s very similar to what we saw in July (and rallied pretty much as much as it did back then, indicating that the rally is likely over.
- Rallied after a flag formation, in a way that is almost identical to the rally that preceded the flag (marked with orange, dashed lines). The moves that follow this formation are likely to be as big as the ones that preceded it. In other words, it’s likely that “this is it”.
On top of the above, the RSI just touched the 70 level which is the classic sell signal. That’s what started the huge 2022 slide – the RSI was at that level when it topped in April 2022.
So, all in all, today’s upswing might seem to be a bullish game-changer, but it’s all part of a bigger – bearish – pattern. The April – October 2023 slide was followed by a zig-zag correction. That’s it. The next huge wave down is likely to start any day or hour now.
(…)
The RSI moved above 70 which is not only a classic sell signal, it’s also something that already worked many times. I marked the previous cases with red arrows, and as you can see the implications were not minor. These were one of the top moments to be sticking to or entering short positions in the mining stocks, and one of the absolutely worst moments to drop short positions or enter long ones.
From Nov. 30:
Since the 61.8% Fibonacci retracement is such an important resistance level, please note that even if the GDXJ is going to touch it (thus rallying a bit more), we’re still very likely to see declines shortly thereafter.
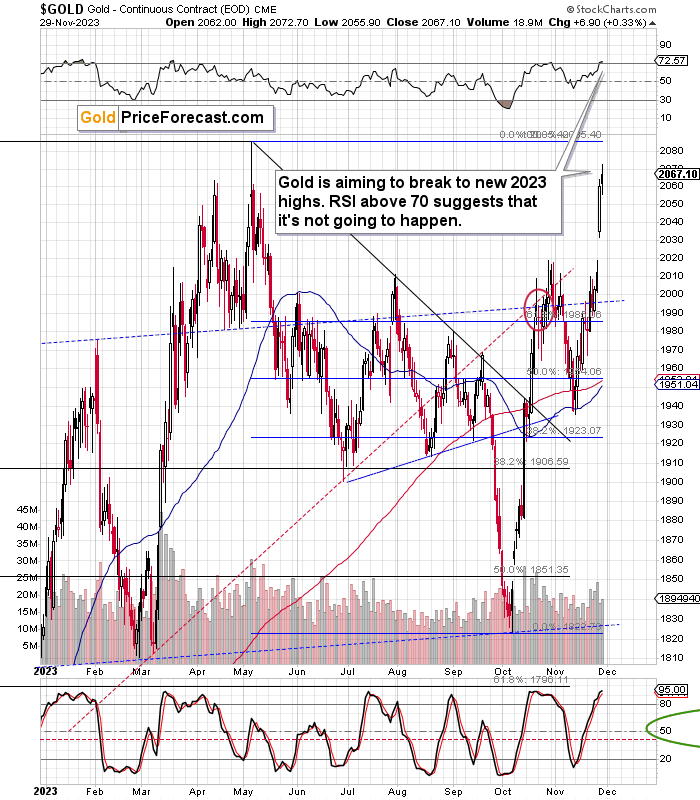
Gold price is testing its previous 2023 highs, but since the RSI just moved above 70, it’s highly unlikely that this rally will hold. After all, the latter is a common sell signal that has very good accuracy on the gold market.
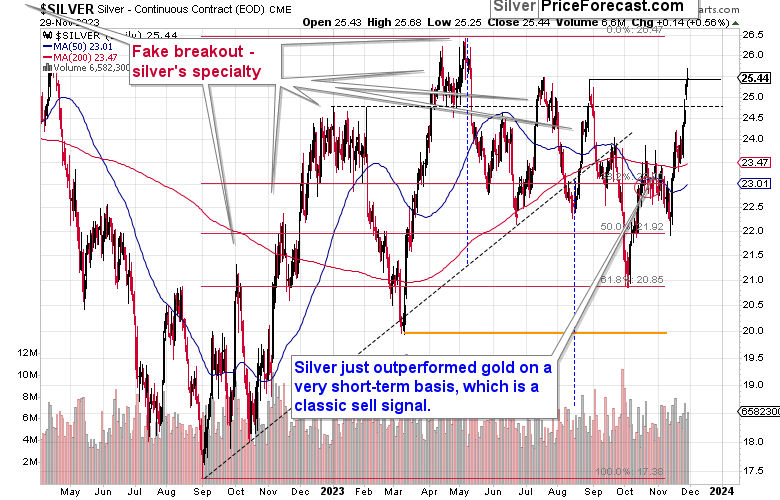
Silver didn’t move to its 2023 highs, but it still outperformed gold on a very short-term basis.
This is yet another time when silver is trying to break and hold the breakout above the $24.7 level (the January 2023 high). As the history tends to rhyme, this attempt is likely to be invalidated, just like all the previous ones:
- The April attempt,
- The July attempt,
- The August attempt.
Besides, silver is known for its fake breakouts. The recent move above the January high is likely fake, and the same goes for the move above the July high.
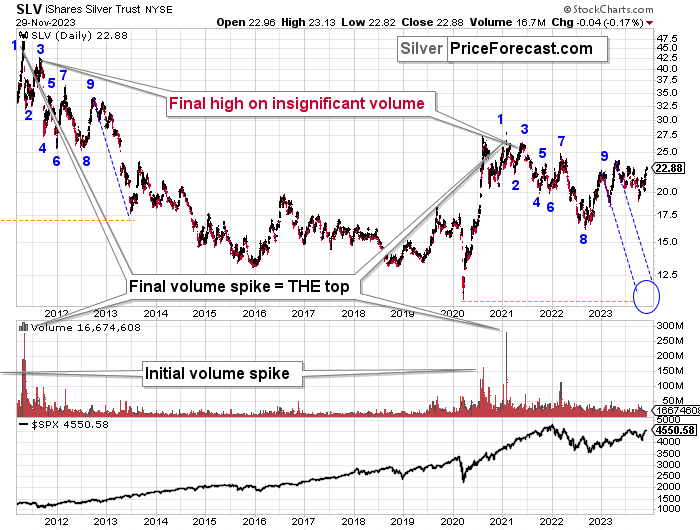
Zooming out shows how relatively insignificant the recent upswing really was.
The white metal is not even half as expensive as it was at its 2011 top, even in nominal terms.
The patterns in which silver moved from the key top in 2011, 2012, and 2013 and in recent years continue to be analogous. The back-and-forth shape of decline is present also this time (not the declines that start with “9”), only this time, the counter-trend rally is a bit bigger.
The implications of the analogy remain bearish.
Staying with the bigger picture for a while, please keep in mind that the ratios featuring gold stocks: gold stocks to gold, and gold stocks to stocks, continue to point to the medium-term downtrend being in place.
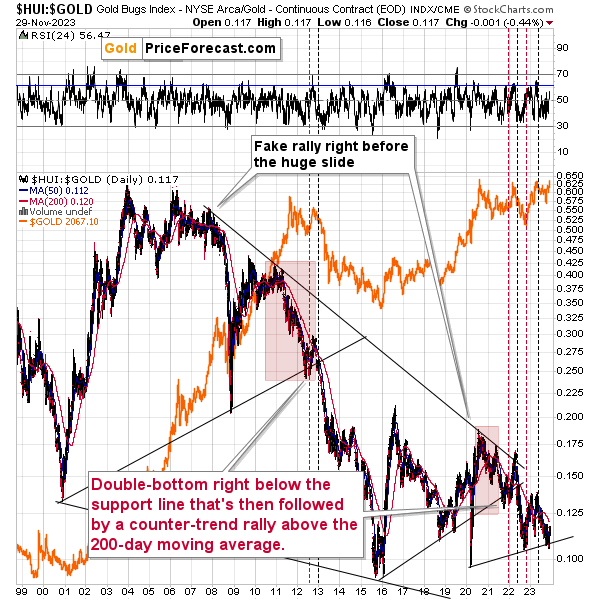
The recent tiny upswing in the gold stocks to gold ratio is barely visible from the long-term point of view. The medium-term downtrend is crystal-clear.
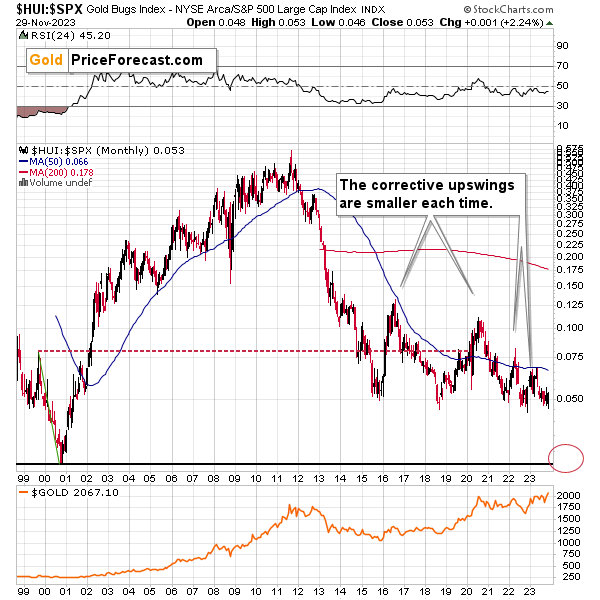
The same goes for the ratio between gold stocks and the S&P 500 Index. It’s pretty much on a verge of a massive breakdown below the 2015 low.
Let’s zoom out even more, looking at the situation in world stocks.
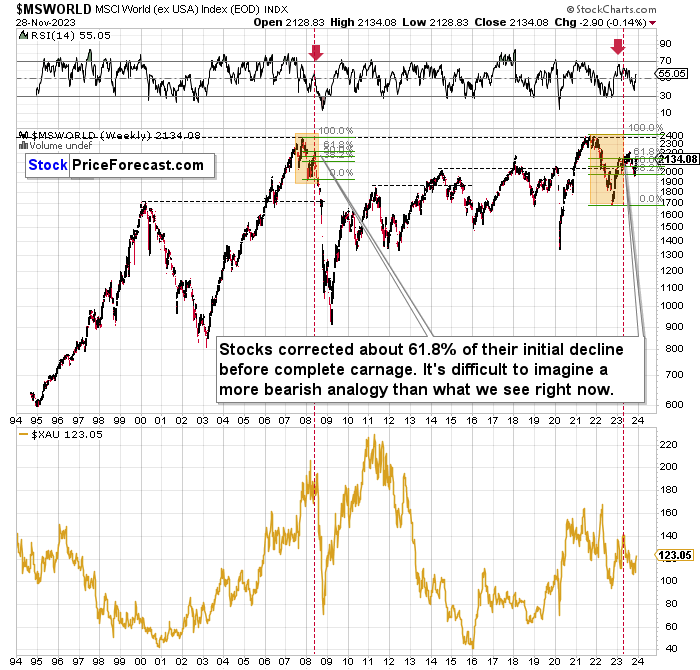
The situation in world stocks still looks like it did in 2008, and the orange rectangles show similar times. In both cases, stocks corrected to the 61.8% Fibonacci retracement level based on the initial decline before moving much (!) lower.
The difference between both periods is that we now see a correction within a correction. This doesn’t change anything, especially since the size of the initial decline was bigger, and thus it makes sense for the correction to be more notable as well.
It’s likely that the stock markets around the world will decline, likely leading to a substantial slide in the precious metals market – just like what we saw in 2008.
Here’s what happened in the mining stocks when world stocks plunged in 2008.
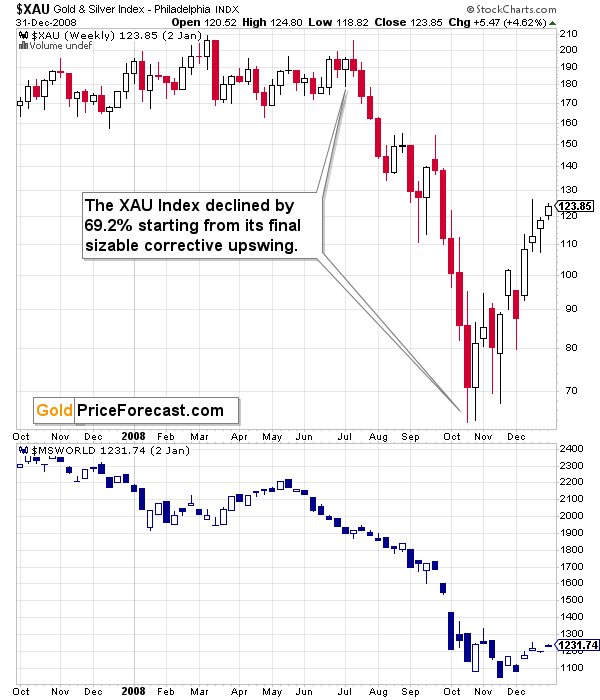
The decline in the XAU Index – proxy for gold and silver stocks – was massive. The same fate likely awaits mining stocks in the following months.
I realize that it might be difficult to think so in a situation when miners move up in the short run, but this really is the case given the situation in world stocks and in the mining stock ratios.
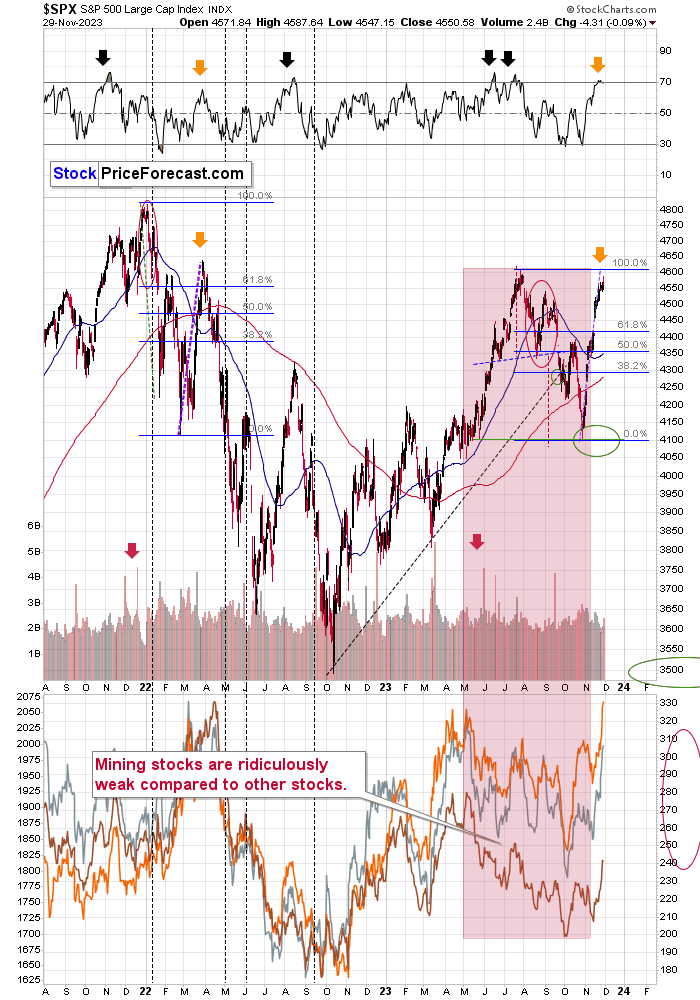
Besides, the U.S. stocks moved sharply higher, pretty much exactly as they rallied in March 2022, and if the moves are to be alike, the top is in or at hand.
In fact, based on the RSI that just moved above 70, the current situation is more overbought than it was at the March 2022 top. And higher stock prices were not seen since the March 2022 top… The current implications are very bearish, especially for mining stocks which plunged severely after stocks topped in March 2022.
Meanwhile, the situation in the USD Index continues to suggest that the bottom in it is either in or at hand, and my previous comments on this market remain up-to-date:
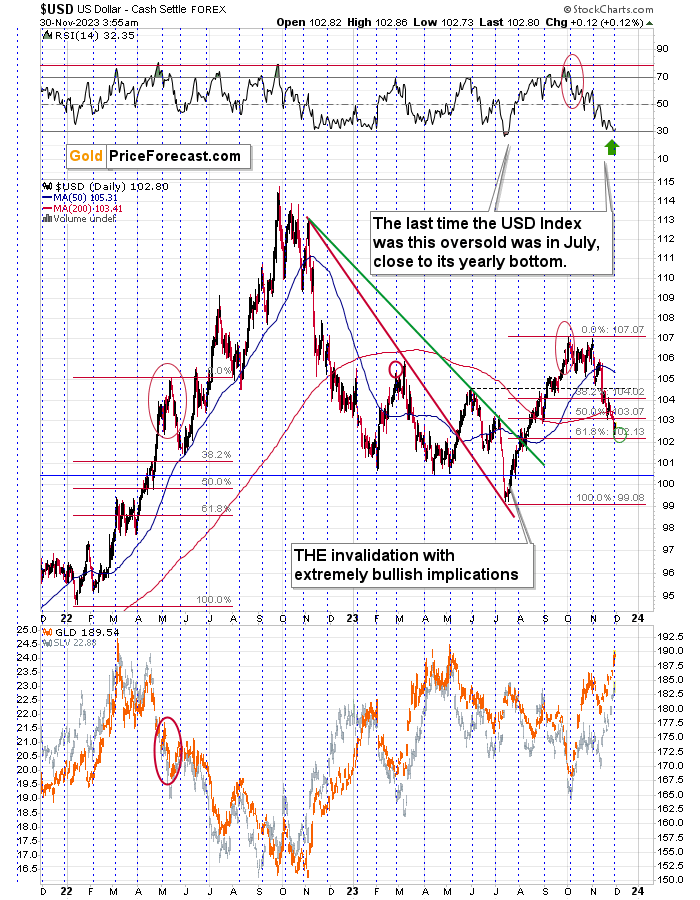
There are really important buy signals and there are moderately-important ones. And then there are weak ones. What we see on the USD Index is not one, but a combination of three important buy signals.
The USD Index is after a corrective downswing that took it to the 61.8% Fibonacci retracement level (almost). This level provides strong support in general, but it works particularly well for the forex market.
Now, since the USDX almost (!) moved to this level, it might be the case that it dips before rallying back up, but the move lower is unlikely to be significant, if we see it at all.
I marked the downside target with a green ellipse, and as you can see, it was already reached, but there’s still some room for the U.S. currency to move a little lower.
The second important bullish indication comes from the RSI indicator. The latter moved very low compared to its usual course of action. It just bounced off the 30 level, which serves as a classic buy signal, and something that indeed worked for the USDX over and over again.
The only time, when the RSI was lower than it just was, was at the yearly bottom in July. At that time almost nobody wanted to view USD’s move below 100 as a buying opportunity, just as it’s not being viewed as such right now. And yet, that was exactly what started USD’s massive rally.
The third important factor that needs to be kept in mind is the aspect of time. The USDX has the tendency to reverse its course close to the turn of the month. The month is about to end and there’s no doubt that the most recent move was to the downside.
This means that it’s not only the case that the USD Index is likely to reverse from the current price levels – it’s also about time that it does that.
Given the negative correlation between the USD Index and the precious metals sector, this very likely means that the tops in gold, silver, and mining stocks are either in or about to be in.
From Nov. 30:
Finally, please note that the copper market is currently verifying the breakdown below its rising support line, which now turned into resistance.
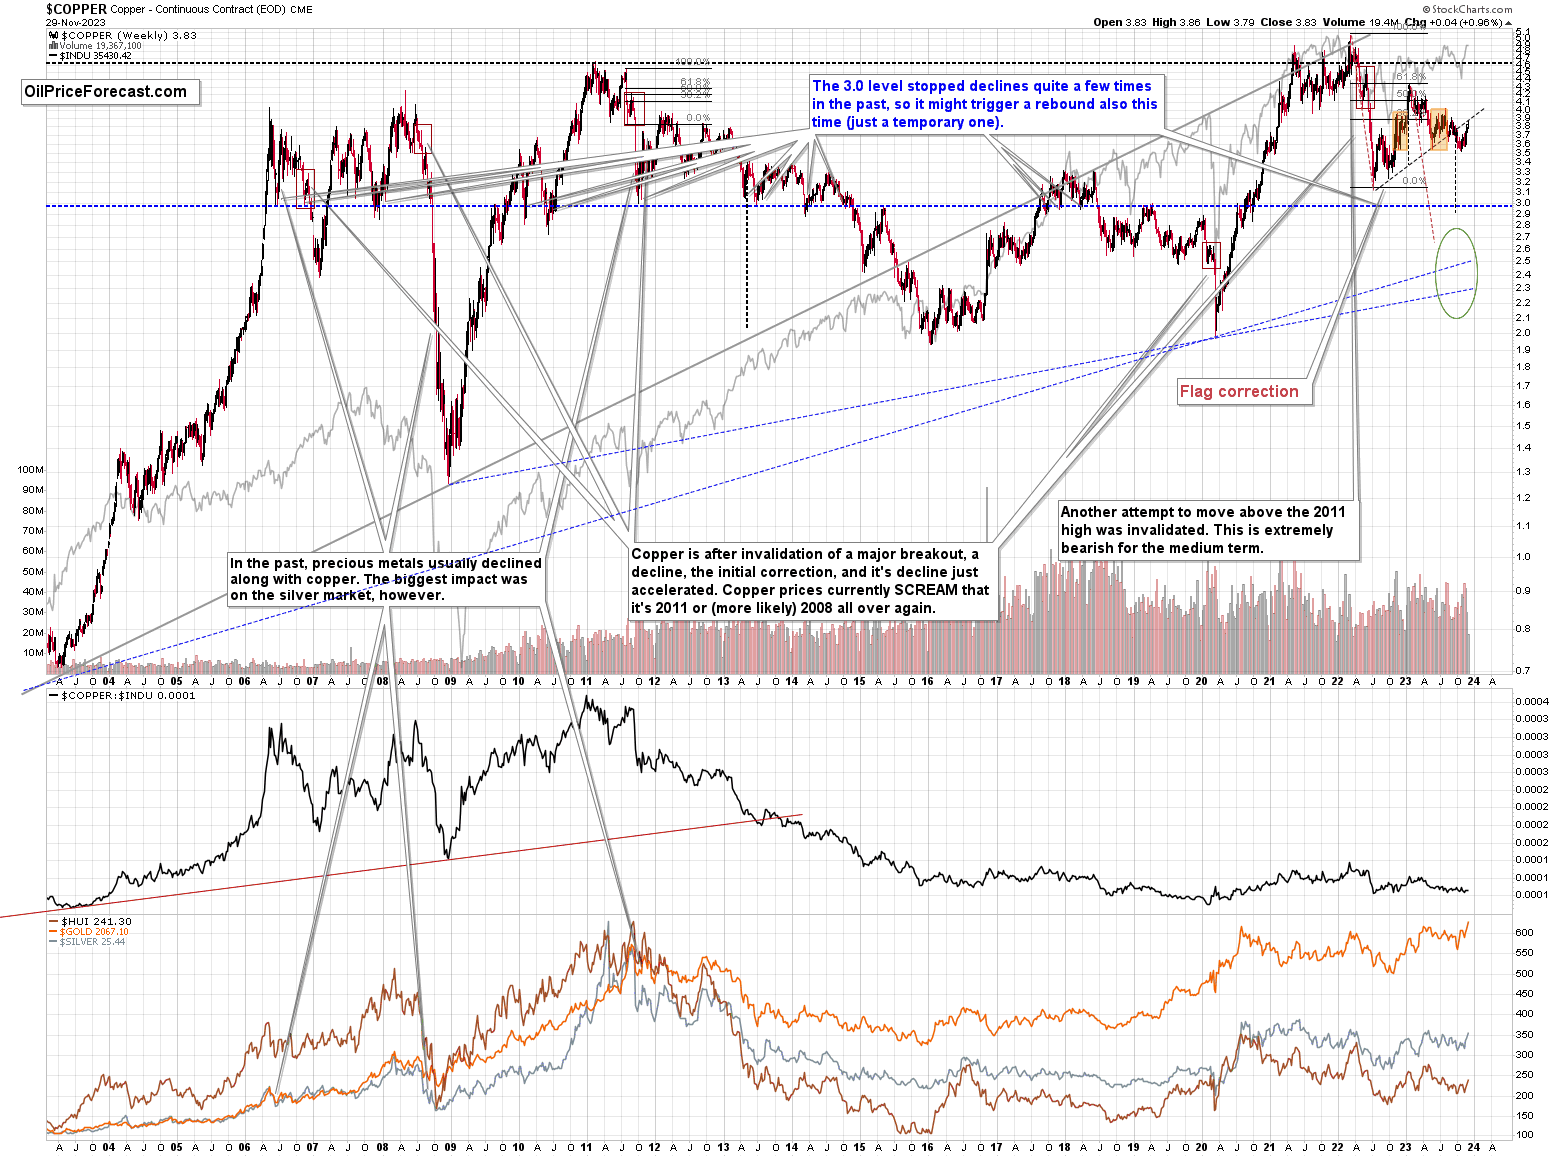
As this line holds, the medium-term trend remains down. Since copper and the precious metals market (and stocks) usually move together, the implications for the PMs are bearish.
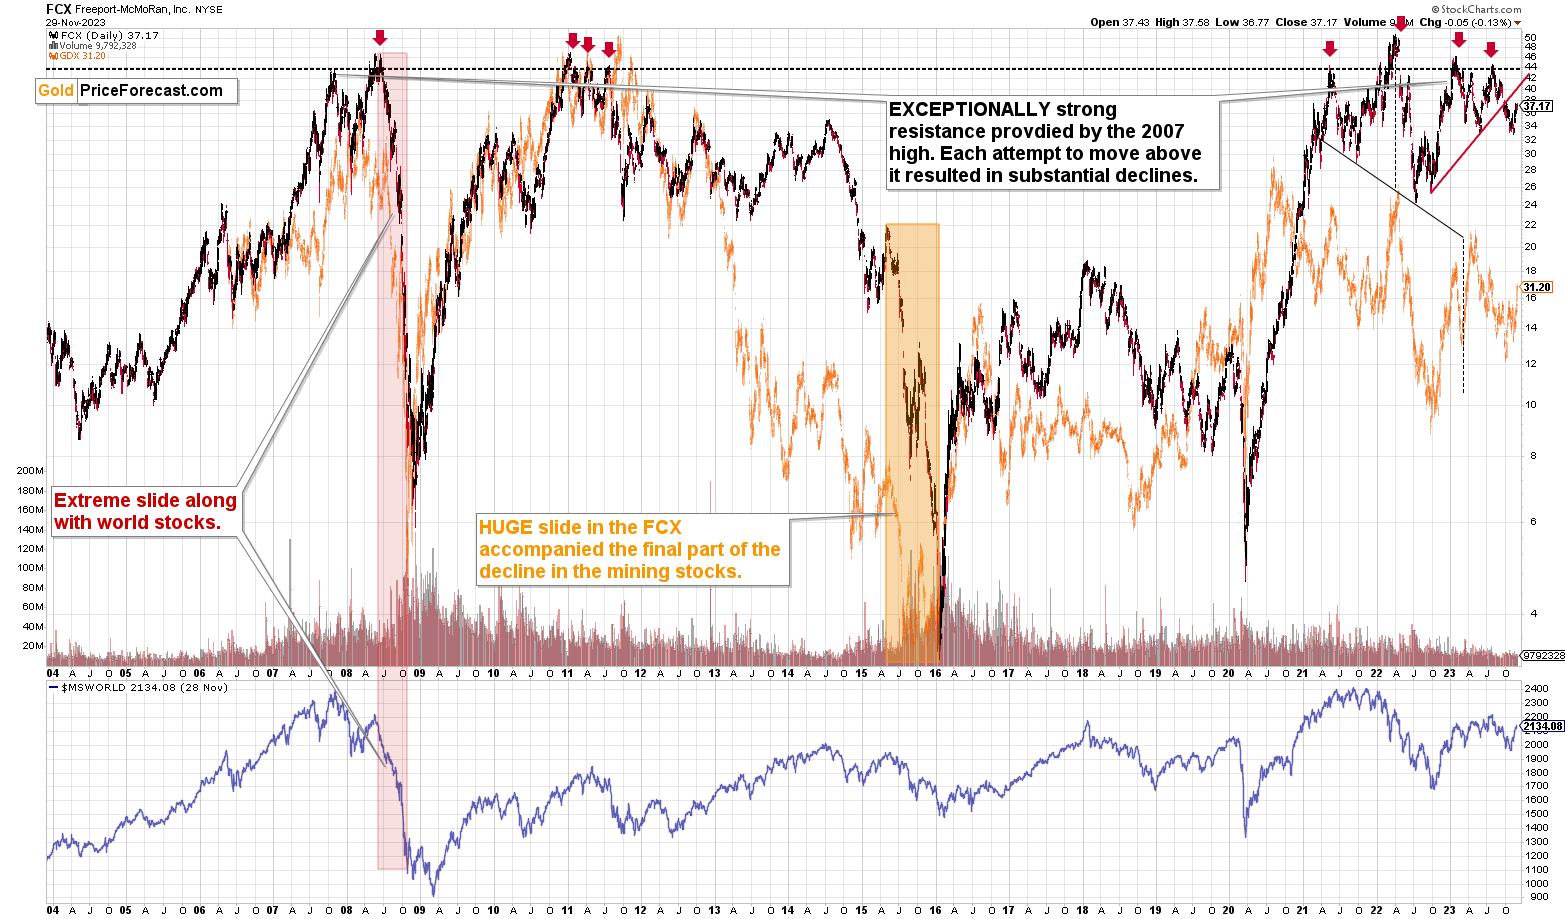
The FCX is also corrective after a breakdown. Unlike copper, FCX wasn’t able to touch its own rising support line, showing weakness. And since it was weak during the correction, the odds are that FCX will be declining profoundly when the decline resumes. And since copper has already touched its resistance line, the odds are this will happen soon.
Interestingly, we see something similar on the chart featuring the gold-to-oil ratio.
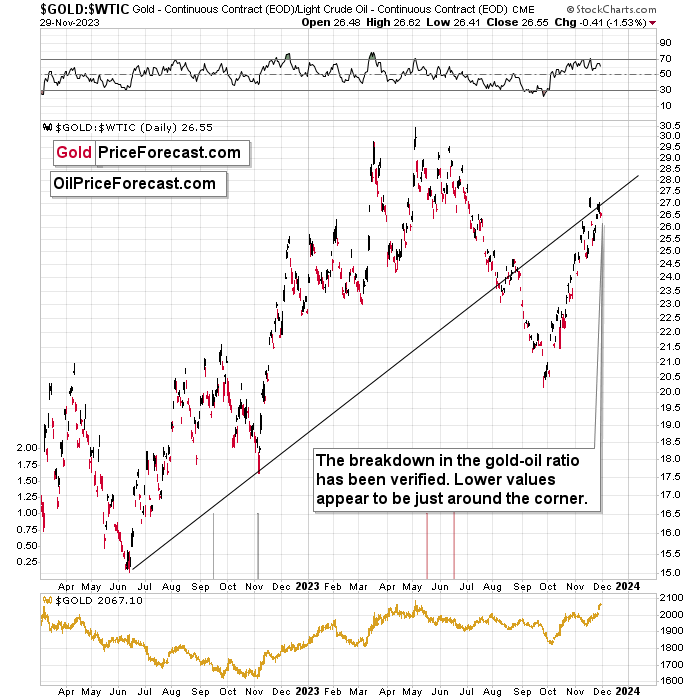
The ratio moved approximately to its rising resistance line, and then it moved back down. It seems that the top is in. When the ratio topped previously this year, it also meant top in gold.
Now, it could also be the case that the above implies a bottom in the crude oil price, and as Anna described it recently, it could be the case that the inverse head-and-shoulders bottom in crude oil is in the making, which could be a buying opportunity for this market.
It could also be the case that both would happen at the same time – a bottom in oil and a top in gold. After all, crude oil topped in late September, and gold bottomed shortly thereafter. It could be the case that crude oil bottomed already, and gold is topping right after that had happened.
All in all, the junior mining stocks' values and the share price of the FCX are both likely to decline strongly in the coming weeks, and it seems that they will start their next big decline soon.
I know it’s difficult not to get carried away by the day-to-day price action, but please keep in mind that it is usually, what’s difficult is also profitable in the end. And let’s also keep in mind that we’re on a record of having 11 profitable (unleveraged – e.g. in GDXJ) trades closed – in a row.
In my view, the current trading positions are going to be very profitable before we close them as well.
= = =
If you’d like to become a partner/investor in Golden Meadow, you’ll find more details in the above link.
Overview of the Upcoming Part of the Decline
- It seems that the recent – and probably final – corrective upswing in the precious metals sector is over.
- If we see a situation where miners slide in a meaningful and volatile way while silver doesn’t (it just declines moderately), I plan to – once again – switch from short positions in miners to short positions in silver. At this time, it’s too early to say at what price levels this could take place and if we get this kind of opportunity at all.
- I plan to switch from the short positions in junior mining stocks or silver (whichever I’ll have at that moment) to long positions in junior mining stocks when gold / mining stocks move to their 2020 lows (approximately). While I’m probably not going to write about it at this stage yet, this is when some investors might consider getting back in with their long-term investing capital (or perhaps 1/3 or 1/2 thereof).
- I plan to return to short positions in junior mining stocks after a rebound – and the rebound could take gold from about $1,450 to about $1,550, and it could take the GDXJ from about $20 to about $24. In other words, I’m currently planning to go long when GDXJ is close to $20 (which might take place when gold is close to $1,450), and I’m planning to exit this long position and re-enter the short position once we see a corrective rally to $24 in the GDXJ (which might take place when gold is close to $1,550).
- I plan to exit all remaining short positions once gold shows substantial strength relative to the USD Index while the latter is still rallying. This may be the case with gold prices close to $1,400 and GDXJ close to $15 . This moment (when gold performs very strongly against the rallying USD and miners are strong relative to gold after its substantial decline) is likely to be the best entry point for long-term investments, in my view. This can also happen with gold close to $1,400, but at the moment it’s too early to say with certainty.
- The above is based on the information available today, and it might change in the following days/weeks.
You will find my general overview of the outlook for gold on the chart below:
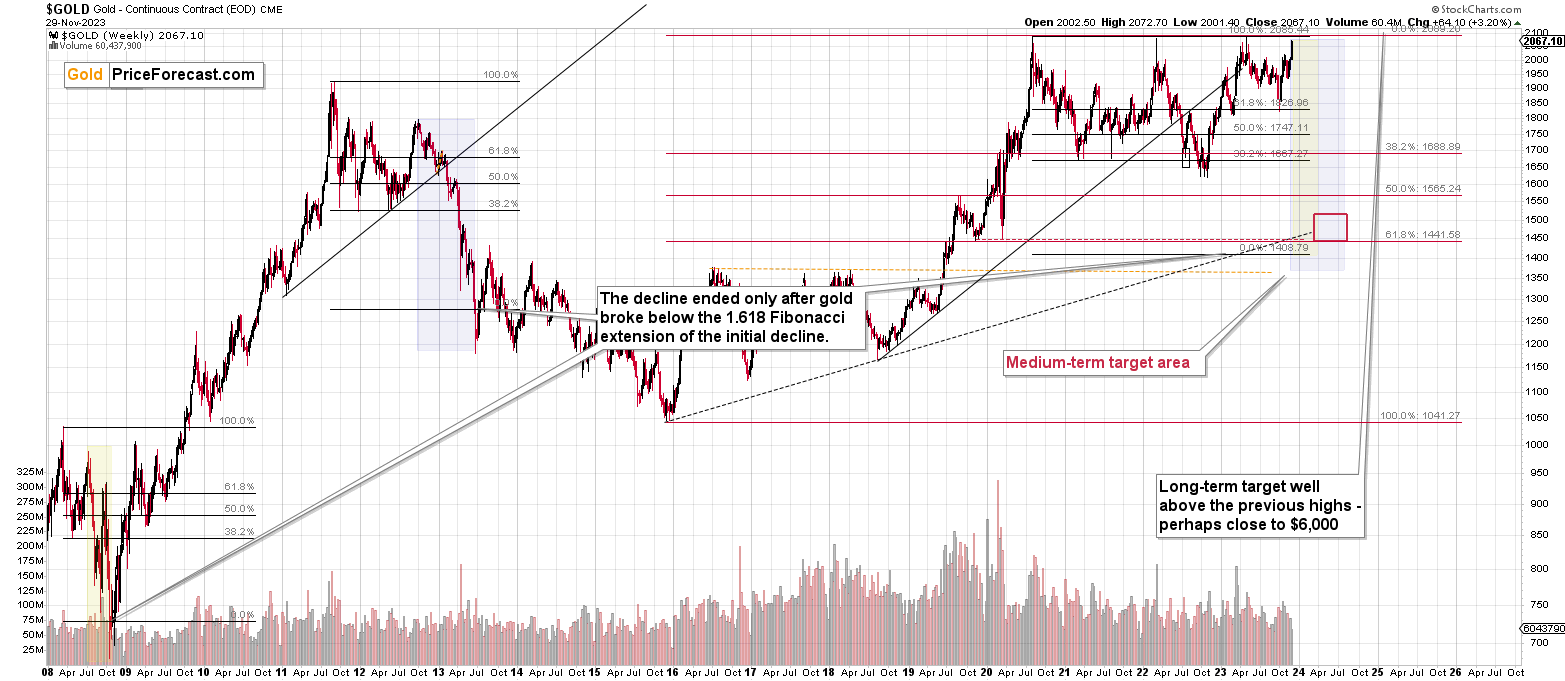
Please note that the above timing details are relatively broad and “for general overview only” – so that you know more or less what I think and how volatile I think the moves are likely to be – on an approximate basis. These time targets are not binding nor clear enough for me to think that they should be used for purchasing options, warrants, or similar instruments.
Letters to the Editor
Please post your questions in the comments feed below the articles if they are about issues raised within the article (or in the recent issues). If they are about other, more universal matters, I encourage you to use the Ask the Community space (I’m also part of the community) so that more people can contribute to the reply and enjoy the answers. Of course, let’s keep the target-related discussions in the premium space (where you’re reading this).
Summary
To summarize, the medium-term trend in the precious metals sector remains clearly down and given that the fear has most likely peaked, and the current technical indications point to lower precious metals prices, it seems that we won’t have to wait for much lower prices for long. The same goes for the FCX stock price.
To summarize:
Short-term outlook for the precious metals sector (our opinion on the next 1-6 weeks): Bearish
Medium-term outlook for the precious metals sector (our opinion for the period between 1.5 and 6 months): Bearish initially, then possibly Bullish
Long-term outlook for the precious metals sector (our opinion for the period between 6 and 24 months from now): Bullish
Very long-term outlook for the precious metals sector (our opinion for the period starting 2 years from now): Bullish
As a reminder, Gold Investment Updates are posted approximately once per week. We are usually posting them on Monday, but we can’t promise that it will be the case each week.
Our preferred ways to invest in and to trade gold along with the reasoning can be found in the how to buy gold section. Additionally, our preferred ETFs and ETNs can be found in our Gold & Silver ETF Ranking.
Moreover, Gold & Silver Trading Alerts are posted before or on each trading day (we usually post them before the opening bell, but we don’t promise doing that each day). If there’s anything urgent, we will send you an additional small alert before posting the main one.
Thank you.
Przemyslaw K. Radomski, CFA
Founder, Editor-in-chief

