

Since Friday, the USD Index extends increases and makes up for lost points. Looking at the daily chart you can even conclude that the bulls use every opportunity to push away their opponents from the recent lows. Why are they so important to them? We took a closer look at the situation and we already know the Achilles’ heel of the bulls. Do you also want to know it? We invite you to read today's alert.
Focus on the USD Index
Before we analyze the recent changes in our currency pairs, we decided to take a closer look at the current situation in the USD Index as it is the key driver who generates the major changes on the currency market.
Let's move back one month to the past (charts courtesy of http://stockcharts.com).
In our Forex Trading Alert posted on January 24, 2018, we wrote the following:
(...) if the support area around 89 doesn’t stop declines in the USD Index, the next downside target for the bears will be likely the 61.8% Fibonacci retracement (around 88.44) based on the entire 2014-2017 upward move).
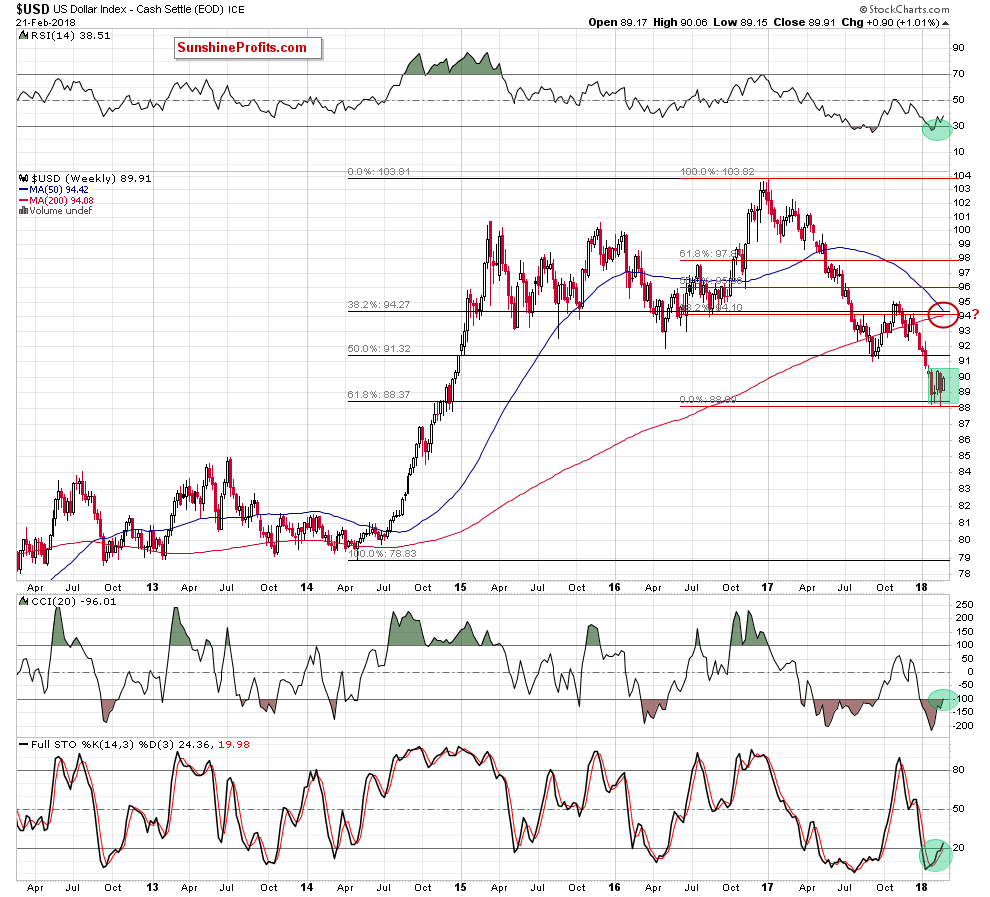
From today’s point of view, we see that the situation developed in line with the above scenario and the USD Index slipped to our downside target on the following day. Although currency bulls triggered a rebound, the combination of resistances (we will write more about it a bit later) encouraged their opponents to fight once again, which resulted in a re-test of this key support.
Why this retracement is so important for the greenback? Let’s take a look at the long-term chart below to find out.
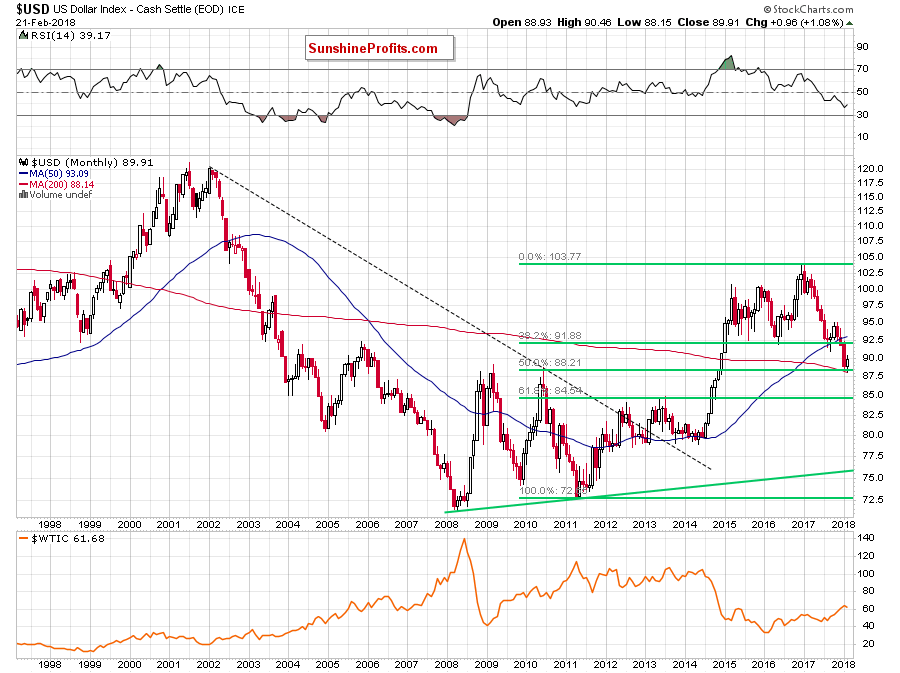
From this perspective, we see that this level/area is also reinforced by the 50% Fibonacci retracement based on the entire 2011-2017 upward move and the 200-month moving average.
This means that currency bears reached the most important fortress of the bulls and both opponents realize that if it is torn down, the road to the 2013 peaks and the next retracement will be open. With this in mind, it is not difficult to understand the increased involvement of the bulls in recent days.
Where did the last increases took the USD Index? Let’s examine the daily chart below.
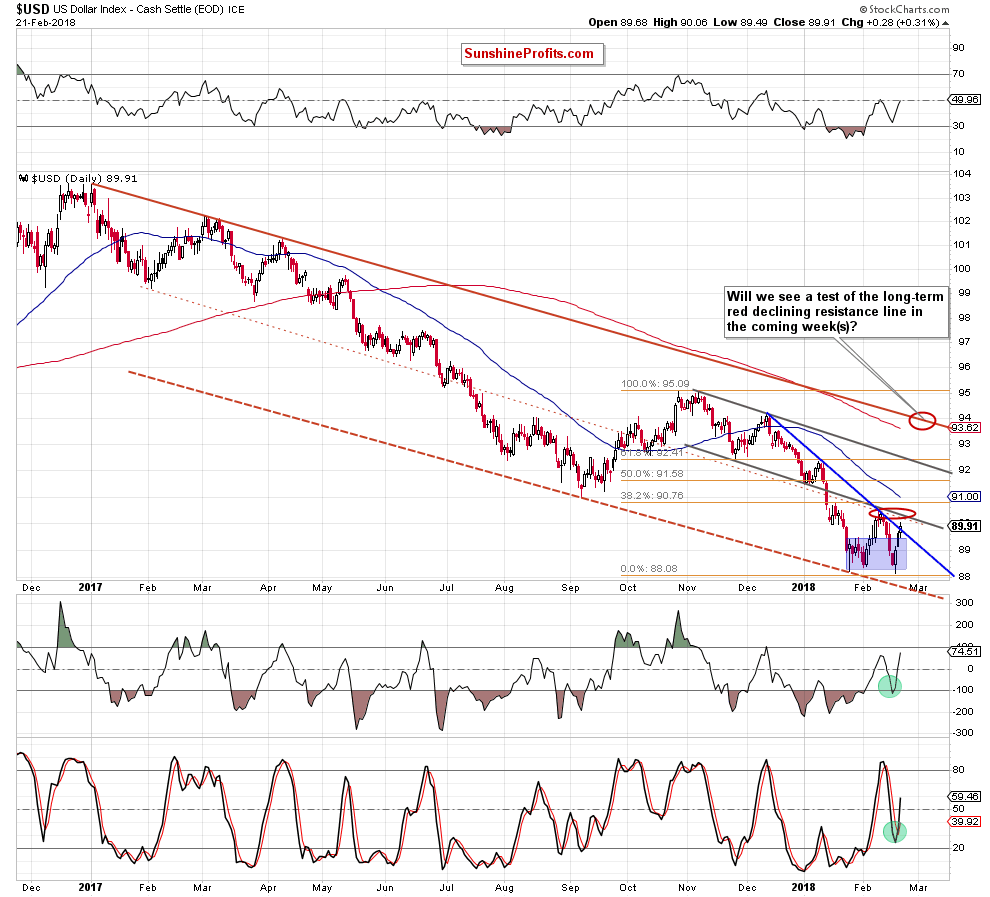
Looking at the above chart, we see that the highlight of yesterday's session (in terms of technical analysis) was the breakout above the short-term blue declining resistance line based on the mid-December 2017 and January 2018 peaks. It’s quite bullish development – especially when we factor in the fact that this resistance line stopped the bulls at the beginning of the month, triggering a reversal and declines to a fresh 2018 low.
And speaking about this reversal… one of the first questions that came to our minds: whether this line stopped further increases or the lower line of the grey declining trend channel was more important for the bears? Looking back, you can quickly answer: it's easy - the bulls stopped the combination of these lines. However, the situation seems a bit more complicated today. Why? On one hand, the greenback broke above the blue resistance line, but on the other hand, the index still remains under the grey trend channel.
The buy signals generated by the daily indicators suggest that currency bulls will at least try to break above this resistance in the coming day(s). Nevertheless, in our opinion, a bigger move to the upside will be more reliable if the index closes one of the following sessions above the lower line of the grey declining tend channel and invalidates the earlier breakdown. In this case, we we’ll likely also see a test of the 38.2% Fibonacci retracement, which intersects the upper line of the green consolidation marked on the weekly chart. If the bulls manage to break above this first important resistance area, they will confirm that the worst is behind them and higher values of the greenback are just around the corner.
Until this time, another reversal from around 90.33-90.76 can’t be ruled out. How such price action could affect the euro, the Canadian dollar and the Swiss franc? Let’s take a closer look at the charts below and find out.
EUR/USD
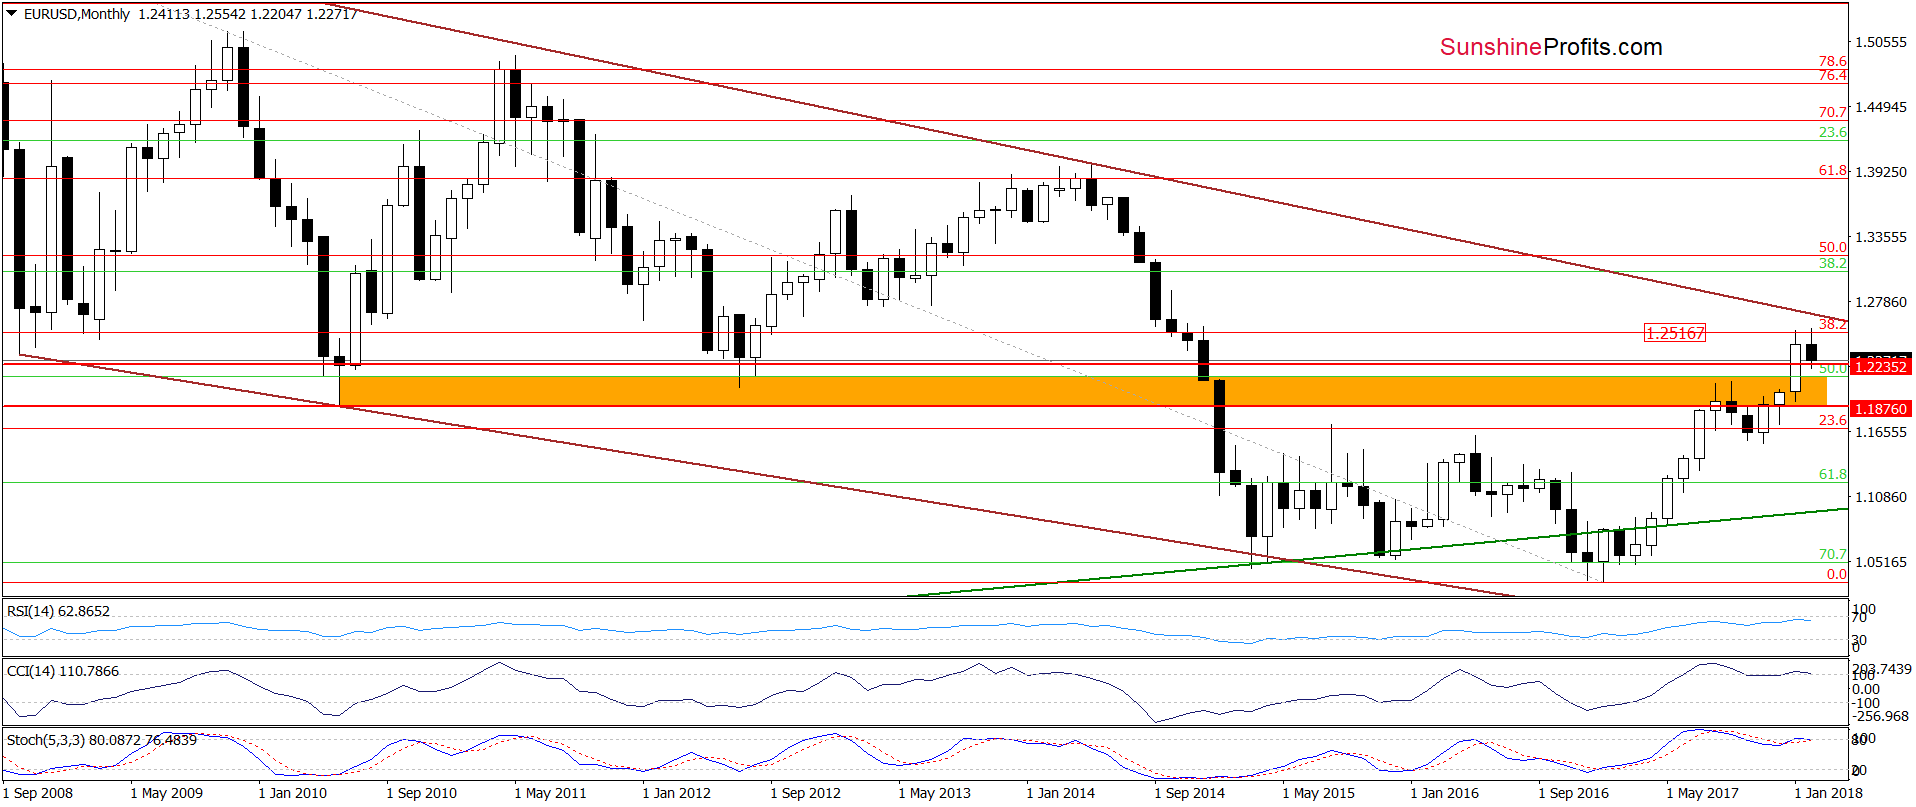
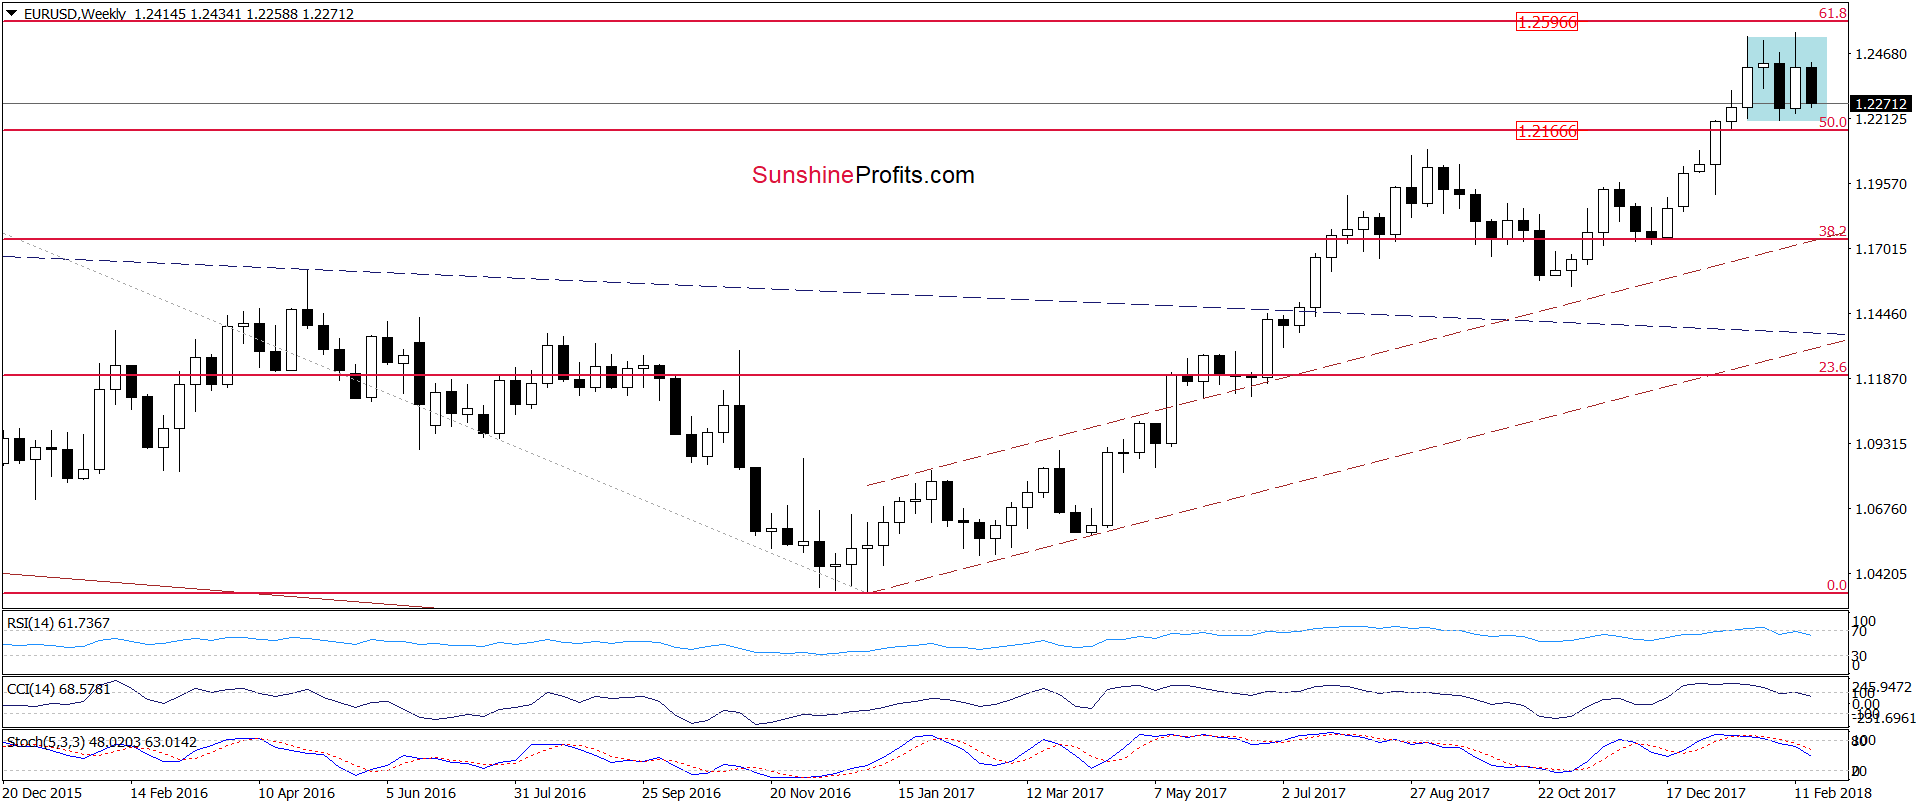
From the broader perspective, we see that the overall situation hasn’t changed much as EUR/USD remains in the blue consolidation under the previously-broken 38.2% Fibonacci retracement. This means that an invalidation of the earlier breakouts (above the retracement and the upper line of the blue consolidation) and its negative impact on the value of EUR/USD are still in effect, supporting currency bears.
Additionally, the sell signals generated by the medium-term indicators remain in the cards, suggesting that a bigger move to the downside is just a matter of time. But will we see a reversal in the very near future, which will be equal to a potential short-lived decline in the USD Index? Let’s examine the daily chart to find out.
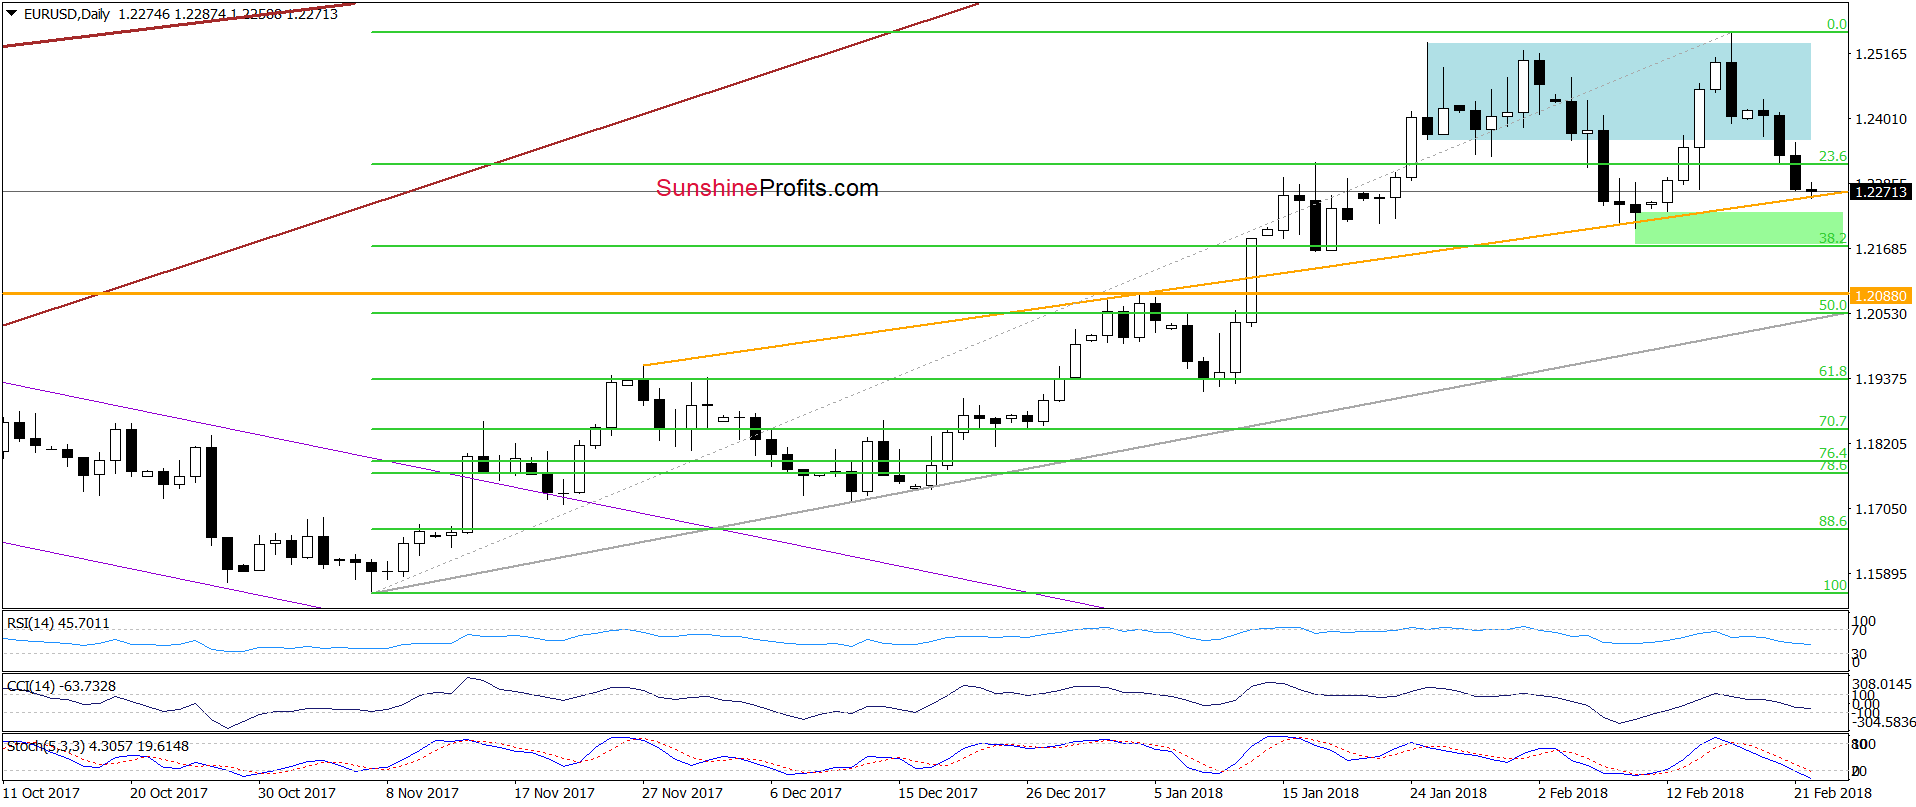
In our Forex Trading Alert posted on Friday, we wrote the following:
(…) we think that another move to the downside is just ahead of us (…) the first downside target will be (…) the orange support line (based on the November and early January highs).
From the very short-term perspective, we see that the situation developed in tune with our assumptions and currency bears took EUR/USD to our first target earlier today. Although this is a positive news for the bears, we should keep in mind that this support line was strong enough to stop declines two weeks ago and trigger an upward move in the following days. This suggests that a rebound from here can’t be ruled out. Nevertheless, this time the indicators have some more space, which could result in a breakdown. If we see such price action, and EUR/USD closes today’s or one of the following sessions under the orange line, currency bears will likely check their opponents’ strength not only around the recent lows, but also around the 38.2% Fibonacci retracement.
USD/CAD
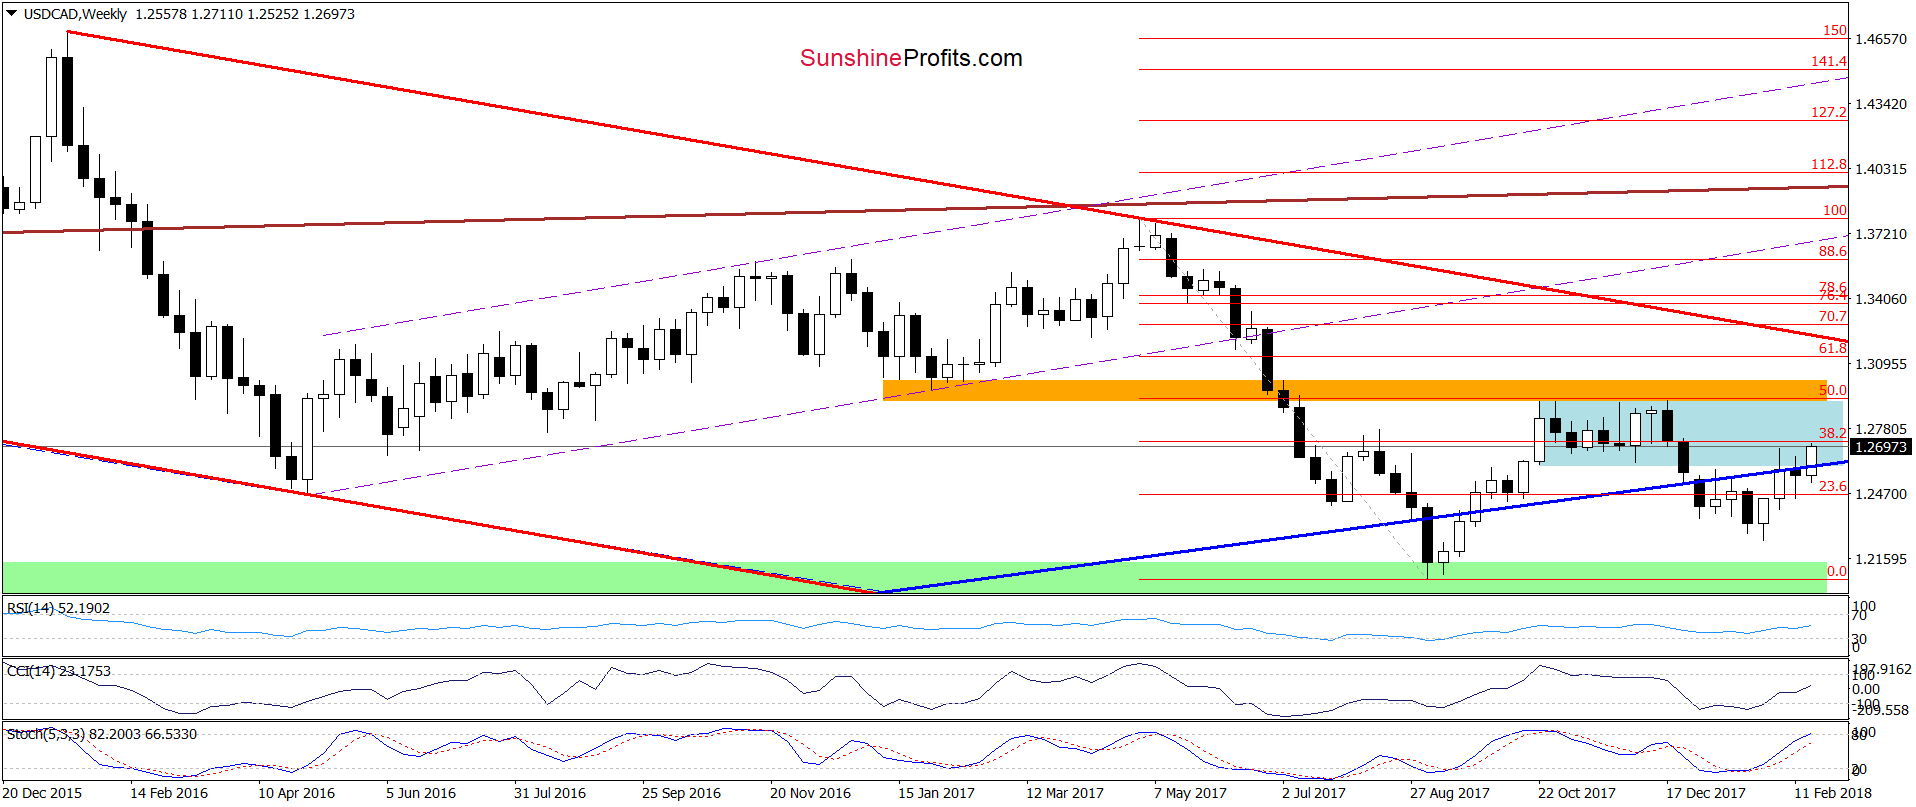
The first thing that catches the eye on the medium-term chart is an invalidation of the breakdown under the long-term blue support line and the lower border of the blue consolidation. Taking this bullish development into account and combining it with the buy signals generated by the indicators, it seems that USD/CAD will extends gains in the coming week(s).
But are there any short-term resistances, which will be able to thwart the pro-growth plans?
Before we answer this question, we would like to comment the recent price action and recall the last commentary on this currency pair:
(…) the pair came back into the consolidation and climbed to the very short-term resistance line based on the previous highs. Let’s be honest, this line is not the strongest resistance, but when we zoom out our picture, we’ll notice that this area is also reinforced by the previously-broken long-term blue resistance line. (…)
Nevertheless, taking into account the buy signals generated by the daily indicators, we think that currency bulls will try to fight for higher prices in the coming day(s). If they succeed, we’ll see at least a test of the 61.8% Fibonacci retracement and the February peak.
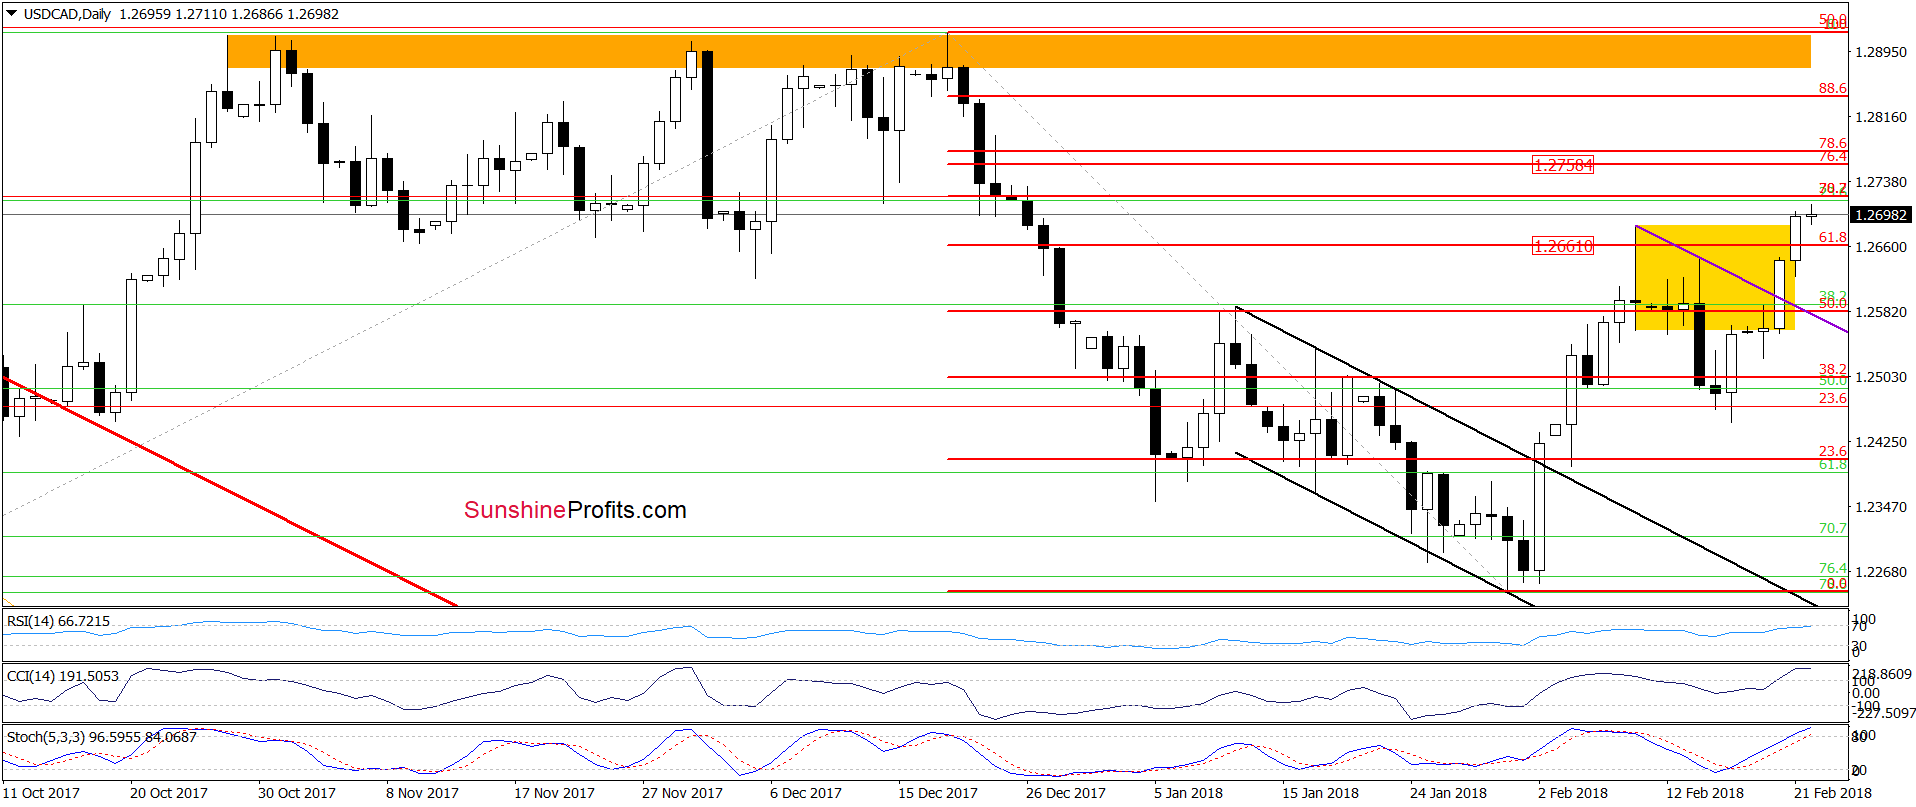
As you see on the daily chart currency bulls pushed USD/CAD higher (as we had expected), which resulted in not only a test of the above-mentioned targets, but also in a breakout above them. As we mentioned earlier, this positive development took the exchange rate above the long-term blue resistance line, which suggests that the pair can increase to around 1.2758-1.2774 (the resistance area created by the 76.8% and 78.6% Fibonacci retracements) in the coming days.
Finishing today’s commentary on USD/CAD, please keep in mind that the current position of the indicators suggests that the space for gains may be limited in the very near future as they increased to their overbought areas.
USD/CHF
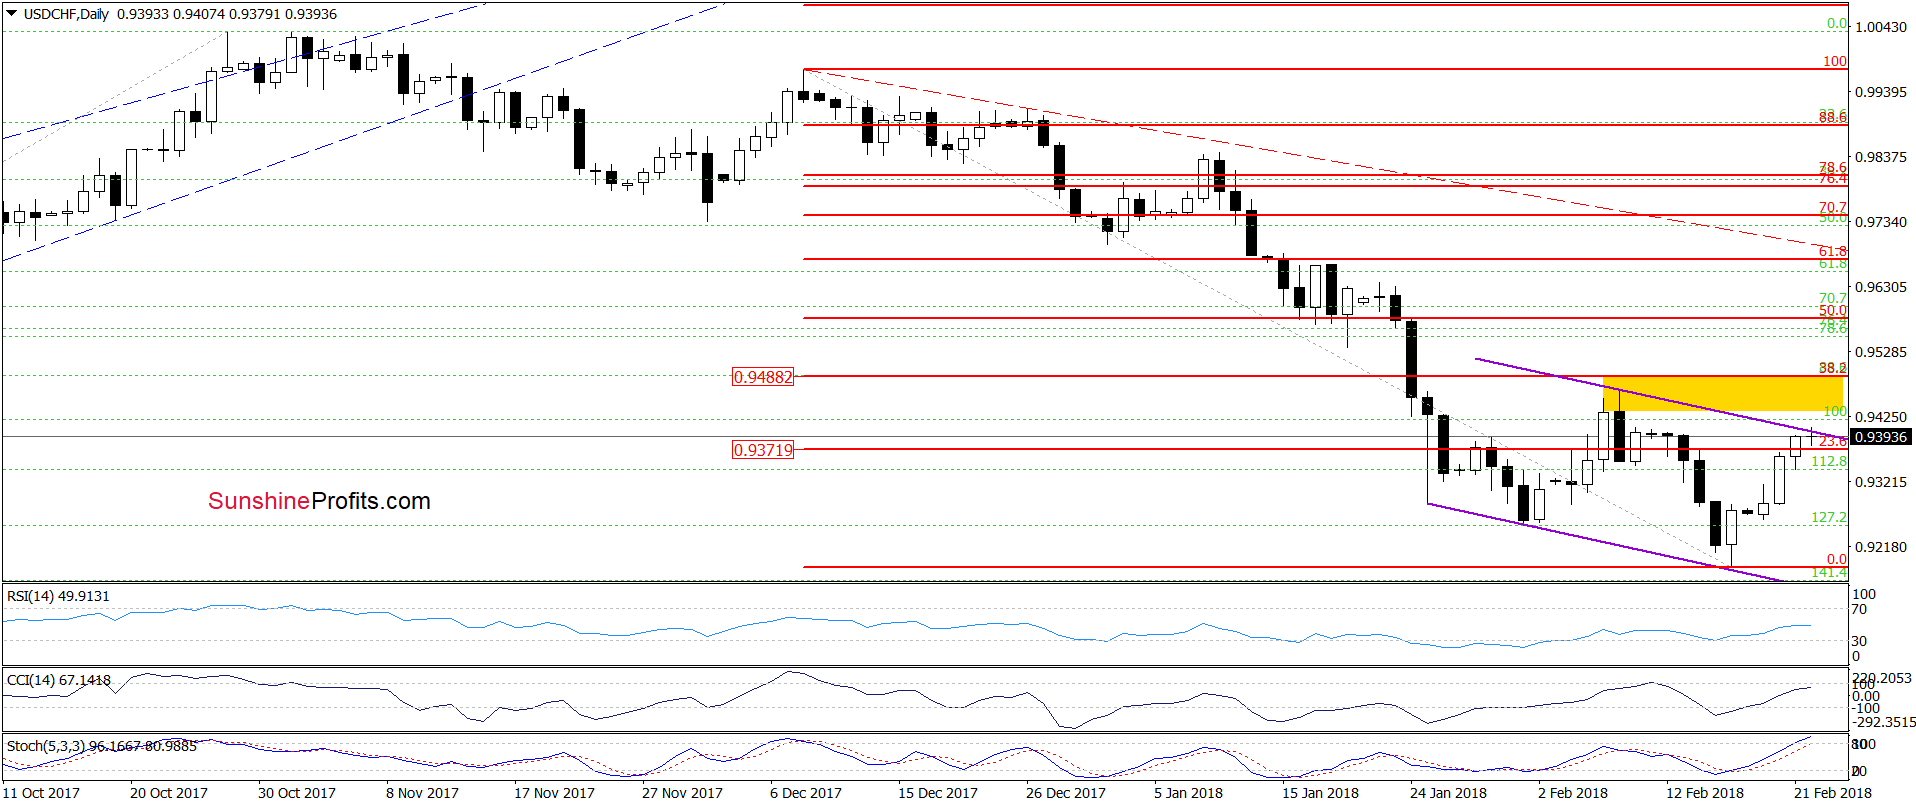
Quoting our Tuesday's alert:
(…) the situation developed in line with the above scenario and USD/CHF rebounded after a drop to the purple support line. Additionally, all daily indicators generated the buy signals, which suggests that (…) currency bulls will likely take USD/CHF to the yellow resistance zone created by the February highs and the 38.2% Fibonacci retracement in the following days.
As you see on the daily chart, currency bulls extended gains, but they climbed to the upper border of the very short-term purple declining trend channel. Therefore, in our opinion, the climb to our upside target will be more likely if we see a breakout above this resistance line. Will the bulls be strong enough to show us such price action? Looking at the current position of the daily indicators this pro-growth scenario seems quite likely as they haven’t generated the sell signals. Nevertheless, similarly to what we wrote in the case of our previous currency pairs, the space for gains seems limited.
Naturally, the above could change in the coming days and we’ll keep our subscribers informed, but that’s what appears likely based on the data that we have right now. If you enjoyed reading our analysis, we encourage you to subscribe to our daily Forex Trading Alerts.
Thank you.
Nadia Simmons
Forex & Oil Trading Strategist
Przemyslaw Radomski, CFA
Founder, Editor-in-chief, Gold & Silver Fund Manager
Gold & Silver Trading Alerts
Forex Trading Alerts
Oil Investment Updates
Oil Trading Alerts
