

The price of gold is likely to soar. This is what recent the CoT report suggests. At least, people say so. But what do you think?
CoT Gold Report Revealed Something Unusual in August 2018
Many of our Readers have been asking about the recent traders’ position at the Comex. Because we care about investors, we decided to analyze the latest CoT report, which presents the gold futures positions. As a reminder, it is one of the most important publications about the U.S. futures market, including the precious metals market. Although it is issued on Friday with a three day lag, it is a valuable publication, which provides investors with a breakdown of open interest positions, showing the market sentiment.
Let’s take a look at the chart below, which shows the gold futures and options combined traded at Comex. It indicates that non-commercials (speculators; red line) were net long and tended to follow gold prices, while commercials (green line) were net short and generally moved in the opposite direction to the gold prices.
Chart 1: Gold prices (yellow line, right axis, London P.M. fixing, in $), net position of commercials (green line, left axis) and net position of non-commercials (red line, left axis) from January 2017 to August 2018 (aggregate version, futures and options combined).
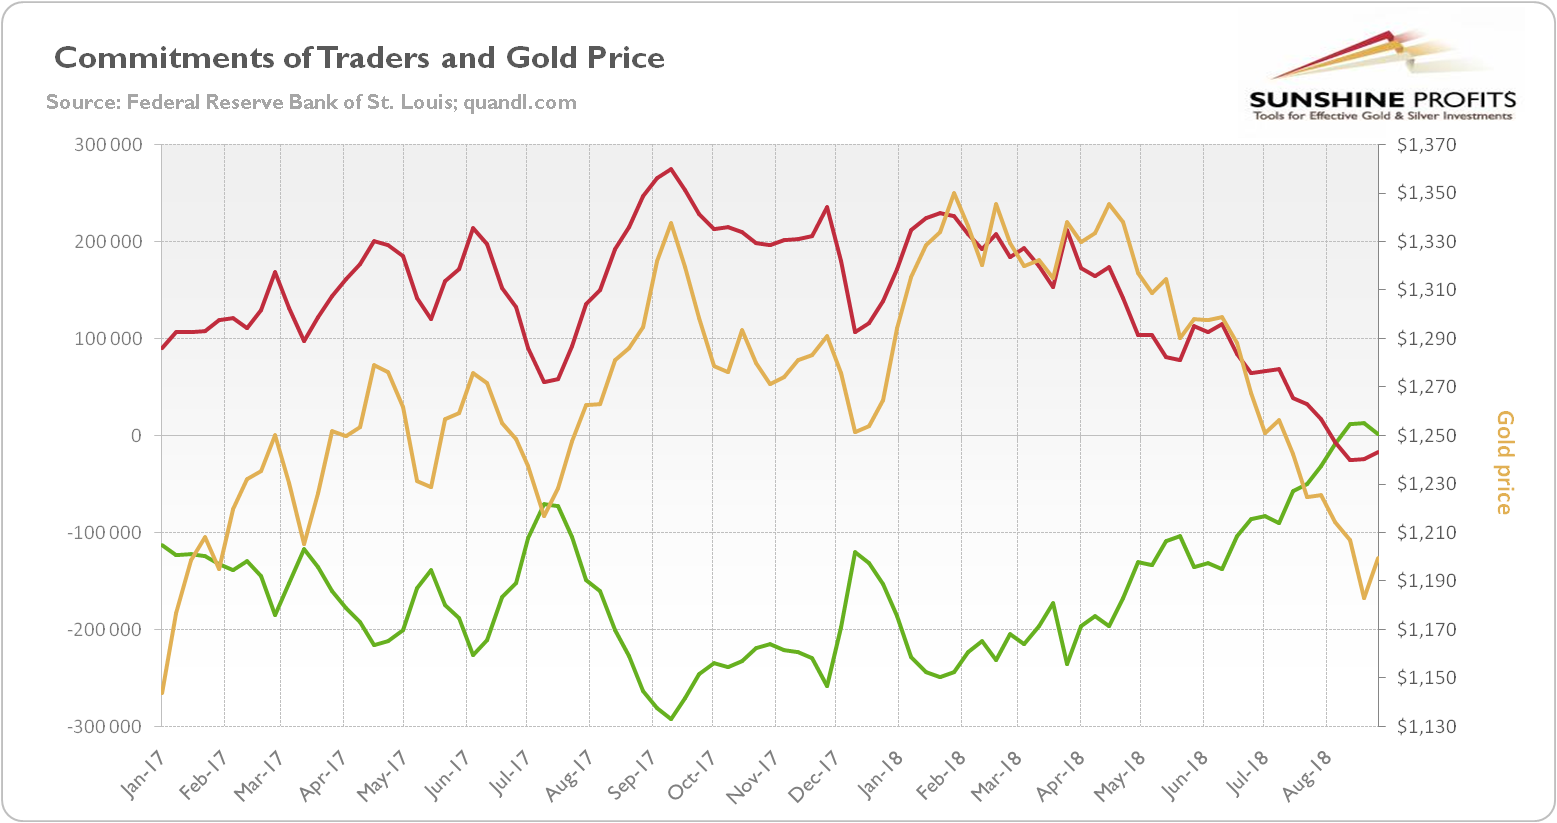
If they look to you like mirror reflections, that’s what they should look like. Commercials and non-commercials are two sides of the trade. If some are long, then the rest must be short. As commercials hedge against the changes in gold prices, their net position typically moves contrary to the price of the yellow metal. Hence, as commercials take the opposite side of the trade, their net position usually moves in tandem with the gold prices.
OK, now look again at the chart. What do you see? Is there something unusual? There is! The non-commercial players are short now, while the commercial traders are long now. Indeed, in 2018, speculators have been gradually reducing their net long positions. And in August, they finally turned from a bullish stance to scared short. Conversely, the commercial participants have been systematically cutting their bearish net position to become long last month.
Implication for Gold
What does it mean for the gold market? Well, the recent developments in the gold futures market seem to be bullish. Why? This is because speculators are usually most bullish prior to significant price tops and most bearish before significant price bottoms. And now they are exceptionally bearish, which suggests that the price bottom might be close.
However, investors should be careful. The CoT positions are a good sentiment indicator in the gold market, but they should not be used as a timing indicator. The reason is that the sentiment generally follows gold prices. It means that traders are usually extremely pessimistic near a price bottom. But it does not mean that an extreme pessimism causes the price bottom. What we know is that when we see a bottom, it will be associated with a radical bearish mood. But it does not say anything about the timing of the turning point.
Moreover, it’s not clear how extreme positions in the CoT report are extreme enough to trigger a reversal – this varies from rally to rally and from decline to decline and it makes it difficult to use this report for timing a really long-term bottom.
Hence, the current mood does not necessarily imply that the low is close. Another problem is that extreme pessimism and optimism vary over time – the current extreme positioning is not the most bearish. Actually, speculators were consistently net short in the period of 1996-2001.
Moreover, the current fundamental outlook is quite bearish for gold, which means that the price bottom may be still ahead us. If we bet based on the recent history, we would say that the gold prices will remain in the bearish mood at least until the September FOMC statement. The yellow metal needs some trigger to reverse its downward trend and that crucial Fed meeting might be such an event. Stay tuned!
If you enjoyed the above analysis, we invite you to check out our other services. We provide detailed fundamental analyses of the gold market in our monthly Market Overview reports and we provide daily Gold & Silver Trading Alerts with clear buy and sell signals. If you’re not ready to subscribe yet and are not on our gold mailing list yet, we urge you to sign up. It’s free and if you don’t like it, you can easily unsubscribe. Sign up today!
Disclaimer: Please note that the aim of the above analysis is to discuss the likely long-term impact of the featured phenomenon on the price of gold and this analysis does not indicate (nor does it aim to do so) whether gold is likely to move higher or lower in the short- or medium term. In order to determine the latter, many additional factors need to be considered (i.e. sentiment, chart patterns, cycles, indicators, ratios, self-similar patterns and more) and we are taking them into account (and discussing the short- and medium-term outlook) in our trading alerts.
Thank you.
Arkadiusz Sieron, Ph.D.
Sunshine Profits‘ Gold News Monitor and Market Overview Editor
Gold News Monitor
Gold Trading Alerts
Gold Market Overview
