

The USD Index practically erased its Thursday's losses, and the precious metals faced stiff headwinds. Silver again outperformed gold, adding more strength to the signal it's flashing for quite a few days already. Yet, it was gold that gets the crown for presenting us with action of significance.
We'll start today's analysis with the very interesting short-term action in the USD Index. It rallied as we had expected it to.
USD's Pattern in the Making
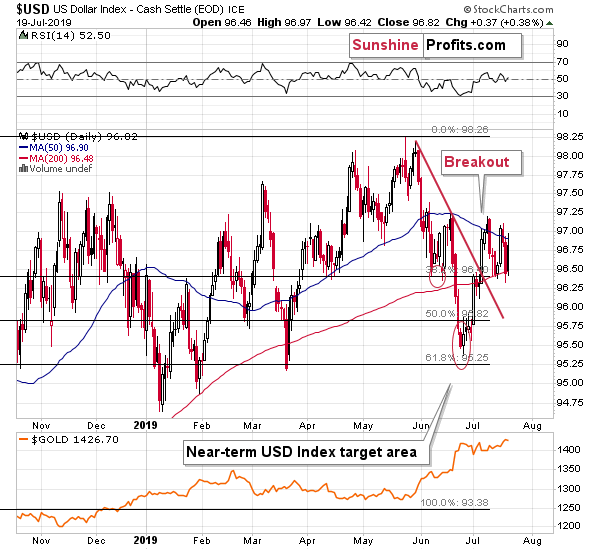
The USD chart shows that the inverse head-and-shoulders pattern is developing in a symmetrical manner, which makes the pattern even more believable. Just as we saw two smaller bottoms in the first half of June, we are seeing similar bottoms right now. The USD moved higher today, so the pattern is developing in a rather clear way. If the symmetry continues to be as perfect as it's been recently, what we saw on Thursday, was the final bottom before the powerful upswing.
The USD Index formed a bullish reversal, which means that the post-breakout pullback may already be over. If we see higher USD values here - and we are likely to see them - then the USD might soon complete an inverse head and shoulders pattern. The early June bottom would be the left shoulder and the current bottom would be the right shoulder. This pattern - if it is completed - would imply a rally at least as big as the size of the "head" of the pattern starting from the "neck". The head's size is about 1.9, and the neck is at about 97.2, which implies an upside target of at least 99.1. This means a breakout to new 2019 highs, and then higher because of the long-term USD chart implications.
Let's take a look what changed from the long-term point of view. After all, gold, silver, and mining stocks soared and thus it had to change something, right? Well, not really.
The Big Picture in Gold and Silver
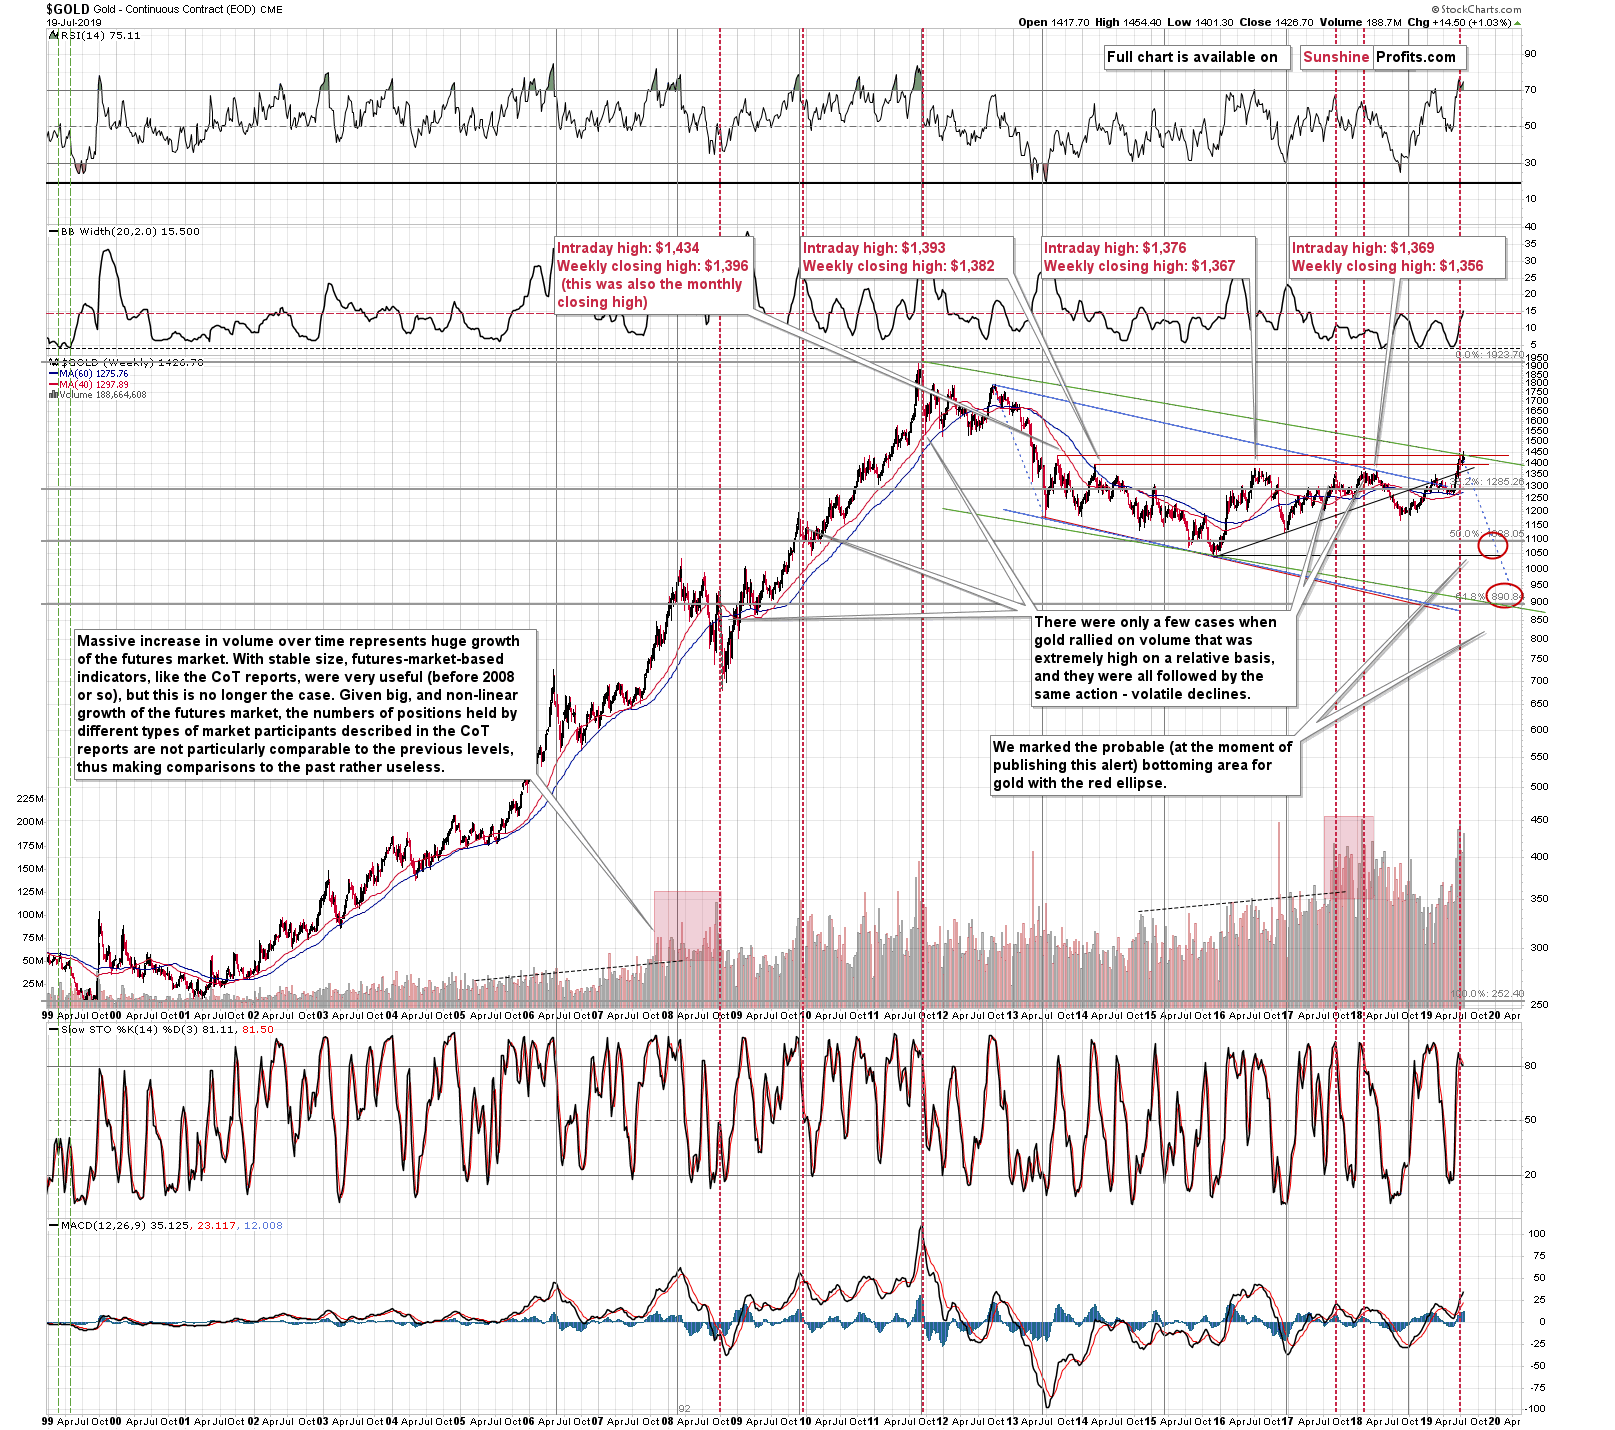
Gold made another attempt to break above the late 2013 high and it once again failed to do so. Gold closed visibly below the late-2013 intraday high. All this - the rally, gold's breakout, and its subsequent invalidation were accompanied by huge volume, which is a very strong confirmation that this indeed is the top in the making. The red vertical lines that you see on the above chart are the weeks when gold rallied on exceptionally strong volume. They were practically all major tops. These signals may have not been 100% precise (the top might have formed a bit later or a bit higher, but it was insignificantly so), but these cases were excellent gold short selling opportunities and at the same time extremely bad moments to be buying gold. It's not visible on the above chart, but these were also very bad moments to be buying silver or mining stocks as well.
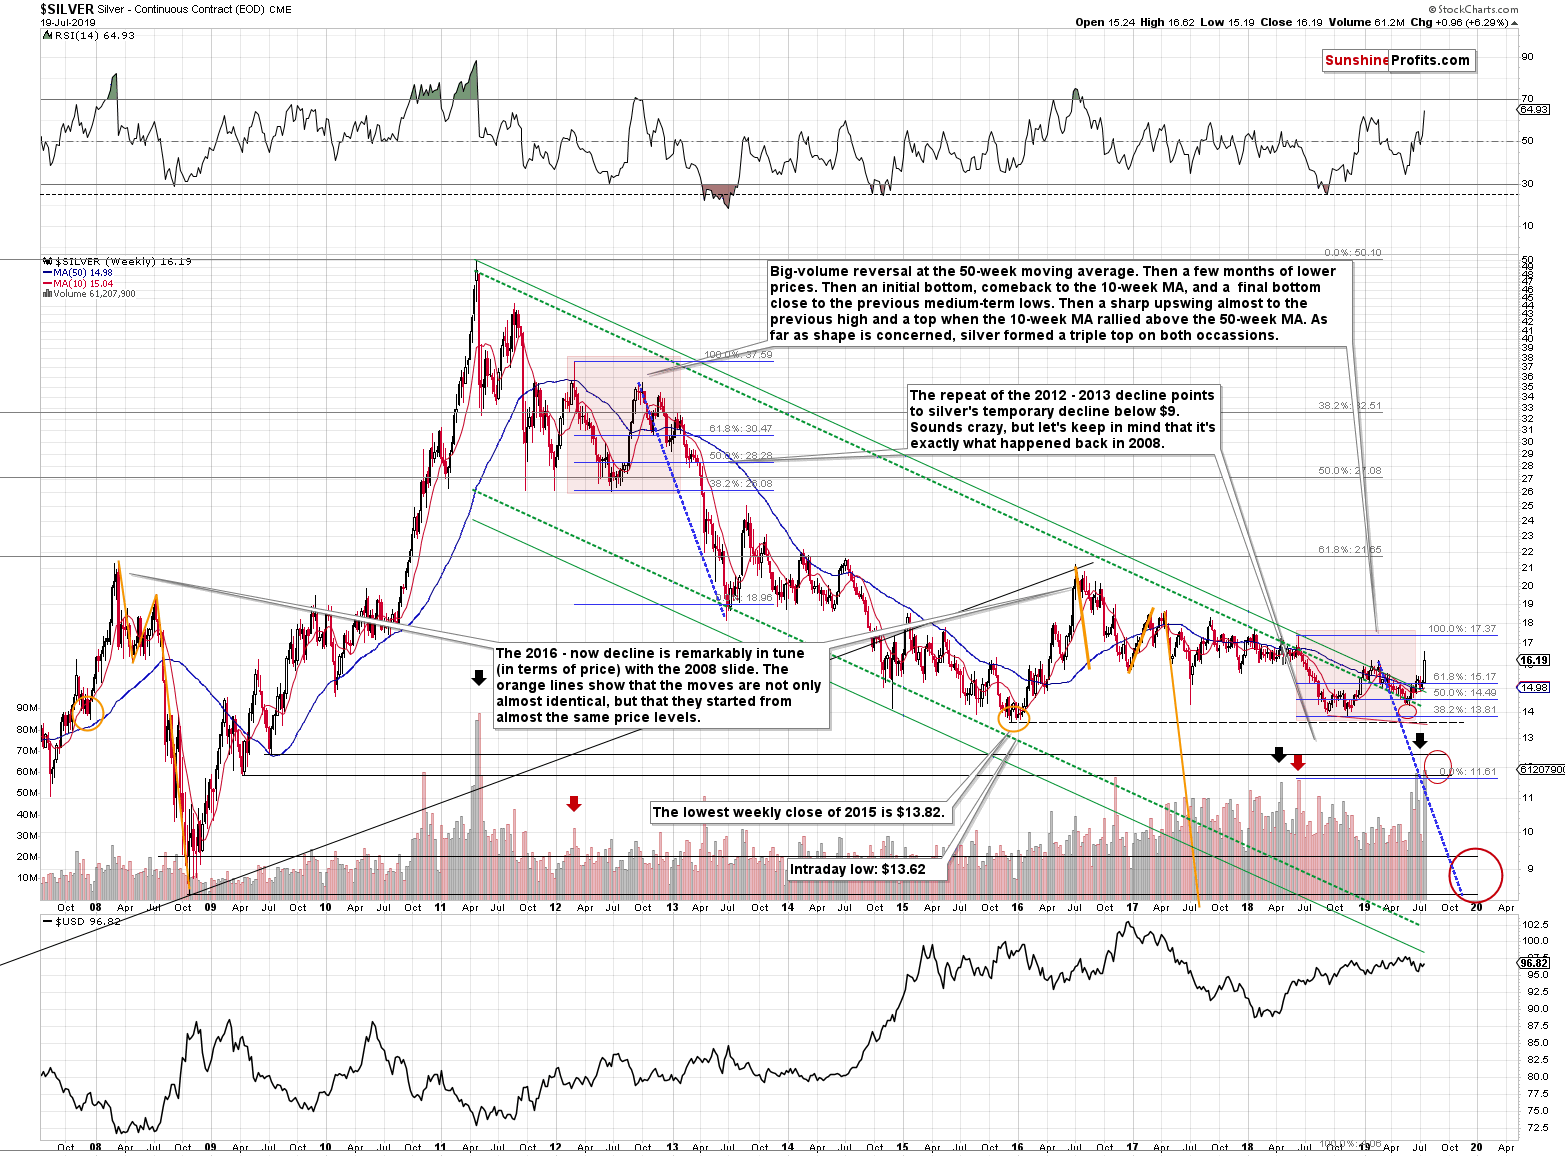
The white metal moved sharply higher recently and it took place on huge volume. It broke above the declining green resistance lines, but silver is (at least should be) known for its fake breakouts. Gold just failed to break above its late-2013 high and gold stocks rallied in close tune with their own late-2013 pattern, so silver's breakout shouldn't be taken at face value.
Silver's recent volume was exceeded only once in the past - in THE 2011 top. Back then, the huge volume confirmed the peak euphoria that accompanies tops. It's easy to get carried away from the logic and cold-fact analysis when things on the market get very hot, and volume shows just how hot the market has become. Those, who bought above $40 were probably not very happy about this decision despite the very short-term gains. The history is most likely about to repeat itself, and those who bought into the recent strength will not be happy with their purchases for long. On the bright side, this time, they will probably not have to wait a few years to see their position turn profitable. Still, in our opinion, these profits are unlikely to be even close to the enormous profits of those who chose to take advantage of the upcoming decline...
Before moving to the long-term HUI Index chart, please note how the major tops in silver are being formed at lower levels since 2016, with very little exceptions. The same was the case in 2011, 2012 and early 2013, before silver's massive slide.
Miners and the Long-Term Focus
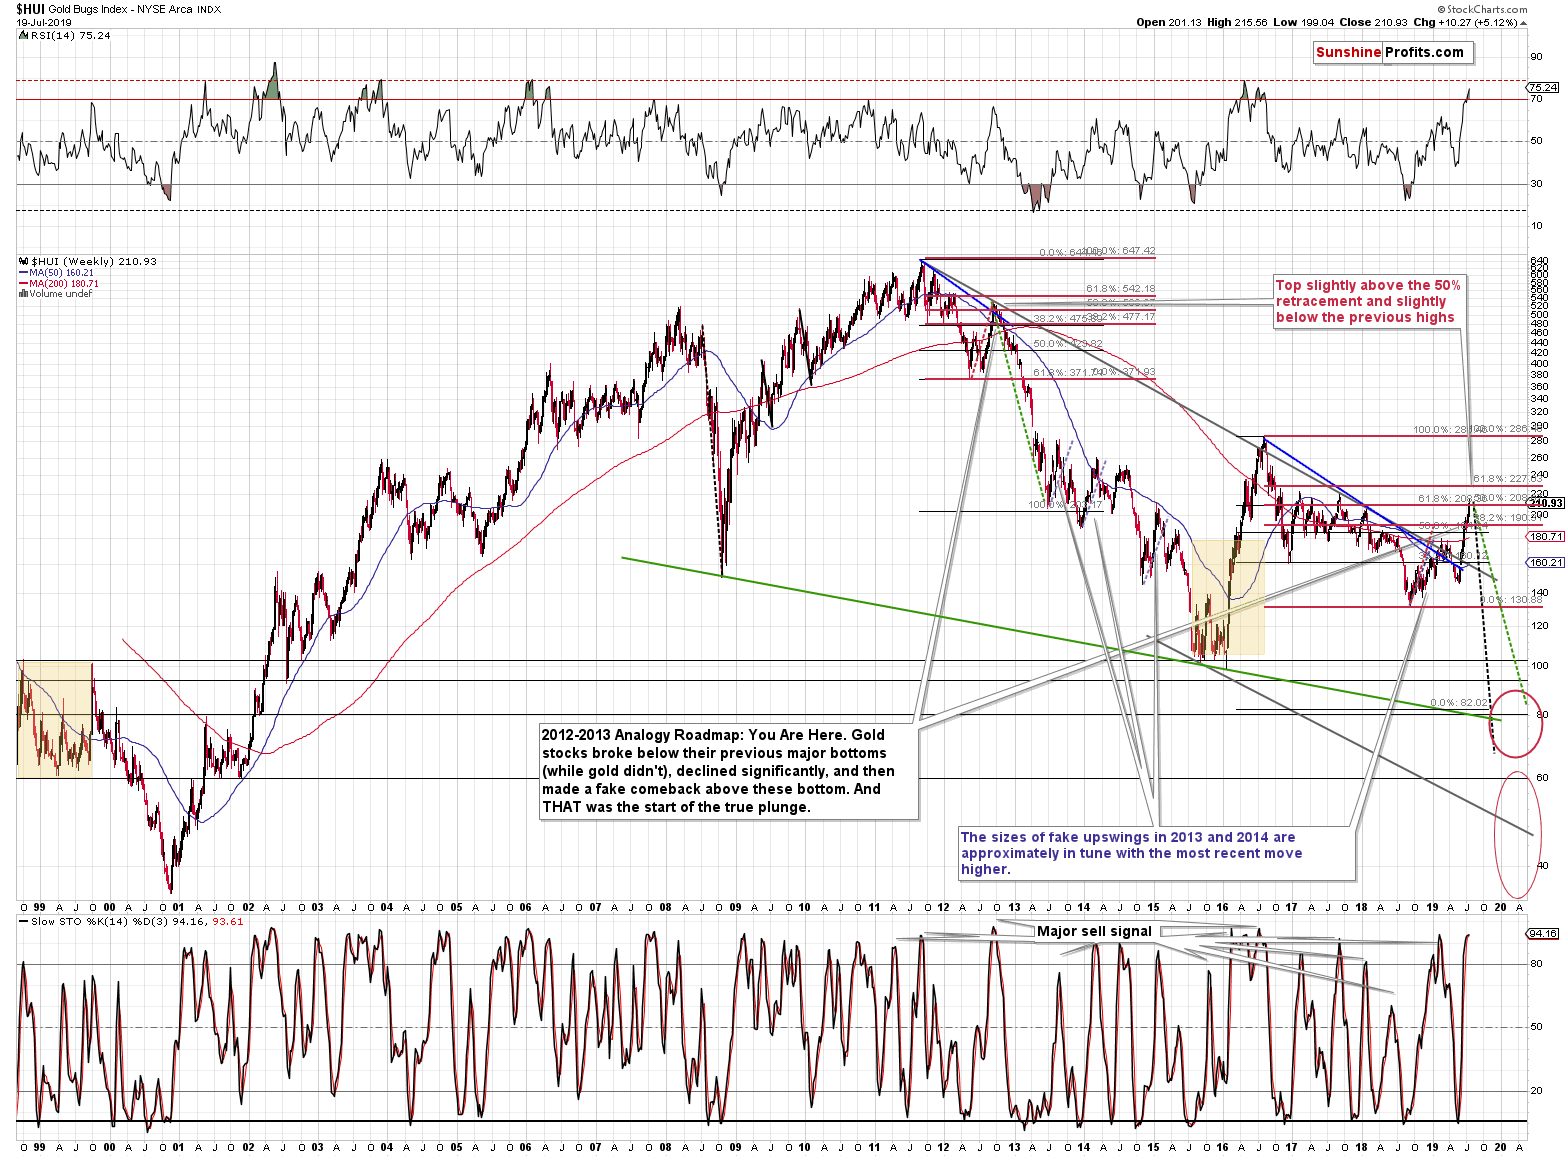
The above gold stock chart continues to highlight how similar the current situation is to what we saw in late 2012. People are very excited by gold miners' gains and the same was the case in 2012. Back then people were practically sure that gold and gold miners are going to move to new highs shortly. We have many investors and analysts thinking the same thing right now. What really followed in the past, was the biggest decline that we saw in the past several decades. In other words, our previous comments on the above chart, remain up-to-date:
Wednesday's upswing - although sharp on a day to day basis - remains in tune with the sharp yet temporary upswing of the late 2012. Back in late 2012, the HUI Index moved a bit above its 50% retracement of the preceding decline before the top was formed. The analogous retracement is currently at about 208. Wednesday's high in the HUI Index was 208.07 - very close to the 50% retracement. In 2012, the 50% retracement was temporarily broken before the top formed, so a move even higher here would not change that much in terms of the similarity to the past move.
Indeed, the miners powered higher on Thursday and reached over 215, before pulling back below 211 on Friday. Such action is in line with what we saw back in 2012.
What made the situation likely to repeat itself? This is what generally tends to happen in the market. Not every time, but often enough to make it worth one's while to look for the similarities. The more similar the moves are, the more likely it is that the follow-up action will be similar as well. Please note that the shape of the 2018 - now rally is also similar to the one that we saw in 2012. The entire rally consisted of two parts that were separated by a decline that started from the 200-week moving average (marked with red). The second rally was sharper and bigger than the initial one. We see the same thing right now. In Wednesday's regular Alert, we emphasized the similarity with regard to volume in silver - the late-2012 top was one of the cases that were similar to the current situation.
Of course, just as it was the case in late 2012, we now have multiple analysts and investors that are convinced that the entire precious metals market is taking off to new highs. But will this really be the case? We doubt it.
Before looking at the short-term changes, please consider the current breakout above 200 and how similar it is to the early 2016 breakdown below the 100 level. Both numbers are very round and in both cases, gold miners moved to new extremes even though gold didn't. In 2016, the fake breakdown meant the start of the biggest rally in years. With the current strength, are we about to see the biggest decline in years? This appears very likely, also based on silver's outperformance and SLV's epic volume that we discussed a short while ago.
The rally is now practically just as big as it was in the late 2012 - naturally in relative terms. The HUI Index is slightly above the 50% Fibonacci retracement, not yet at the 61.8% retracement, and a bit below the previous highs. In this case, these are the 2017 highs, and in the past, these were the early 2012 highs.
Summary
Summing up, these are not pleasant times for anyone who refuses to jump on the bullish bandwagon just because prices are moving higher, but what's profitable is rarely the thing that feels good initially. The relative strength in the silver market is a factor that's beyond bearish, while the strength in gold stocks appears just as misleading as their weakness was back in early 2016. Gold has just invalidated its breakout above the previous highs, the late-2013 highs, and the upper border of the pennant pattern, which is a very strong bearish sign.
Today's article is a small sample of what our subscribers enjoy regularly. For instance today, we have shared the short-term perspective across gold, silver and miners. We also commented on Friday's key development in gold that spurred a new trading decision. To keep informed of both the market changes and our trading position changes exactly when they happen, we invite you to subscribe to our Gold & Silver Trading Alerts today.
Thank you.
Przemyslaw Radomski, CFA
Editor-in-chief, Gold & Silver Fund Manager
Sunshine Profits - Effective Investments through Diligence and Care
