

On Monday, official data showed that Chinese demand for crude oil declined in July, which together with a stronger U.S. dollar and concerns over a rise in OPEC output weighed on investors’ sentiment and pushed the price of the black gold lower. As a result, light crude lost 2.52% and closed the day below $48. How low could the commodity go in the coming days?
Crude Oil’s Technical Picture
Let’s take a closer look at the charts and find out (charts courtesy of http://stockcharts.com).
Quoting our Monday’s alert:
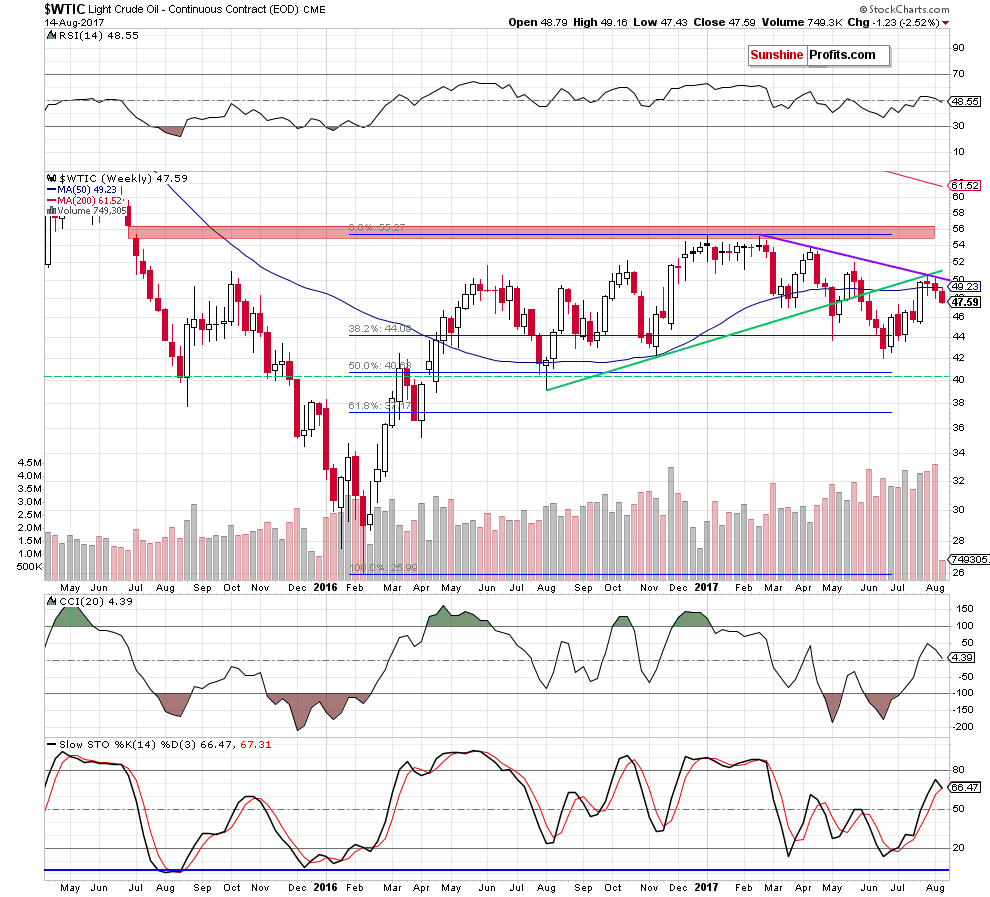
(…) the medium-term green line and the purple declining resistance line continued to keep gains in check in the previous week. Additionally, crude oil closed the week under the previously-broken 50-week moving average, which together with the size of volume, which accompanied last week’s decline suggests that further deterioration is just around the corner.
From today’s point of view, we see that the situation developed in line with the above scenario and crude oil extended last week losses. What’s interesting, when we take a closer look at the above chart, we can notice that the commodity increased slightly before the decline, which looks like a verification of the breakdown under the 50-week moving average (a bearish development).
How did this drop affect the very short-term picture? Let’s check.
Yesterday, we wrote the following:
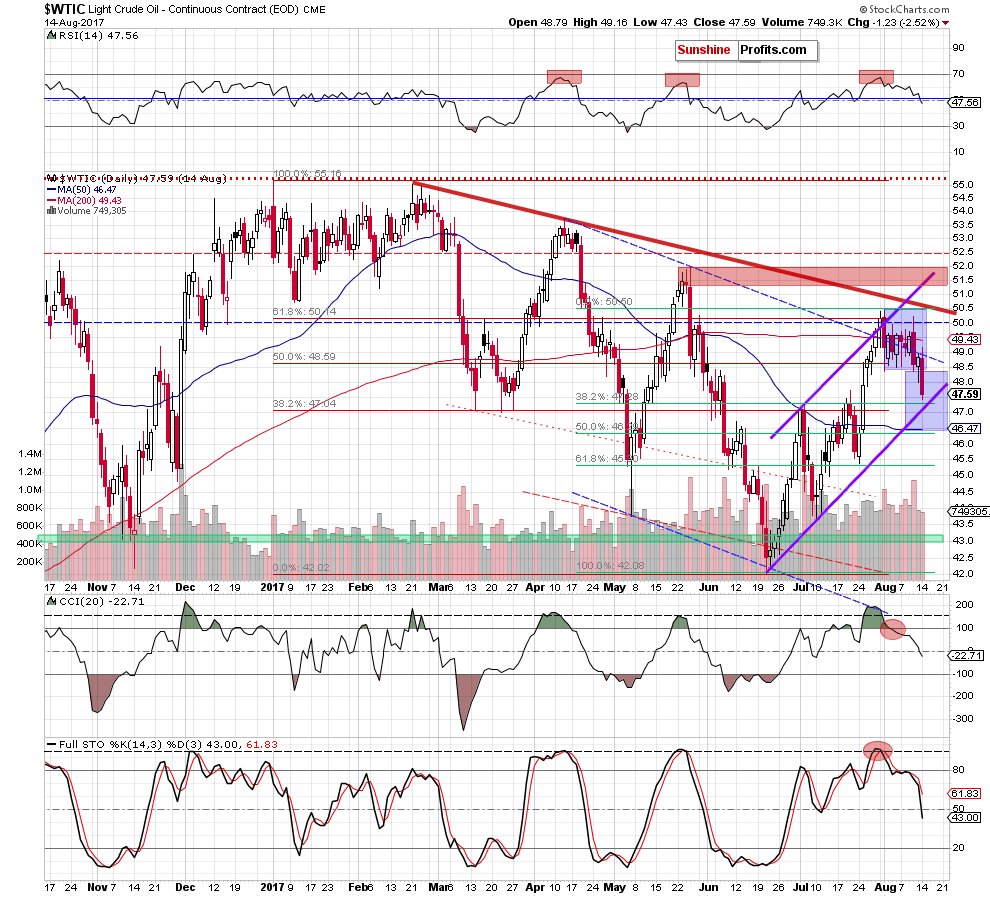
(…) the commodity invalidated the earlier breakdown, which is a positive development.
But is this as bullish as it seems at the first sight? In our opinion, it’s not. Why? Firstly, despite Friday’s move light crude remains under the resistance area created by the 61.8% Fibonacci retracement (based on the entire 2017 downward move), the barrier of $5, the 200-day moving average and the upper border of the purple rising trend channel. Secondly, the sell signals generated by the daily indicators are still in cards, supporting oil bears and lower prices of crude oil. Thirdly, Friday’s increase materialized on smaller volume than earlier declines, which suggests that oil bulls are not as strong as it seems.
Looking at the daily chart, we see that although crude oil moved a bit lower after the market’s open oil bulls didn’t manage to hold gained levels, which resulted in a pullback. Thanks to yesterday’s decline light crude dropped below the lower border of the blue consolidation, which together with the sell signals suggests further deterioration and the realization of our last week’s bearish scenario:
(…) How low could the commodity go?
If light crude moves lower from current levels, the first downside target will be the last week low, which creates the lower border of the blue consolidation (at $48.37). If it is broken, the next downside target for bears will be around $47.25, where the 38.2% Fibonacci retracement based on the entire recent upward move is. However, taking into account all negative above-mentioned factors, we think that light crude will move even lower and test (…) the 50% Fibonacci retracement (…)
Why? Because in this area the size of the downward move will correspond to the height of the blue consolidation. Nevertheless, before we see the realization of this scenario oil bears will have to push the price of the commodity below the lower border of the purple rising trend channel and the above-mentioned retracement.
Summing up, yesterday, crude oil verified the breakdown under the 50-week moving average and broke below the lower border of the blue consolidation, which opened the way to lower levels and made our short positions more profitable. Additionally, the sell signals generated by the indicators remain in cards, suggesting further deterioration in the coming days. Naturally, the above could change in the coming days and we’ll keep our subscribers informed, but that’s what appears likely based on the data that we have right now. If you enjoyed reading our analysis, we encourage you to subscribe to our daily Oil Trading Alerts.
Very short-term outlook: bearish
Short-term outlook: mixed with bearish bias
MT outlook: mixed
LT outlook: mixed
Thank you.
Nadia Simmons
Forex & Oil Trading Strategist
Przemyslaw Radomski, CFA
Founder, Editor-in-chief, Gold & Silver Fund Manager
Gold & Silver Trading Alerts
Forex Trading Alerts
Oil Investment Updates
Oil Trading Alerts
