

Gold and silver declined a bit yesterday, but mining stocks reversed and closed the session higher. It seems that the miners showed strength, especially that they formed a bullish reversal candlestick. But did they? The reversal candlesticks should be confirmed by strong volume and what we saw in the GDX ETF yesterday was the lowest daily volume of the year. In fact, the GDX volume was lower than any volume that we saw in 2018. And 2017. And 2016. And even 2015. The last time when we saw as low a volume was on May 21, 2014 (yes, exactly 5 years earlier). So, how should we read this price action?
It is not the reversal or relative strength that is the powerful signal from the GDX. It's the extremely low volume reading. What makes it so important right now, is that since March 2013 there were only four similar cases and they were all followed by exactly the same thing.
Quick declines.
Diving into the GDX Lessons
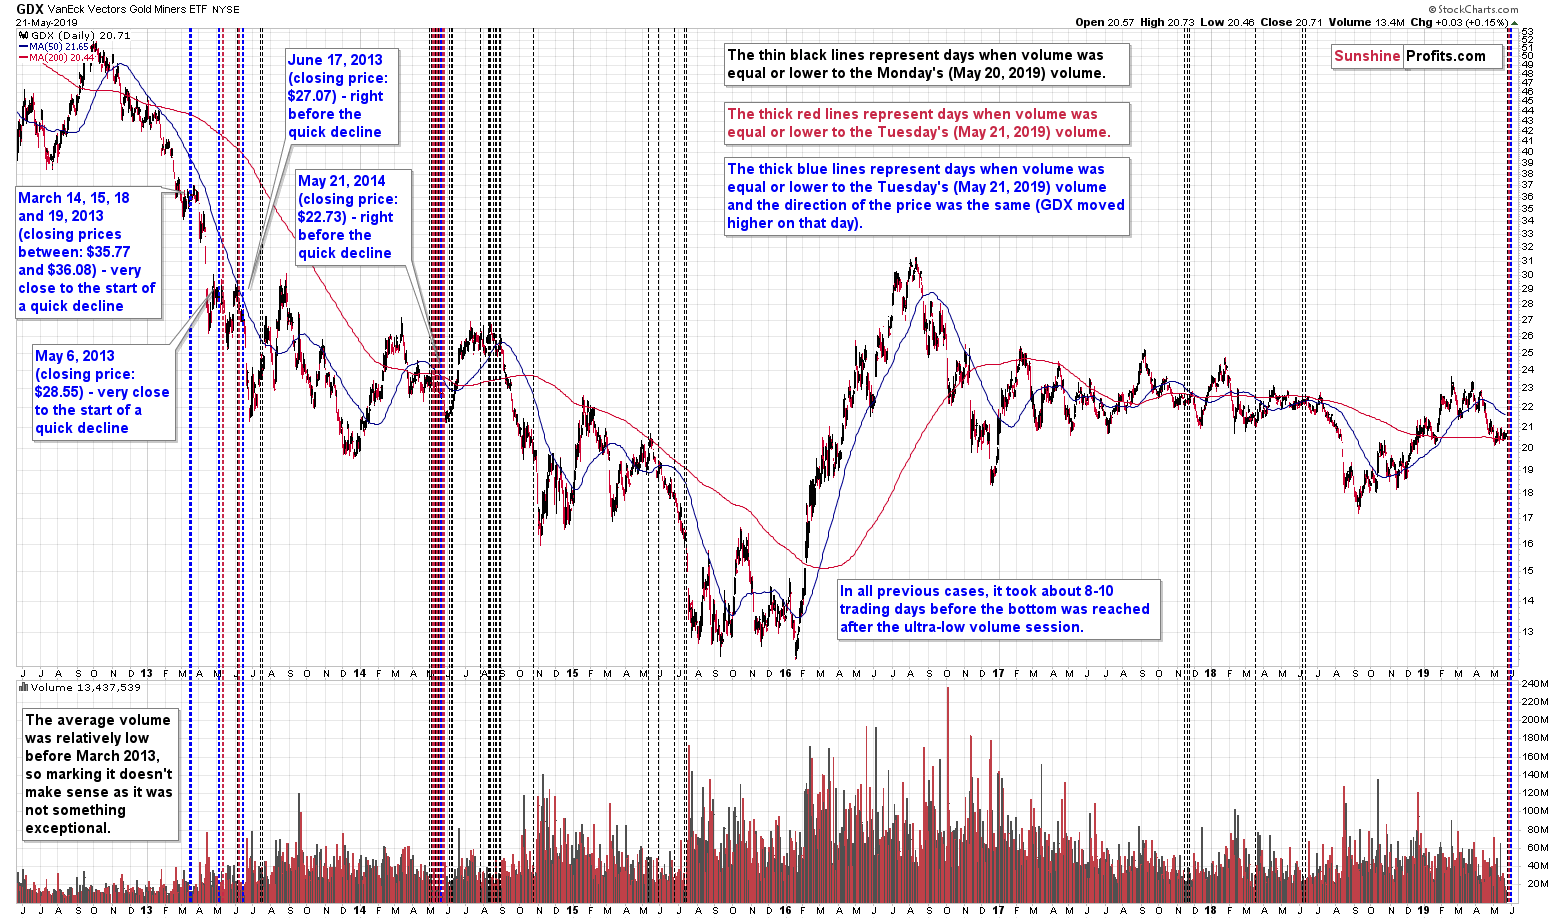
There are quite a few lines on the above chart, and they all have a purpose. Let's start with the blue lines. These are the lines that represent sessions that are most similar to yesterday's session. Namely, these are the sessions, during which GDX moved higher on volume that was as low (or lower) as yesterday's (May 21, 2019) volume of 13.4M.
The red lines represent sessions that are also similar but not clearly so. These are the days, when the GDX moved either higher or when it was flat on volume that was as low as yesterday, or even lower.
Finally, the thin, black lines represent the days, when the GDX moved in either direction and the volume was equal or lower to Monday's (May 20, 2019) volume of 17.6M. In other words, it's a relatively broad category of low-volume days.
We marked all three kinds of similarity to increase the quality of the analysis. Of course, there are some analysts that don't even wait for a given formation to be completed (especially inverse head-and-shoulders formations are popular among the gold promoters disguised as gold analysts) or don't pay attention to where they get data from and arrive at incorrect conclusions regarding the major charts (gold to silver ratio clearly broke above its long-term resistance, it's not at it), but we care too much about you and your financial success to feature something without researching it really thoroughly first. So, please bear with us, as we explain our methodology.
The more similar a given development is to what happened recently, the more likely it is that the follow-up action will also be repeated.
However, at the same time...
The more similar situations from the past confirm the same outlook and the less situations indicate a different outcome, the more likely it is that the follow-up action will also be similar.
There is usually a trade-off between the level of similarity and the number of similarities, so the question becomes, which ones should one take into account. Our reply is that one should use all of them, because they might confirm, or invalidate each-other, thus making a given forecast either more or less valuable. After all, the more signals point to the same outcome, the more likely it becomes.
The blue lines are the most similar cases, so let's start with them. There were only 4 similar cases when volume was as low during a daily upswing as they were yesterday, and they were all in a relatively similar part of the year. The most recent case took place exactly 5 years ago. The previous cases took place on June 17 2013, May 6 2013, and in mid-March 2013 (on 14th, 15th, 18th, and 19th).
The follow-up action was very similar - a quick decline followed either immediately (June 17, 2013 and May 21, 2014) or shortly (May 6, 2013 and mid-March 2013). What is even more profound is that the next bottom formed in all these cases in about 2 weeks (8-10 trading days) after the low-volume session. This means that we are likely to see the next bottom at the end of May or very early in June.
Let's consider the broader point of view. The red lines are present close to the blue lines, so they approximately confirm their indications. There are only three separate cases when we saw them, though, so they don't provide much additional value. Why did we separate the blue and red lines if that's the case? Because the blue lines are much more precise and by looking at all ultra-low-volume sessions we might have not detected this uncanny similarity. It's always good to dig deeper into the data. At worst, you won't find anything. At best, you'll get a more precise forecast, a confirmation or invalidation of the more general indication. We have the former.
The broadest point of view - the black lines - confirm the bearish indication in general, but are not precise with regard to the follow-up action. The low volume sessions were seen right before some of the most powerful declines (multiple similar sessions in August 2014, in May, June and July 2015, and in mid-2018), but we also saw them before smaller rallies (mid-2013, June 2014, March 2018), and smaller declines (November 2017). Overall, low-volume sessions indicate bigger moves on the horizon which are usually to the downside. The precision in the prediction comes from the volume being not just low, but ultra-low. The extremely low value is what makes this situation stand out among other low-volume sessions. And the implications are much more bearish than if the volume was "just low".
Let's get back to the issue of confirmations. The more confirmations and the more they vary, the greater the chance that a given prediction will be realized.
Applying the GDX Lessons
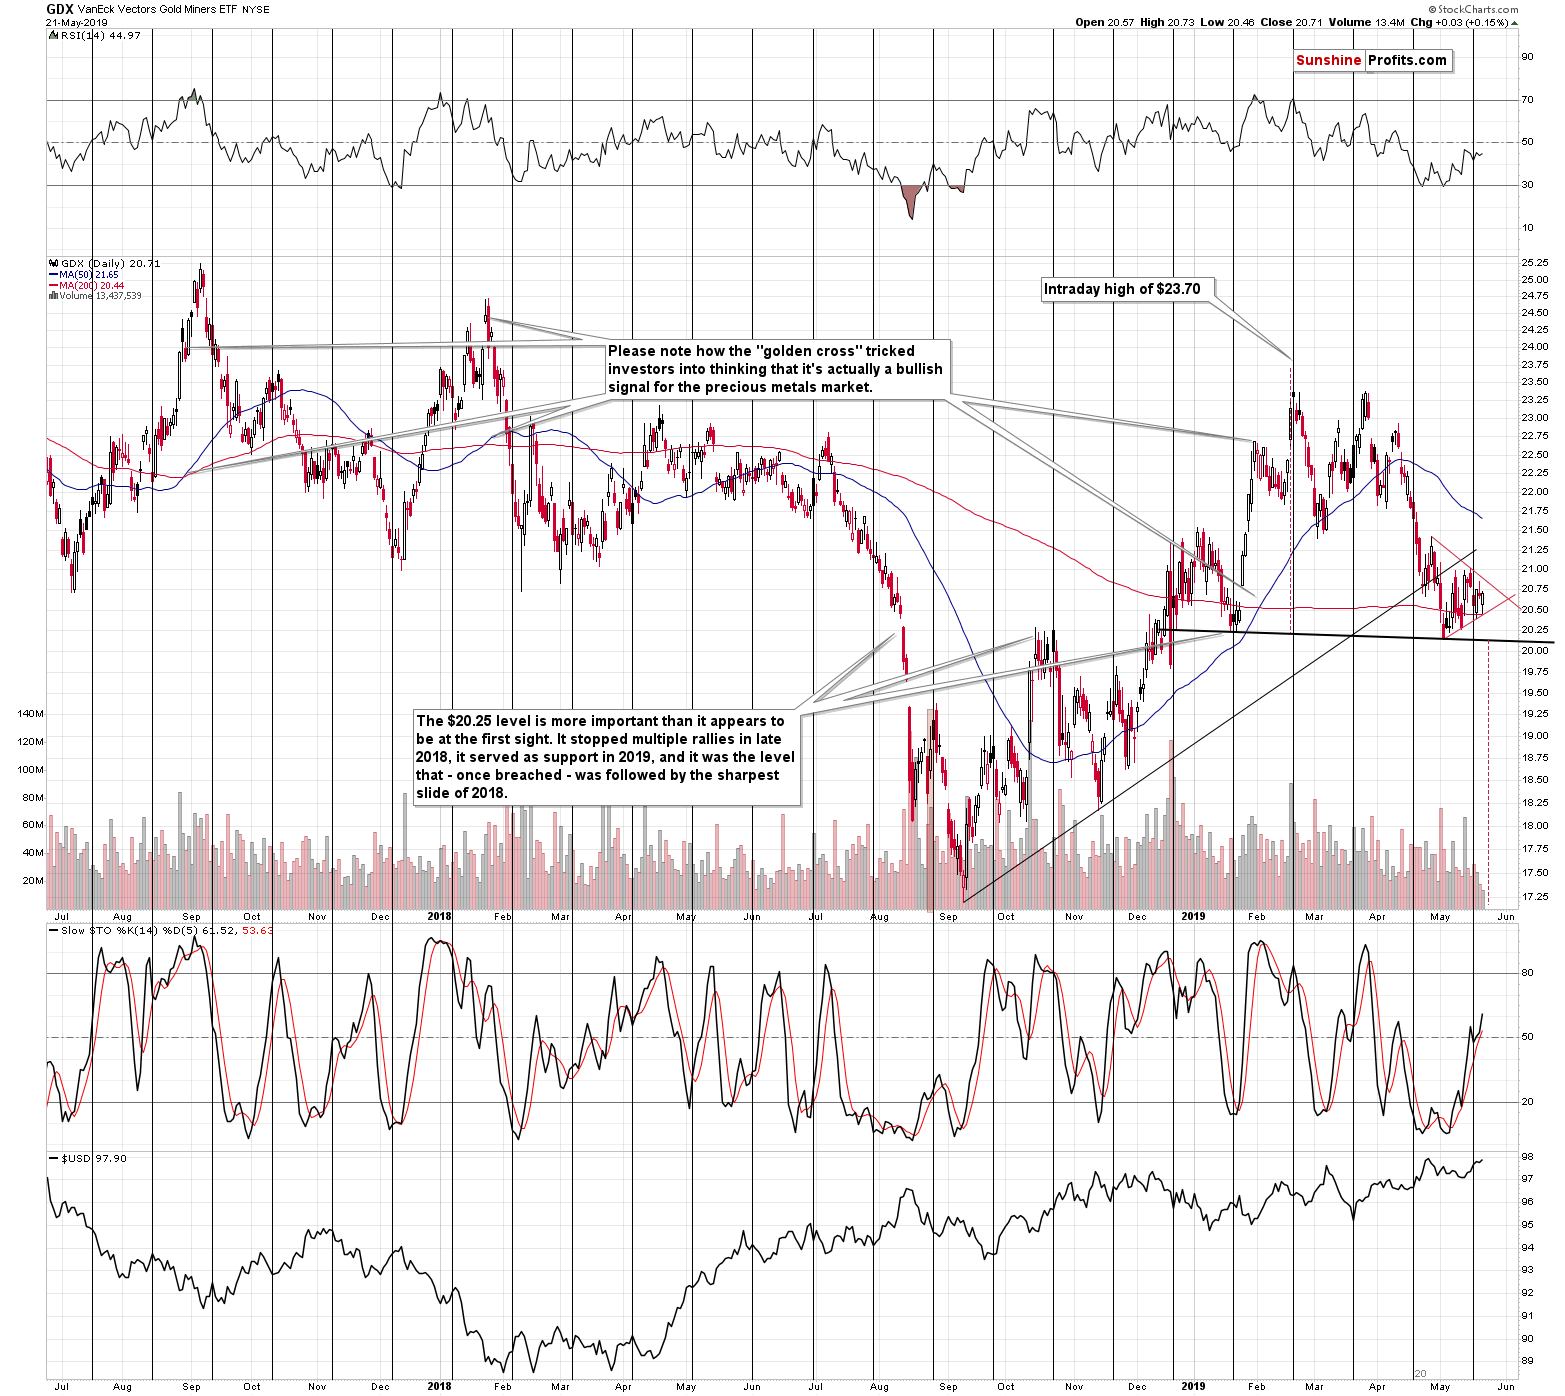
The GDX ETF is after a breakdown and the entire back and forth trading that we saw this month is a post-breakdown consolidation. In other words, that's how the GDX is preparing for the next move.
But it's actually more than that.
The recent consolidation took form of a triangle. This is important because of two reasons. First, triangles are usually continuation patterns. Second, the vertex of the triangle is likely to mark a reversal moment. And when is the vertex? At the turn of the month, which serves as a perfect confirmation of the ultra-low analogy that we described earlier.
On April 18, we indicated that gold stocks are likely to decline to their January lows. And they did. That was not a major bottom - just an interim one. But it was enough to create the right shoulder of the potential head-and-shoulders formation (December - January price action being the left shoulder). This means that once GDX breaks below the early May lows, it's likely to decline all the way down to the 2018 low of about $17.25.
There are also more long-term oriented indications that a major turnaround will take place at the turn of the month.
There are several long-term triangle-vertex-based reversals that are just around the corner. The first one is in the final part of May and then we have three of them spread out more or less evenly throughout June. This means that if miners slide sharply, they are quite likely to bounce back in a manner that's volatile enough for the next top to be meaningful. Remember the crazy February 2018 back and forth movement? Perhaps we will see something like that within the next month.
Extremely low volatility often precedes very high volatility. We already wrote about gold's volatility being so low that it's actually a major sell signal, and yesterday's volume in the GDX ETF serves as a short-term confirmation.
There is no nearby long-term triangle-vertex-based reversal in case of gold, but there is one in case of silver.
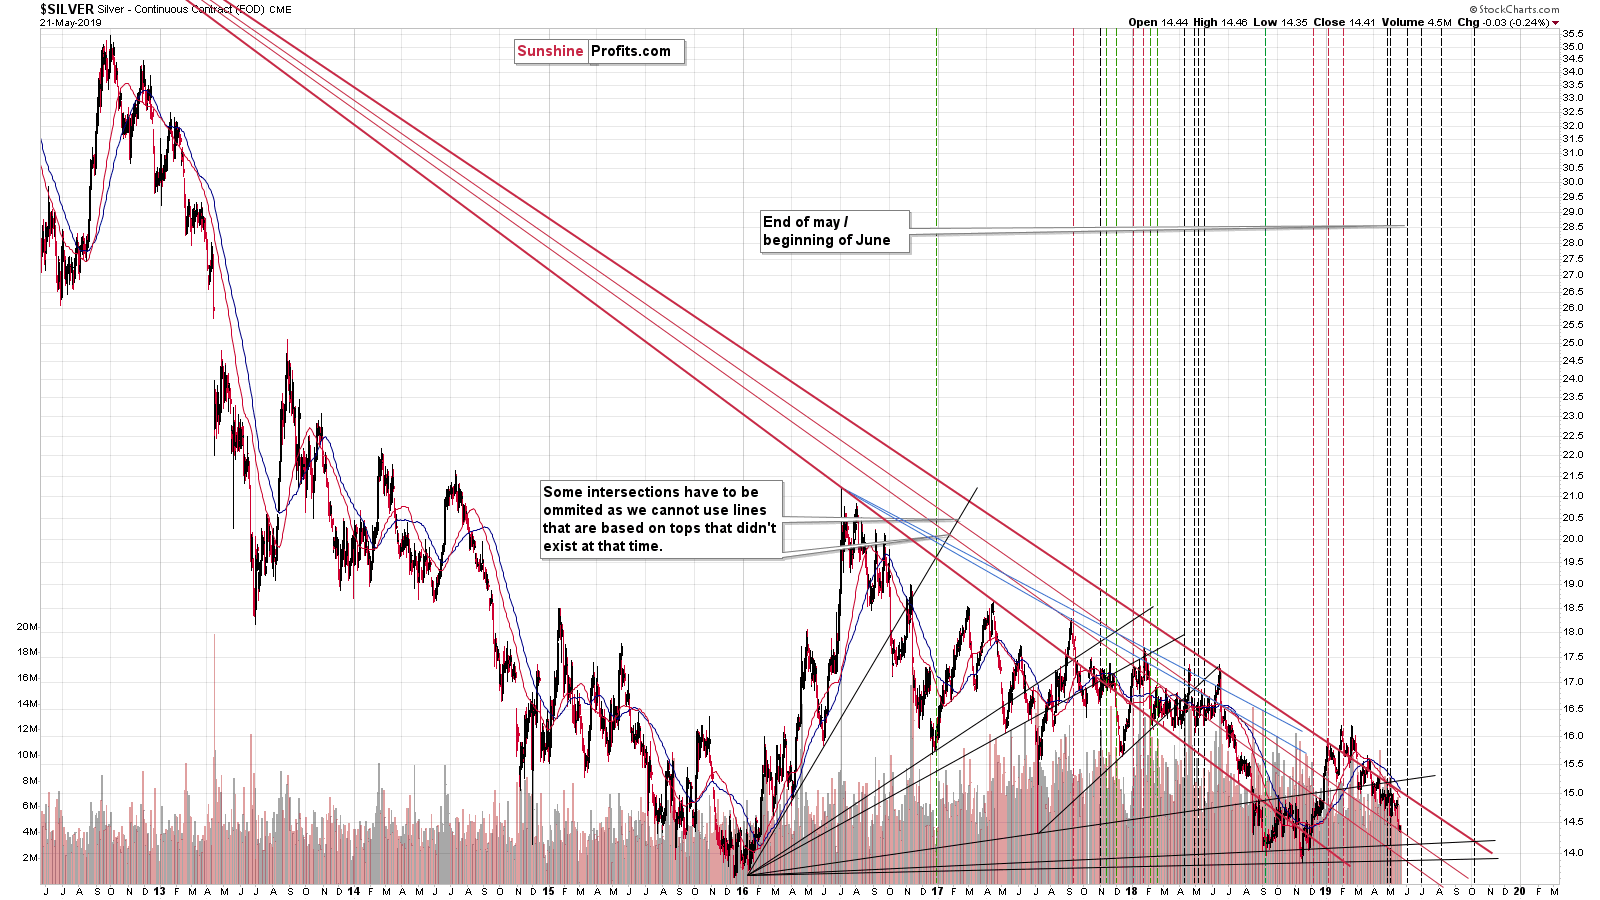
And it's right at the turn of the month. That's yet another confirmation, this time coming from a different market. It's high time to buckle up.
Before moving to gold's and silver's daily price action, we would like to reply to one of the questions that we received about the GDX ETF. The question was if the recent decline is just a verification of the breakout above the declining resistance line based on the 2016 and 2018 highs.
Miners' Breakout Verification? What Breakout?
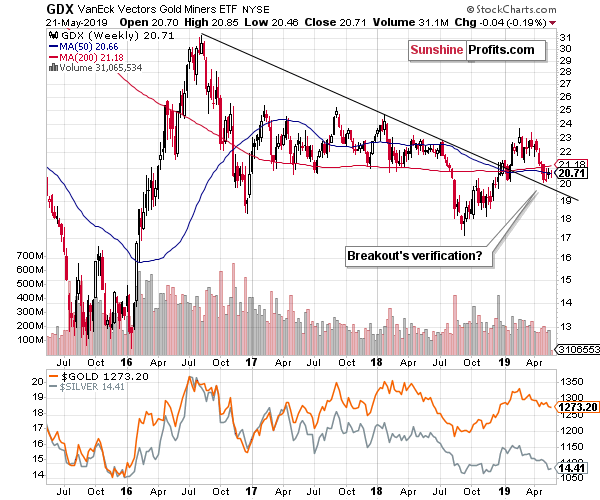
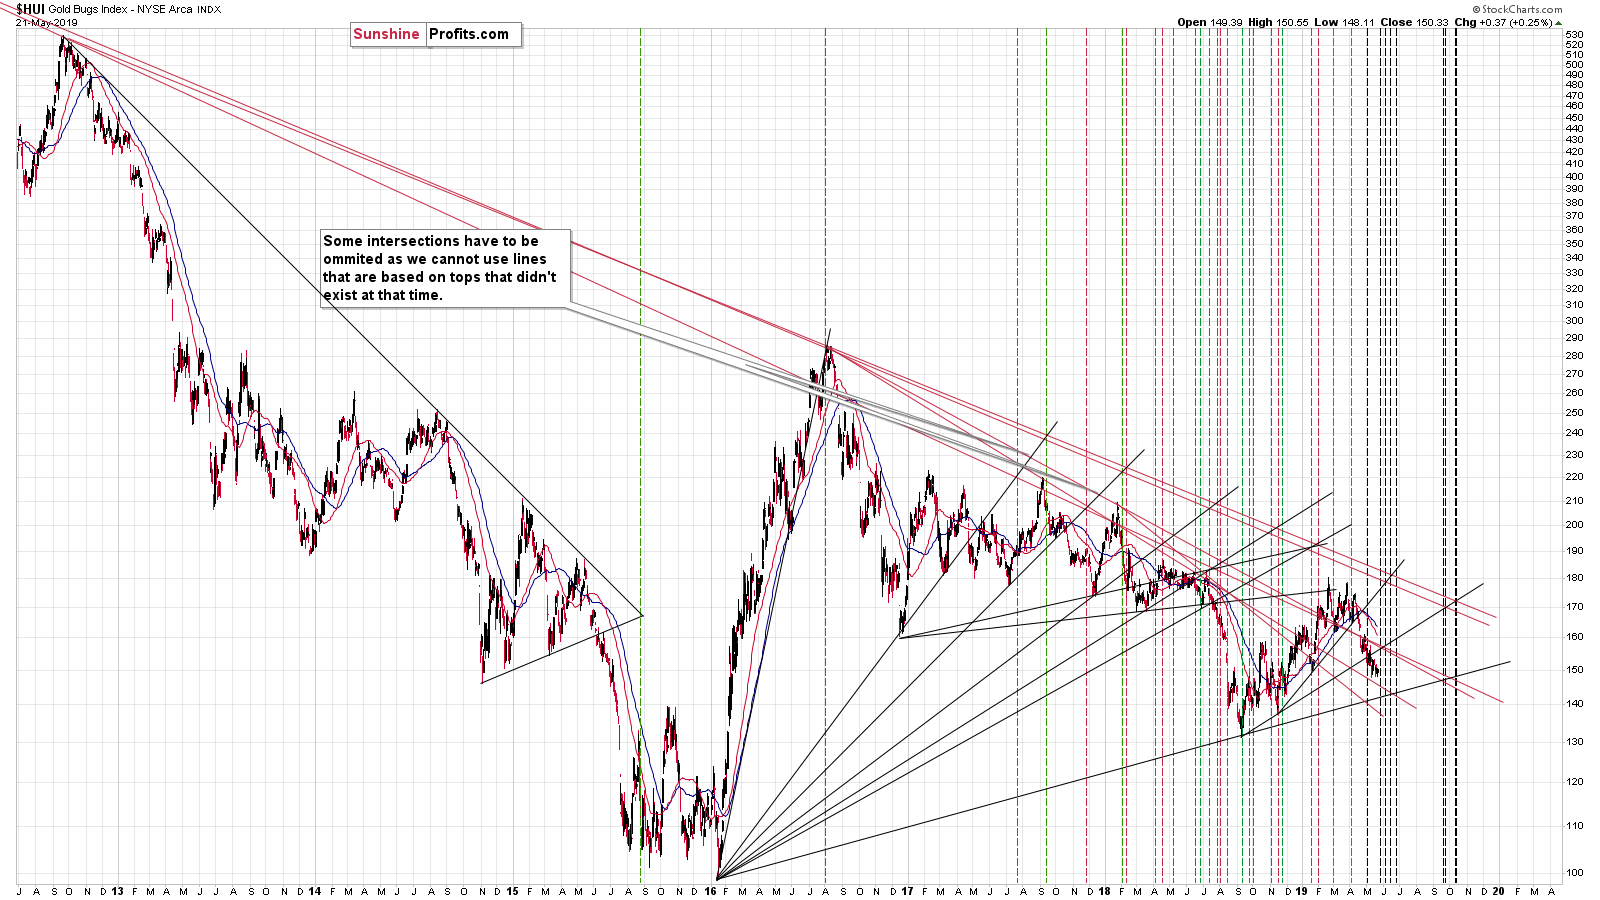
It's true that this may appear to be the case, but other proxies for the mining stock sector don't confirm it.
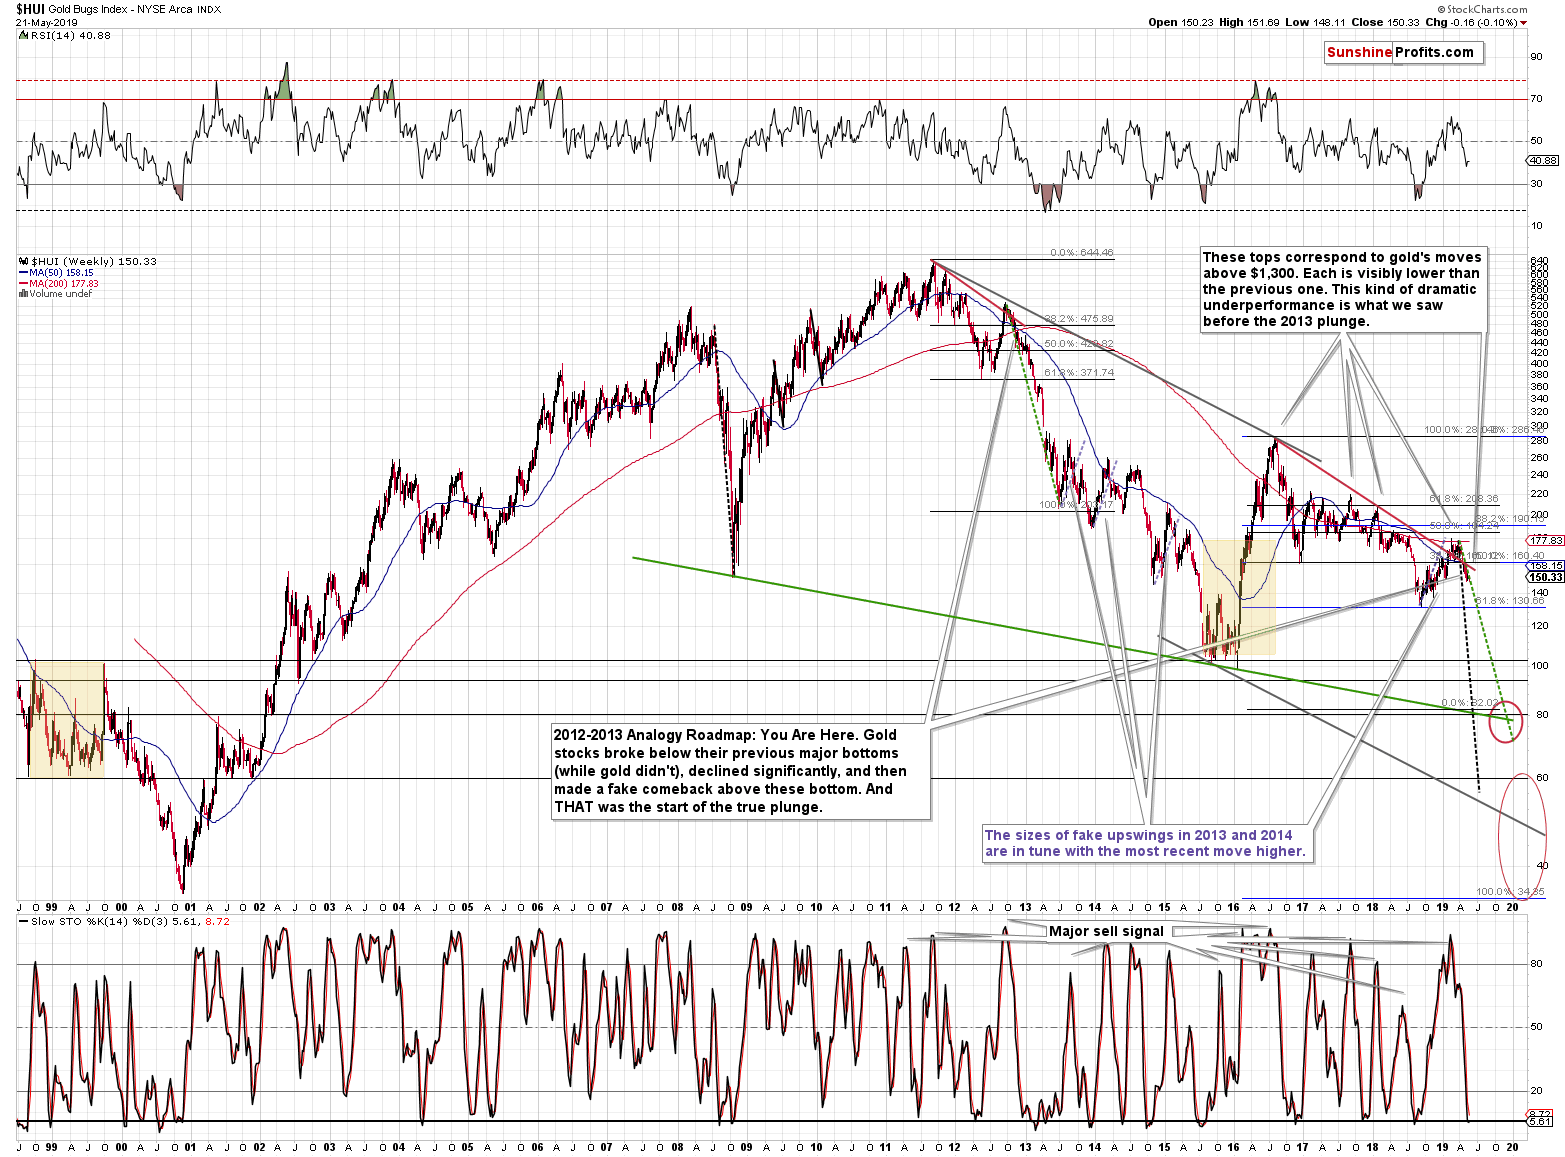
The HUI Index already invalidated its breakout, which was a major sell signal. On a side note, yesterday's tiny move higher in the HUI Index wasn't able to push it above the January low - from this point of view, we simply saw another daily verification of the breakdown to new 2019 lows.
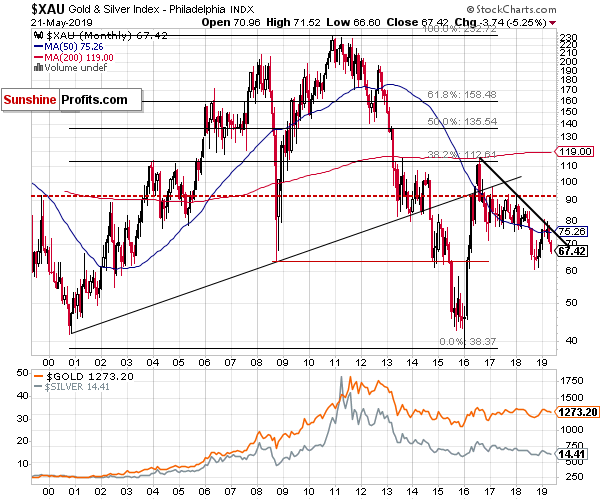
The XAU Index only moved to the declining resistance line - there was no breakout that might be confirmed.
What about the SIL ETF, the proxy for the silver mining stocks?
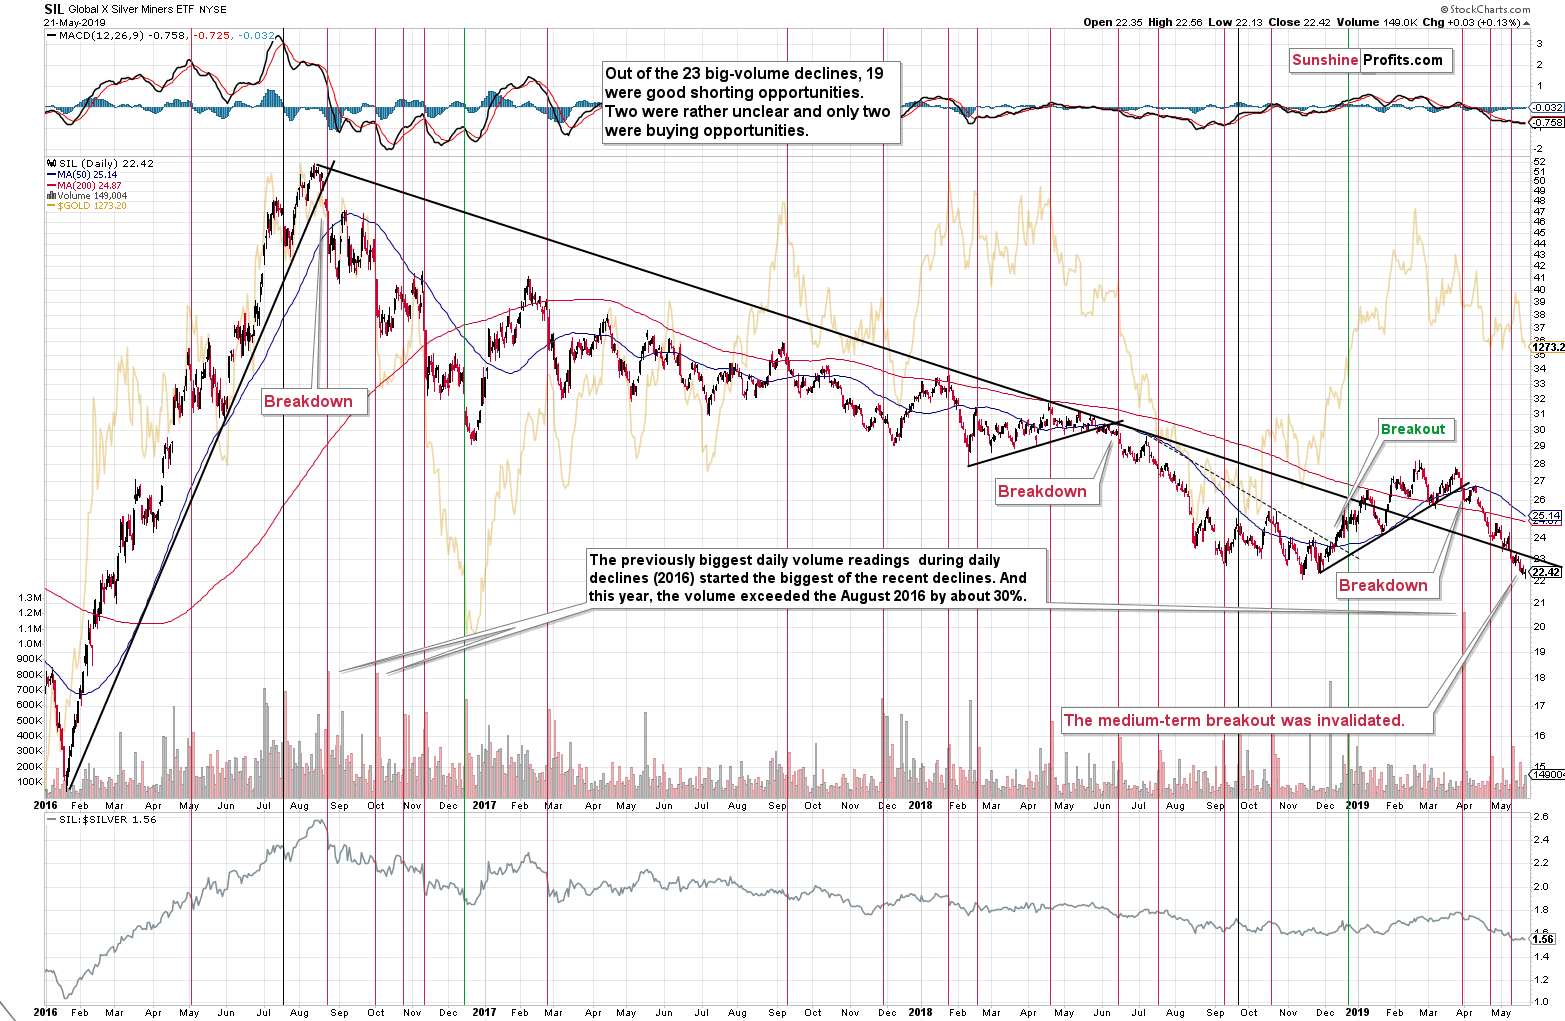
It invalidated its medium-term breakout as well.
So, should we trust a breakout in one of the proxies for the mining stocks, or all the other major ones? It seems that GDX's breakout is an outlier in the data - an exception from the conclusion, not the change in the conclusion itself.
Consequently, we don't think that the situation in the GDX with regard to the declining support/resistance line based on the 2016 and 2018 highs has important implications at this time. Based on the other factors that we already discussed today, it seems that we will not have to wait long for the market to agree with us.
Having said that, let's take a look at what happened in gold.
Now, Gold and Silver's Action
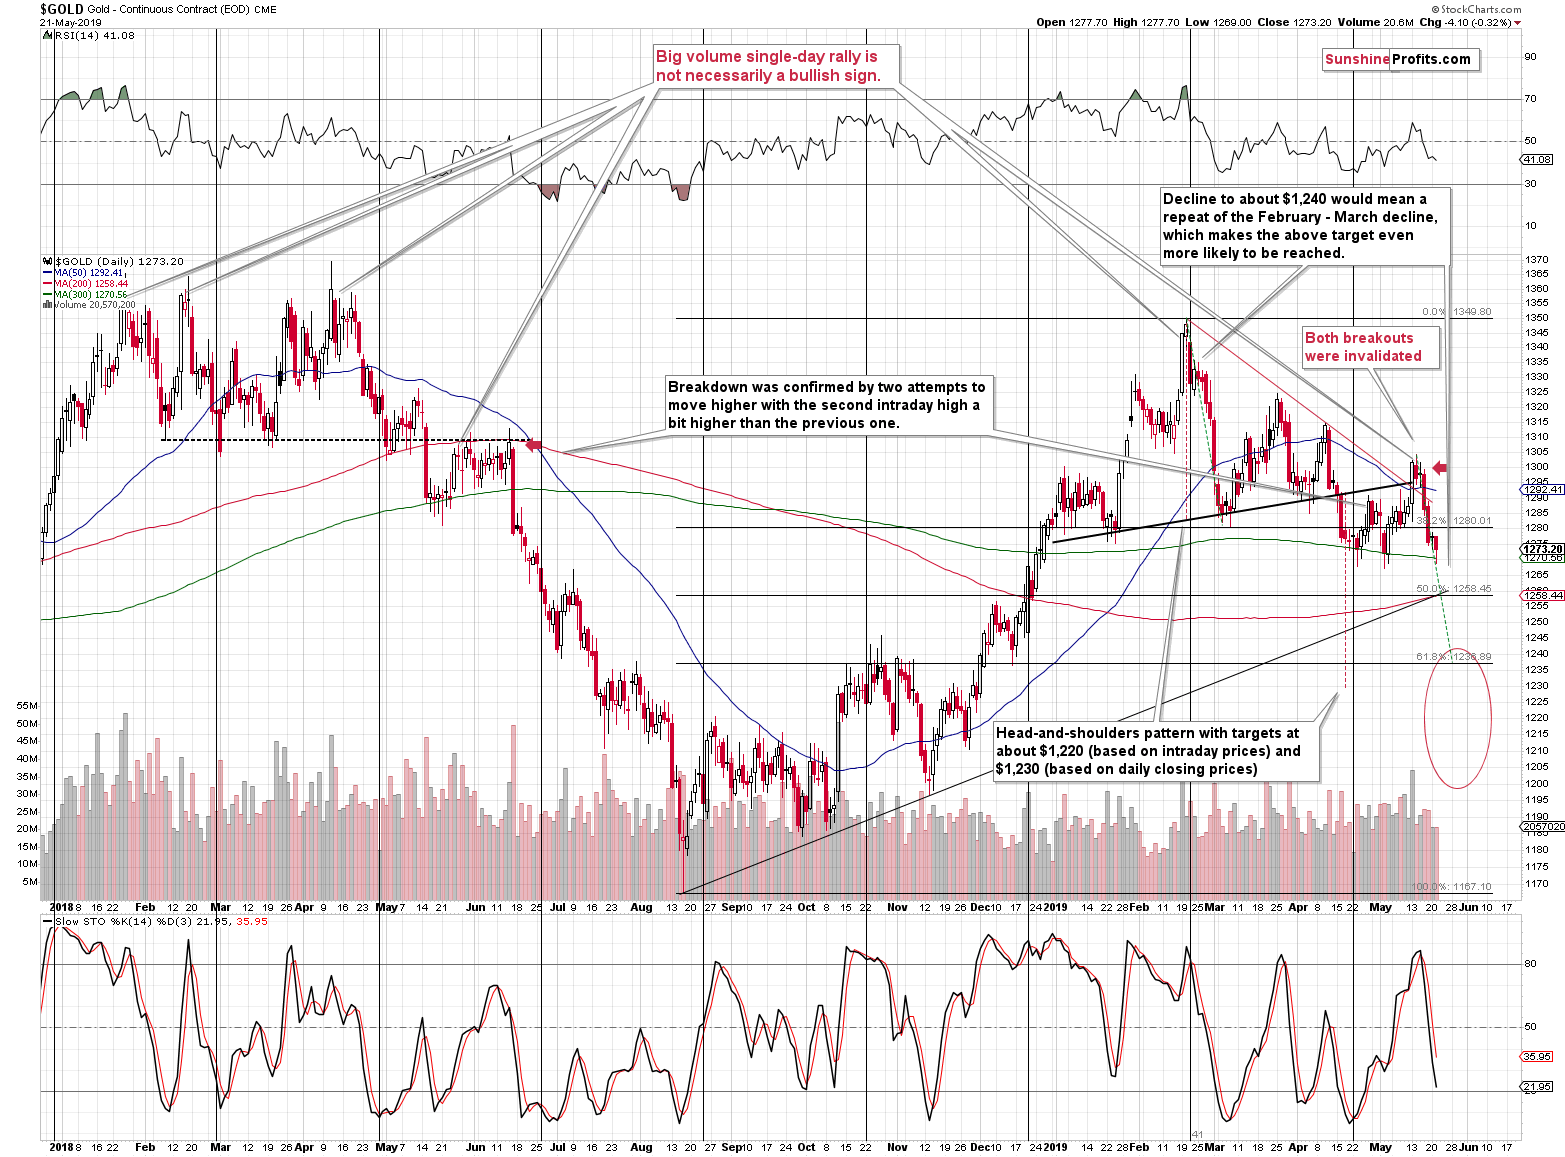
Gold simply paused after moving to the previous 2019 lows. The action in the USD Index was relatively small - no wonder that gold didn't plunge more dramatically. This doesn't change anything. Looking at the way gold declined in late February 2019, we see that the pace of decline is very similar this time. We illustrated it using green lines. The pace of gold's decline is simply normal. We are likely to see lower gold values shortly, quite likely this week.
Please note that if gold continues to decline at similar pace as it did in February and March, it will reach our target of about $1,240 more or less at the end of May, which would be in tune with what we wrote about the time target for the reversal based on other techniques.
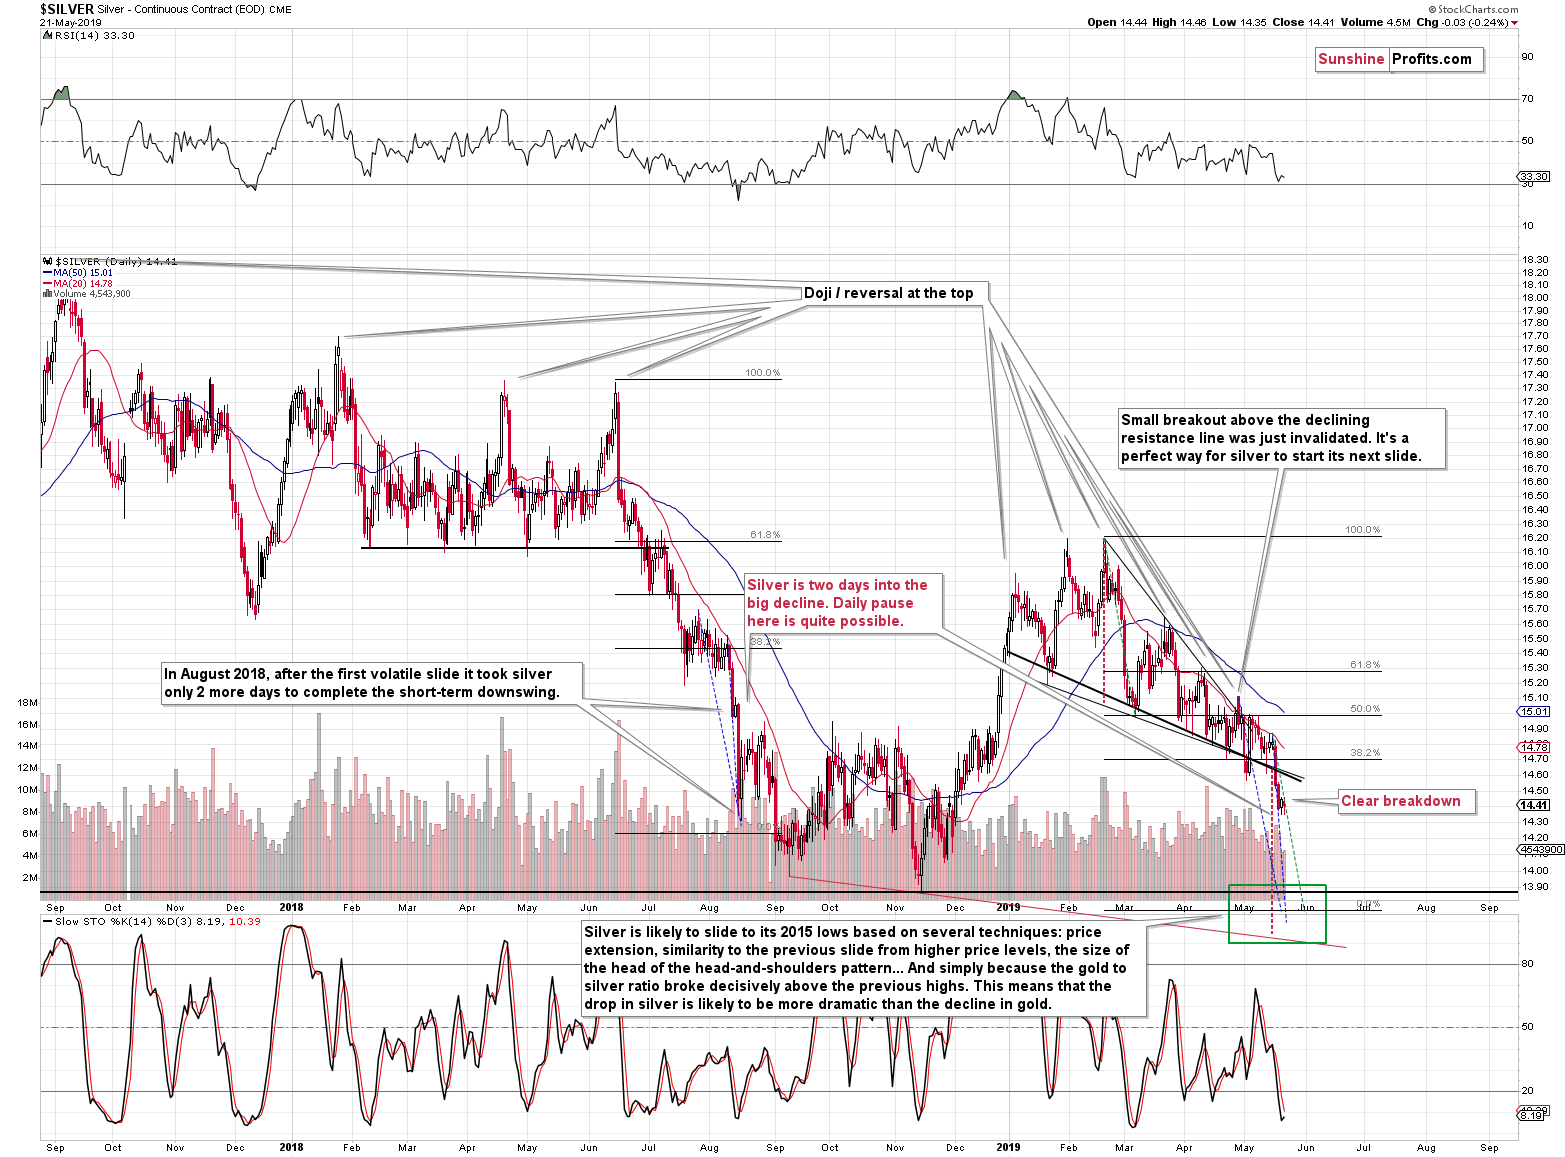
Silver paused after declining significantly, but it's also perfectly normal. The white metal did exactly the same thing in August 2018. The decline that followed was even bigger than the one that preceded the breather. The outlook remains bearish.
Summary
Summing up, the extremely low volume in the GDX ETF has very bearish implications for the short term and multiple techniques point to a massive decline being just around the corner. The most likely time target for the next short-term (and temporary) turnaround is the end of May or the first days of June. In other words, gold might reach our interim target level of $1,240 shortly and thus we might adjust our trading position also relatively soon.
Today's article is a small sample of what our subscribers enjoy regularly. The full version (reserved for our subscribers) also covers the updated gold price path. To keep informed of both the market changes and our trading position changes exactly when they happen, we invite you to subscribe to our Gold & Silver Trading Alerts today.
Thank you.
Przemyslaw Radomski, CFA
Editor-in-chief, Gold & Silver Fund Manager
Sunshine Profits - Effective Investments through Diligence and Care
