

After a sharp post-breakout increase on Monday, we saw even sharper decline during yesterday’s session. Thanks to the currency bears’ attack the euro moved lower against the greenback, which gave the sellers another ally. Will we see EUR/USD under 1.2200 in the coming week?
EUR/USD Invalidated Breakout
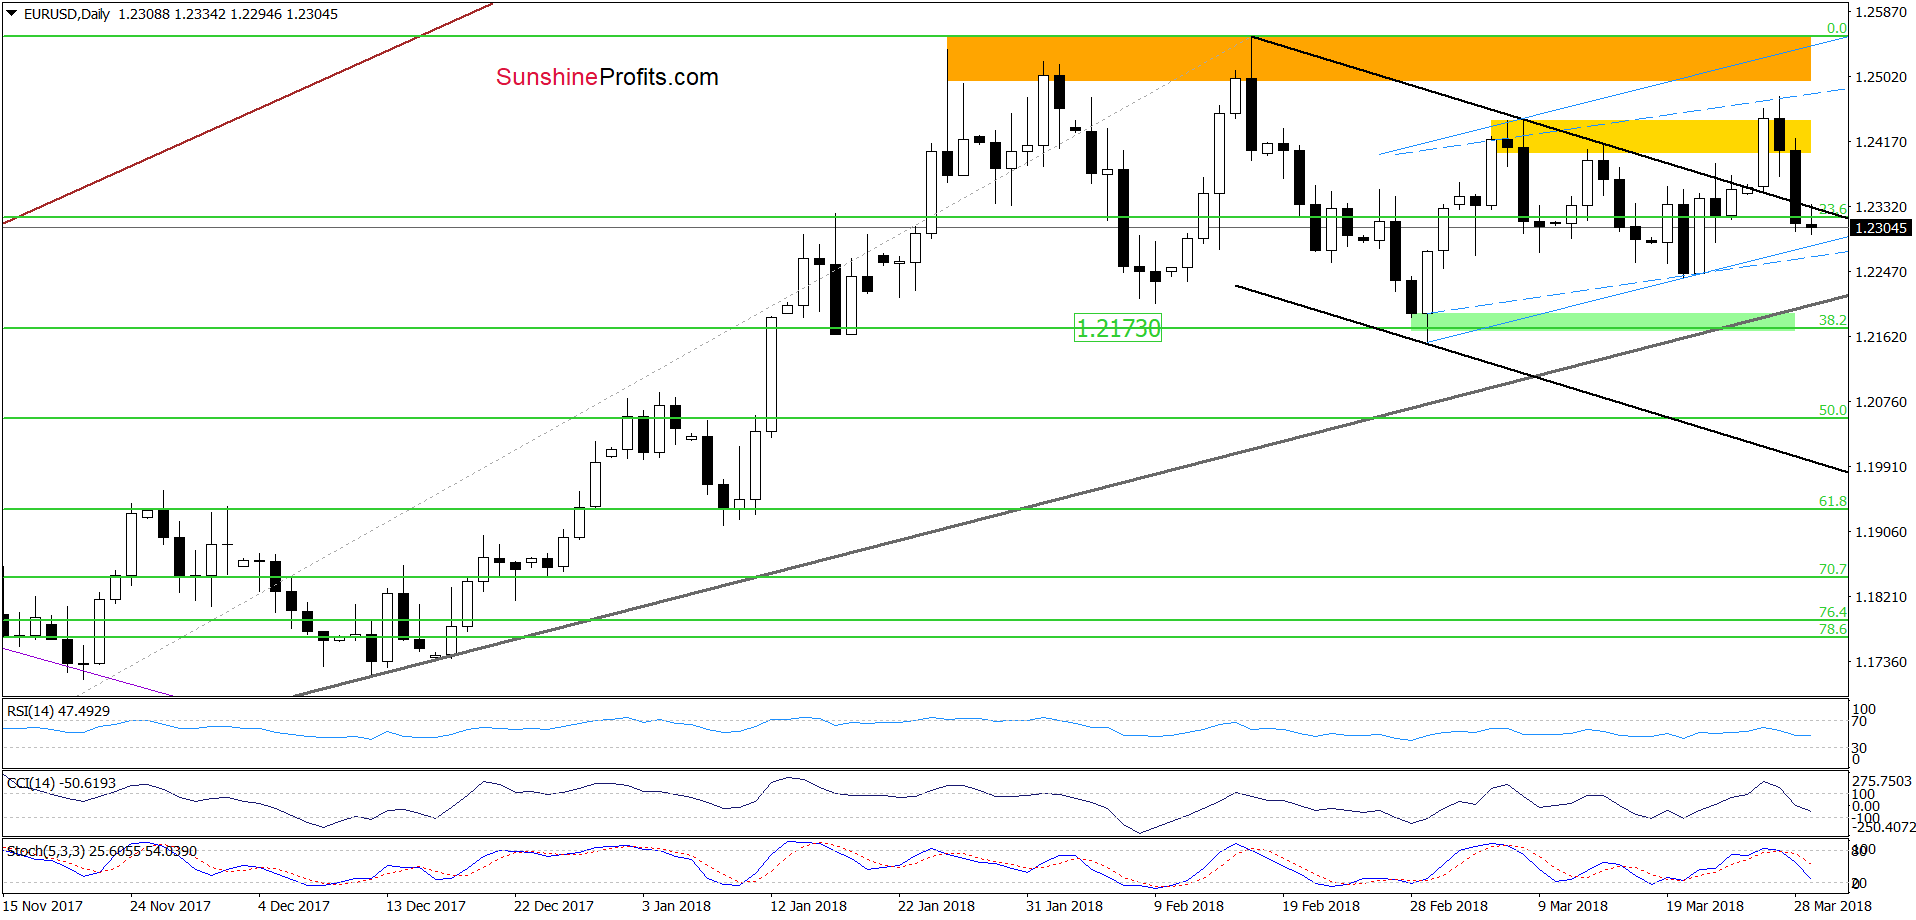
Yesterday, we wrote that currency bears pushed EUR/USD lower (as we had expected) earlier today, which together with the sell signal generated by the indicators suggests further deterioration in the coming day(s).
From today’s point of view, we see that the situation developed in tune with our assumptions and EUR/USD moved sharply lower yesterday. Thanks to this drop, the pair slipped under the previously-broken upper border of the black declining trend channel and closed the day below it, invalidating the earlier breakout.
Earlier today, the exchange rate verified yesterday’s breakdown, which increases the probability of another move to the downside in the near future.
How low could EUR/USD go?
In our opinion, the initial downside target will be around 1.2173, where the38.2% Fibonacci retracement and the green support zone are. Nevertheless, taking into account yesterday’s price action, it seems that the pair could move even lower and test the lower border of the above-mentioned black declining trend channel (currently around 1.1998) in the following days.
USD/CAD Enriches Currency Bears
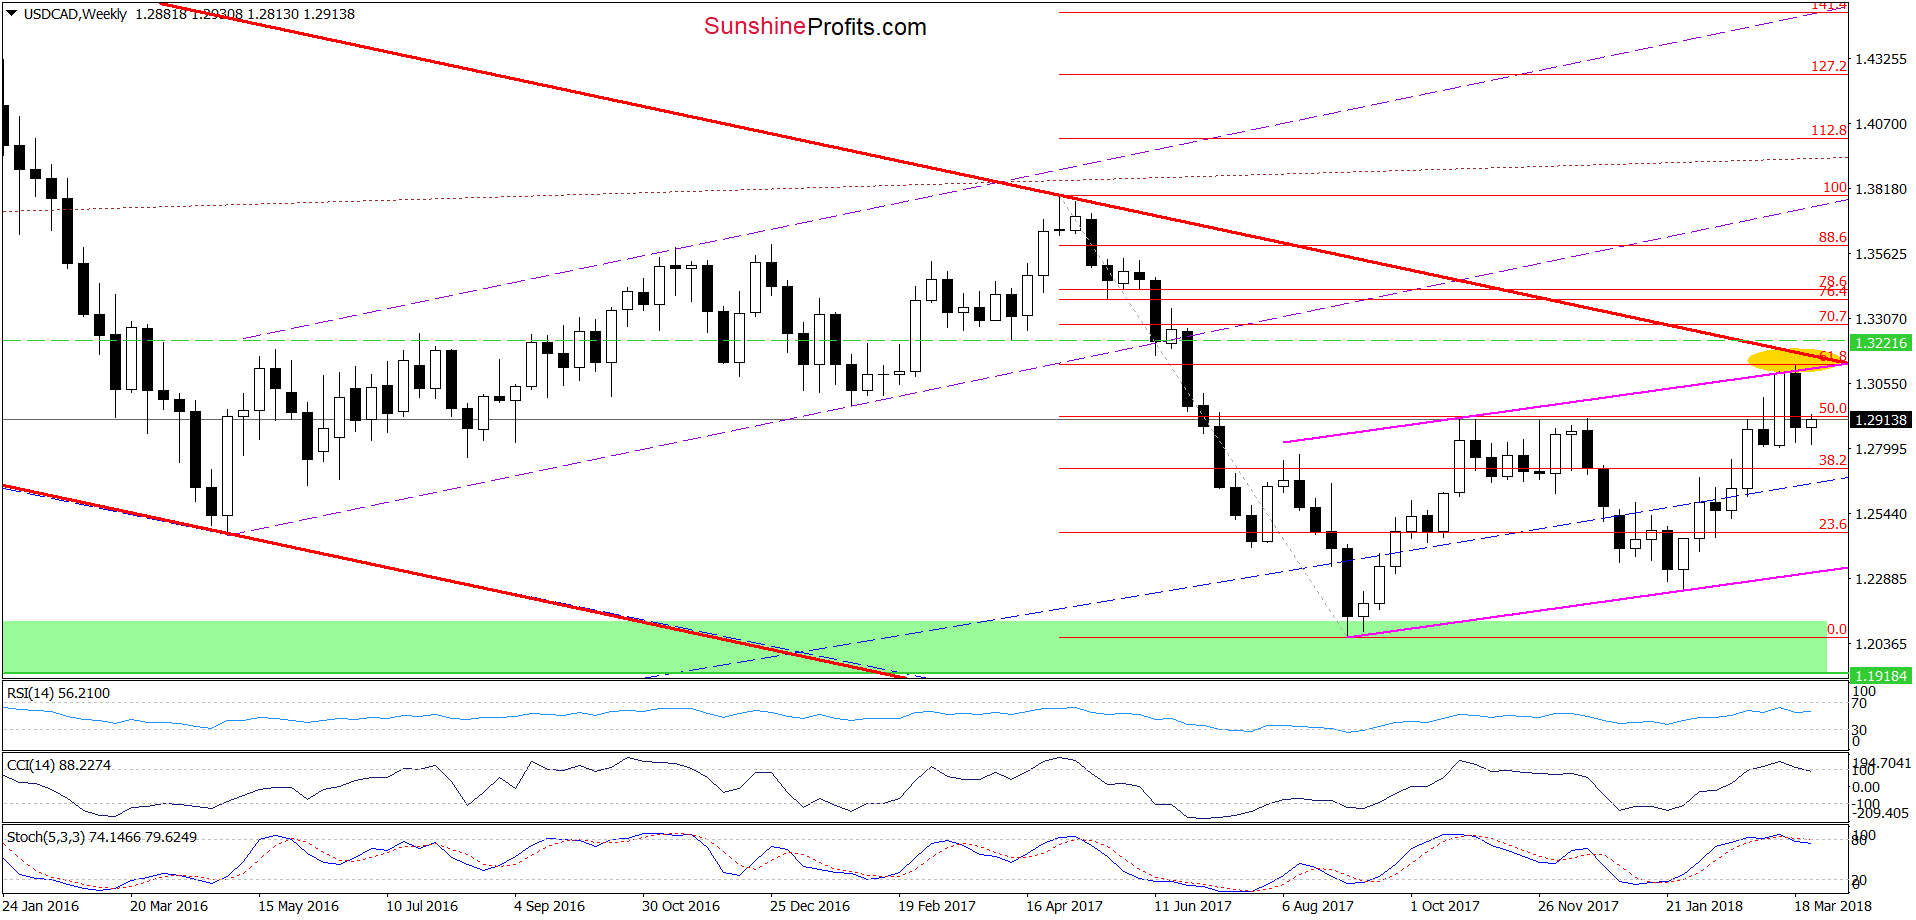
Looking at the medium-term chart, we see that although USD/CAD moved a bit higher earlier this week, the sell signals generated by the weekly indicators remain in the cards, supporting currency bears and lower values of the exchange rate.
What impact did the recent price action have on the very short-term chart? Let’s take a closer look at the daily charts below.
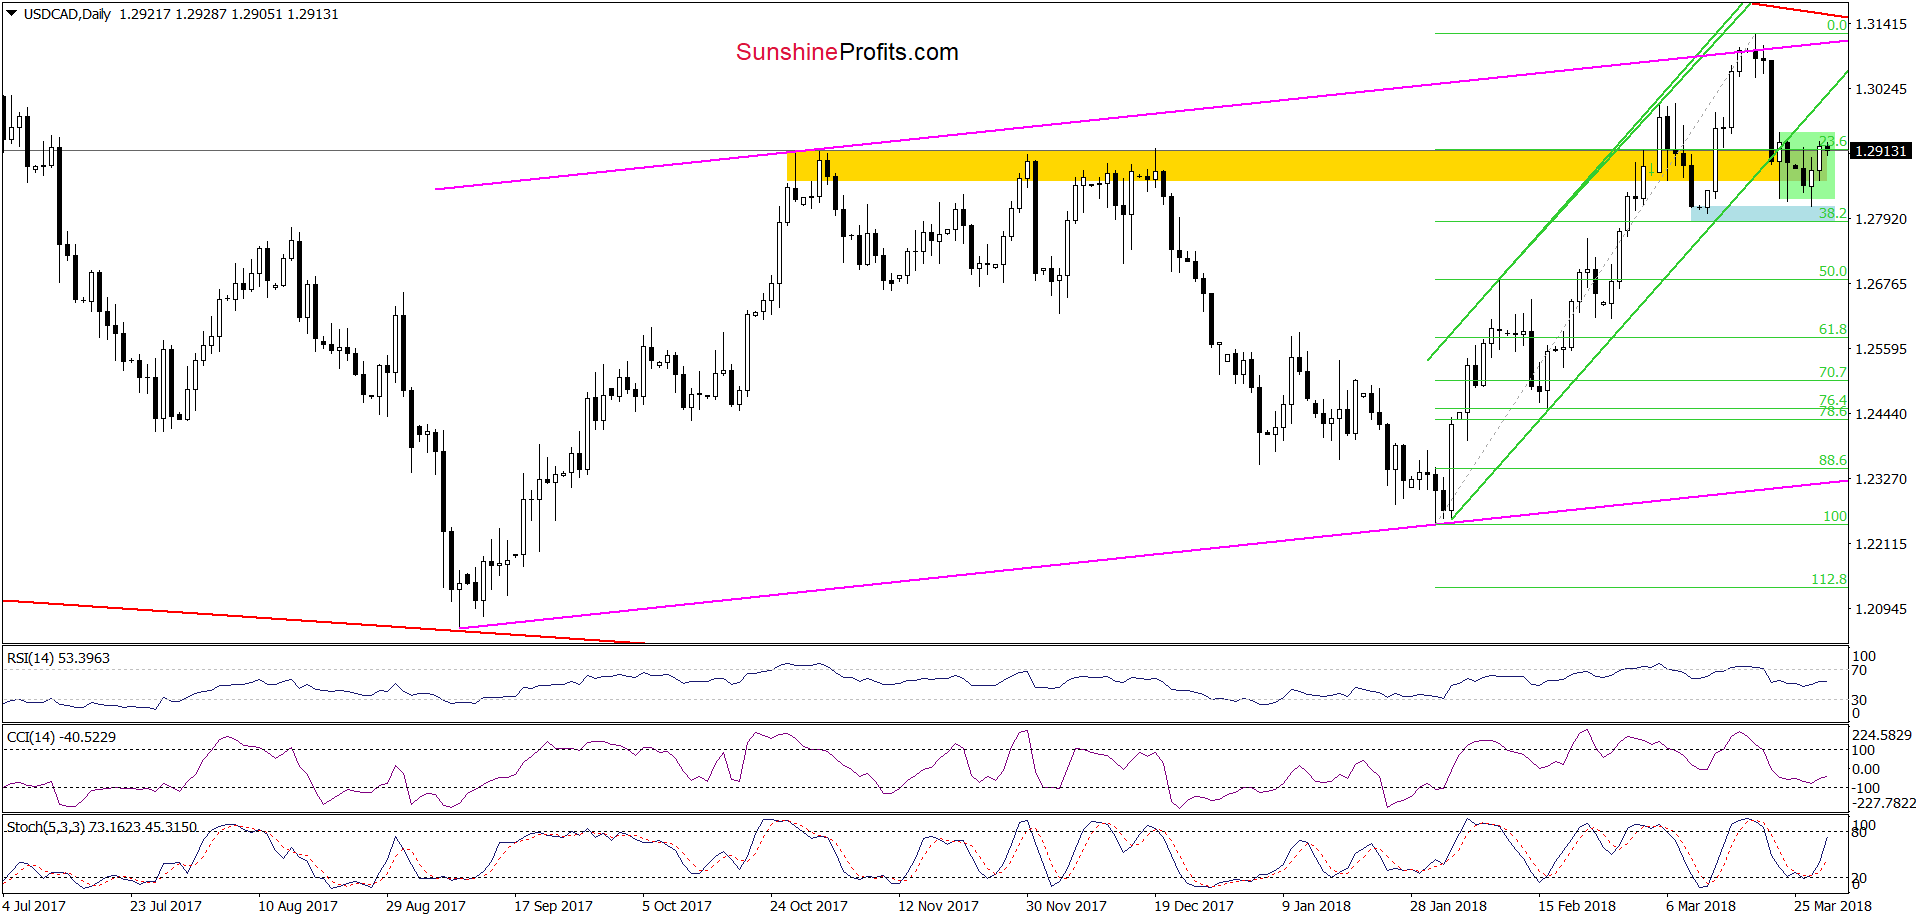
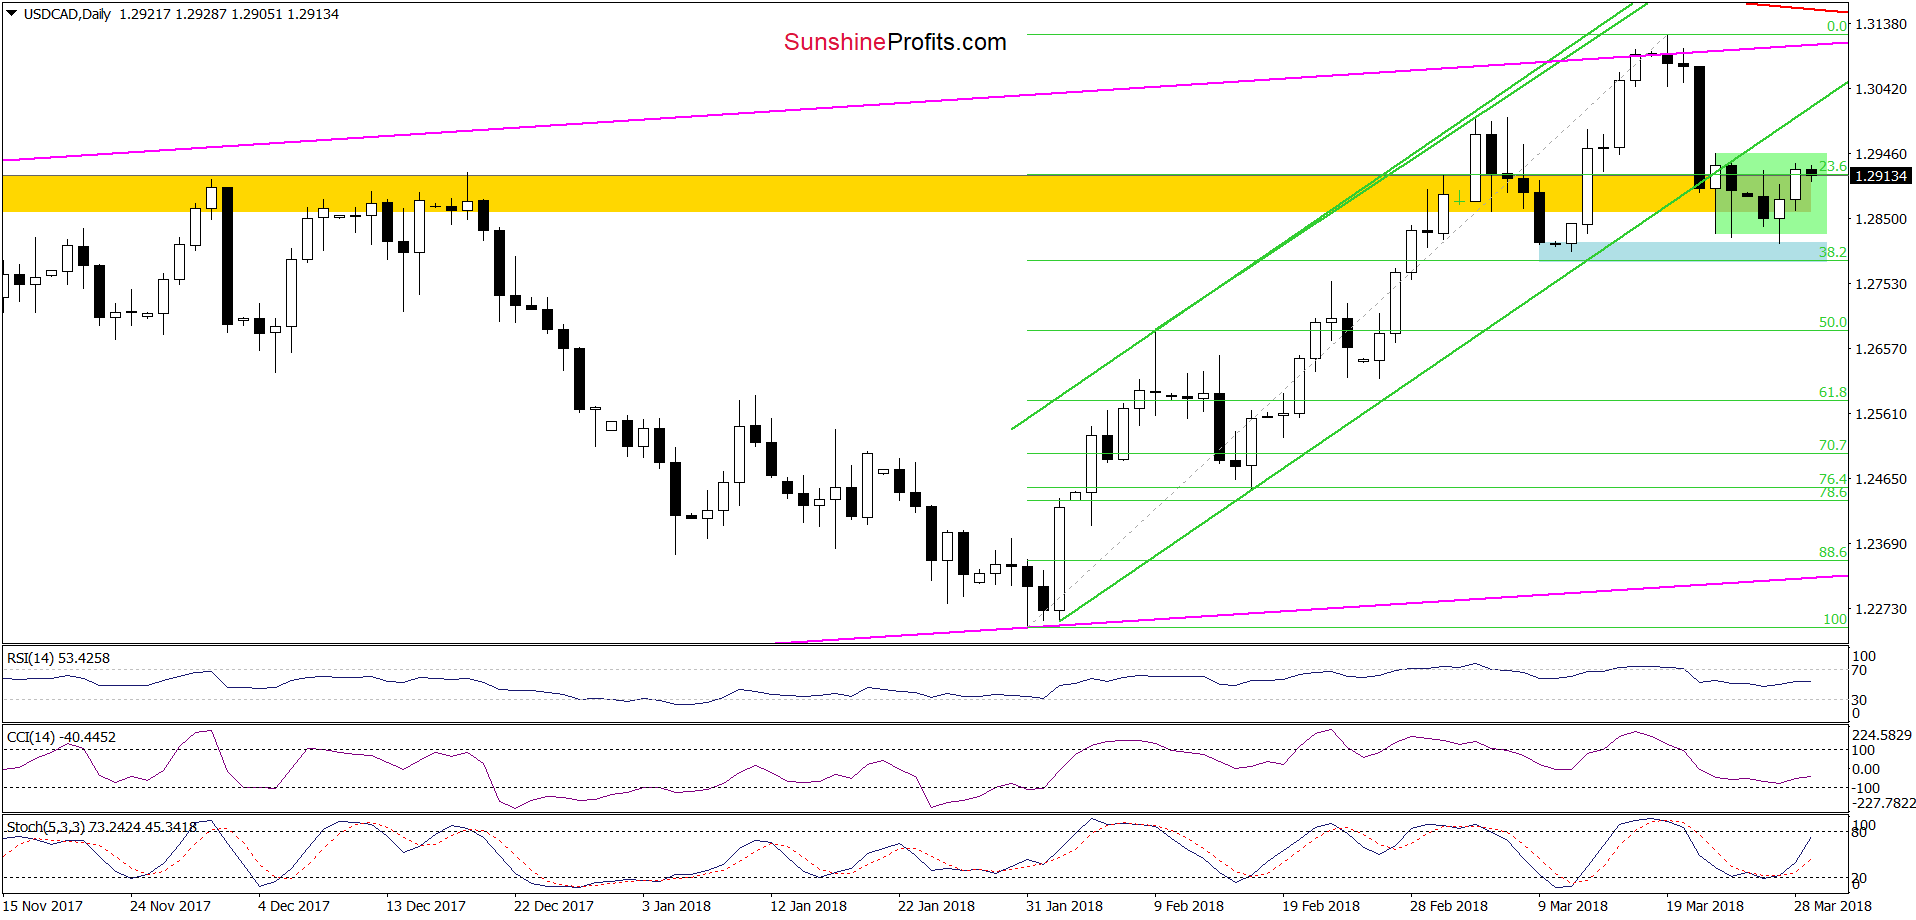
From this perspective, we see that although USD/CAD bounced off the blue support zone, the pair is still trading in the green consolidation around the yellow resistance zone and well below the previously-broken lower border of the green rising trend channel.
What does it mean for the exchange rate? In our opinion, as long as the pair remains under the upper border of the formation, another attempt to move lower is very likely.
If this is the case and USD/CAD extends losses from here, we’ll see (at least) a re-test of the blue support zone in the coming days, which will make our short positions even more profitable (as a reminder, we opened them on March 19, when USD/CAD was trading at around 1.3116).
USD/CHF Heads North
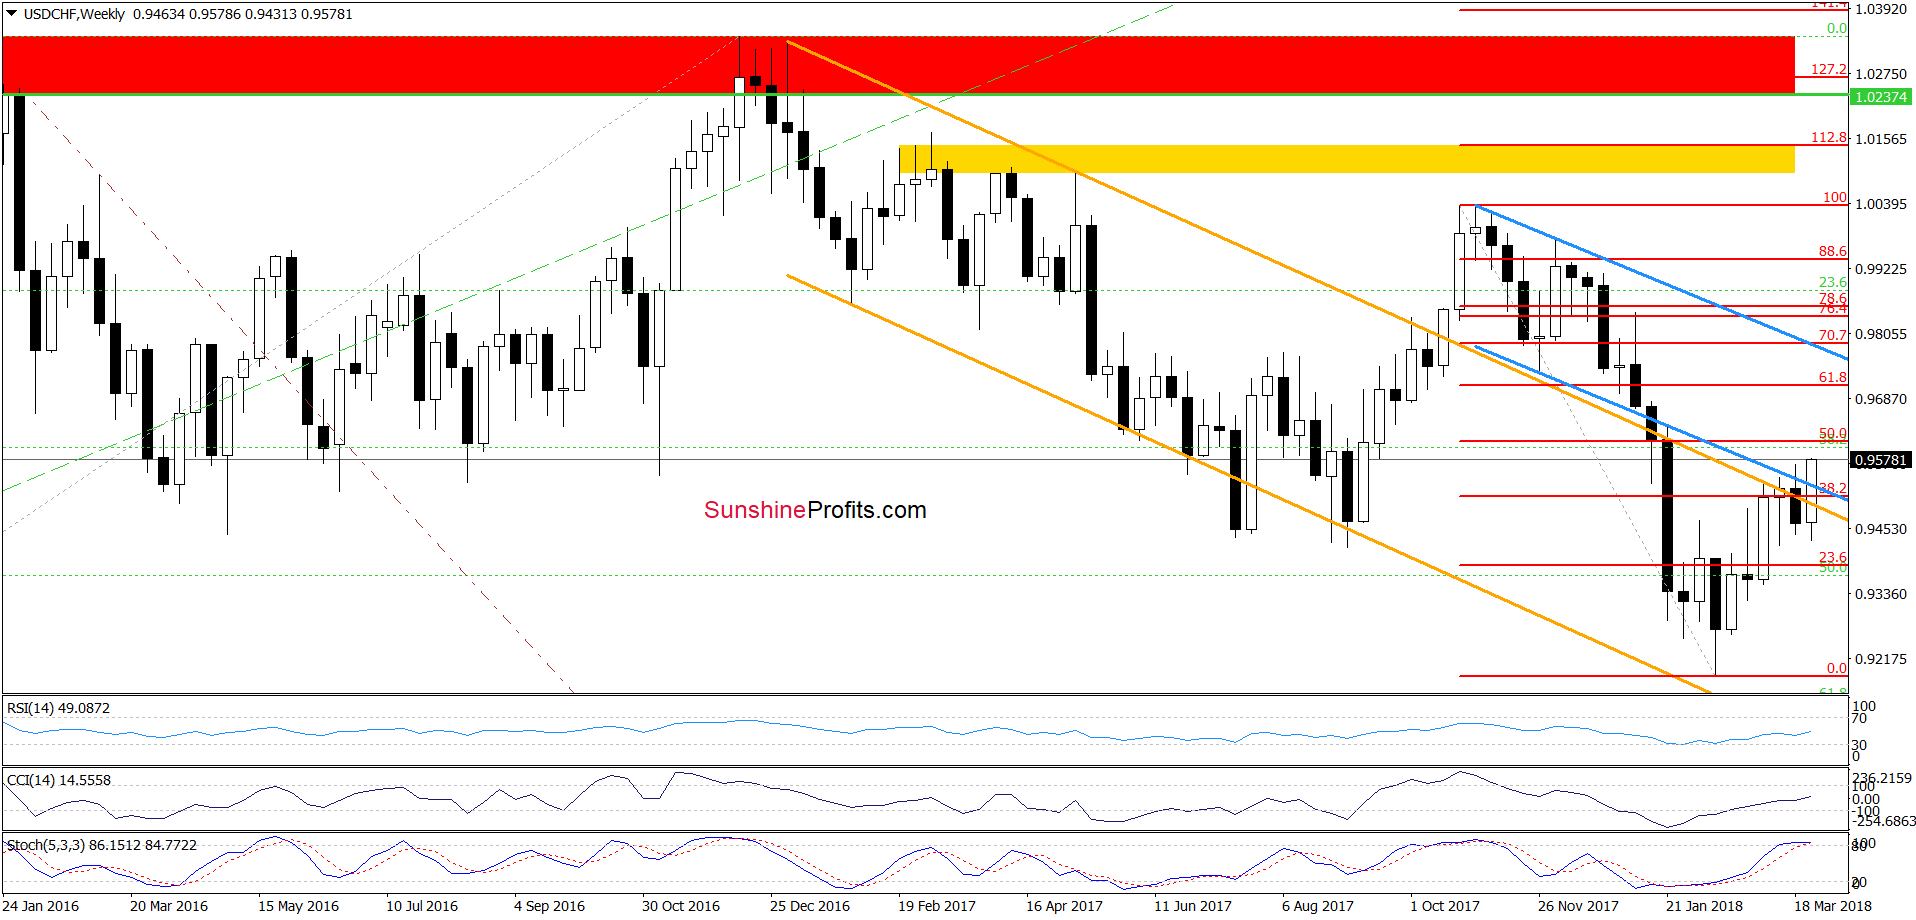
The first thing that catches the eye on the medium-term chart is the breakout above the strong resistance zone created by the upper line of the orange declining trend channel, the lower border of the blue declining trend channel and the 38.2% Fibonacci retracement. This is a bullish signal, which suggests that higher values of the exchange rate are just around the corner.
What impact did this increase have on the daily chart? Let’s check.
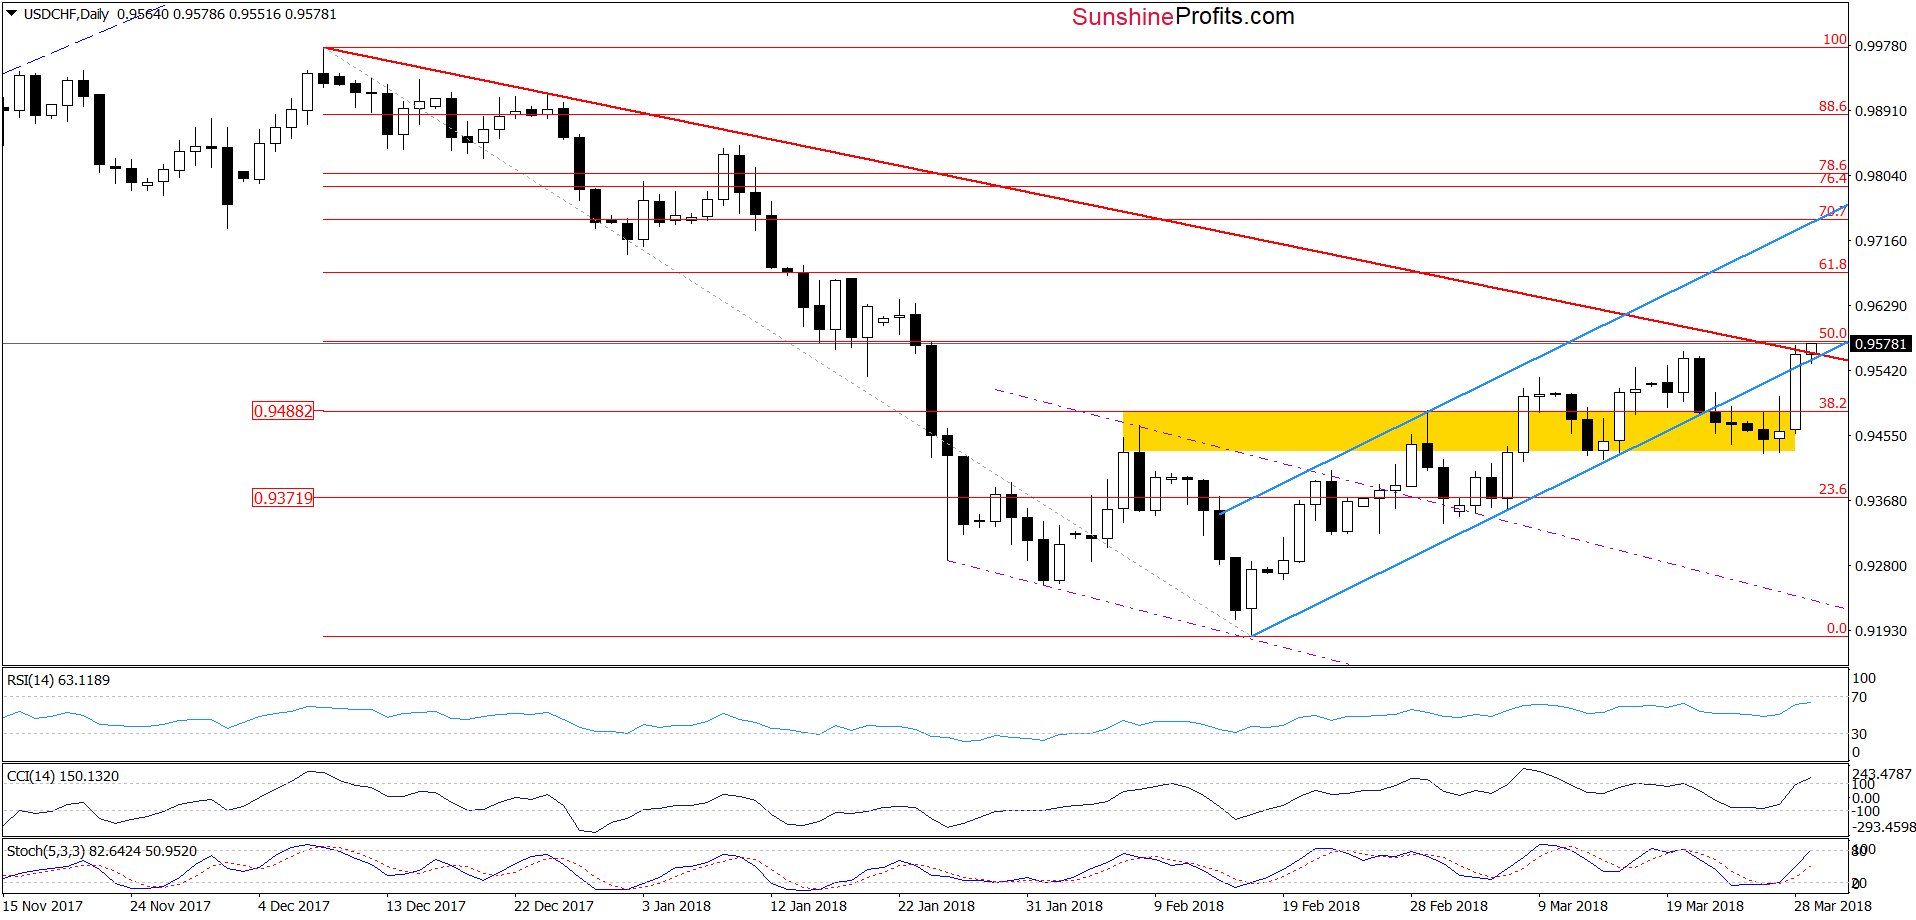
Looking at the very short-term chart, we see that USD/CHF not only invalidated the earlier breakdown under the lower border of the blue rising trend channel, but also climbed above the medium-term red declining resistance line based on the December 2017 peaks, which is a bullish development.
Additionally, the buy signals generated by the indicators remain in the cards, increasing the likelihood of further improvement. If this is the case and the pair closes today’s session above these resistances (and preferably above the 50% Fibonacci retracement), we can see a test of the 61.8% retracement or even the upper border of the blue rising trend channel (currently at 0.9736) in the following days.
If you enjoyed the above analysis and would like to receive free follow-ups, we encourage you to sign up for our daily newsletter – it’s free and if you don’t like it, you can unsubscribe with just 2 clicks. If you sign up today, you’ll also get 7 days of free access to our premium daily Oil Trading Alerts as well as Gold & Silver Trading Alerts. Sign up now.
Thank you.
Nadia Simmons
Forex & Oil Trading Strategist
Przemyslaw Radomski, CFA
Founder, Editor-in-chief, Gold & Silver Fund Manager
Gold & Silver Trading Alerts
Forex Trading Alerts
Oil Investment Updates
Oil Trading Alerts
