

This time is different. This is what the experts say. The inversion of the yield curve did a great job in predicting recessions in the past, but the current inversion is not like the previous. The predictive power of the yield curve has weakened, so it does not signal the recession. This is what the pundits claim. Are they right?
First of all, many doubt whether we can really trust the signals sent by the yield curve, given that the central banks heavily intervened in the bond markets in the aftermath of the Great Recession. When the short-term interest rates reached almost zero, the Fed started to buy many securities to lower the long-term yields, which flattened the yield curve. So it might be the case that without the U.S. central bank's impact on the bond prices, the yield curve would be steeper or even not inverted. In other words, it might be the case the yield curve is inverted only because the long-term rates are artificially compressed. If true, the yield curve can be inverted even if short-term interest rates remain stimulative to the real economy (they are not above the 'true' level of long-term yields which reflect the neutral rates) and thus are not serving to depress activity.
While this reasoning is plausible, there are two problems with it. First, the Fed ended its quantitative easing program long time ago, and it has been conducted recently quantitative tightening. Second, there is a lot of uncertainty around the effects of QE on interest rates. Hence, as the San Francisco Fed economists noted,
there is no clear evidence in the data that 'this time is different' or that forecasters should ignore part of the current yield curve flattening because of the presumed macro-financial effects of QE.
Second concern about the current predictive power of the yield curve refers to easy financial conditions. The inverted yield curve should reflect tightened financial conditions and desperate entrepreneurs scrambling for funds, bidding up short-term rates. But, as the chart below show, the financial conditions remain easy (negative values indicate financial conditions that are looser than average).
Chart 1: Yield curve (green line, spread between 10-year and 3-month Treasuries, monthly averages, in %) and the Chicago Fed National Financial Conditions Index (blue line, index) from January 1971 to June 2019.
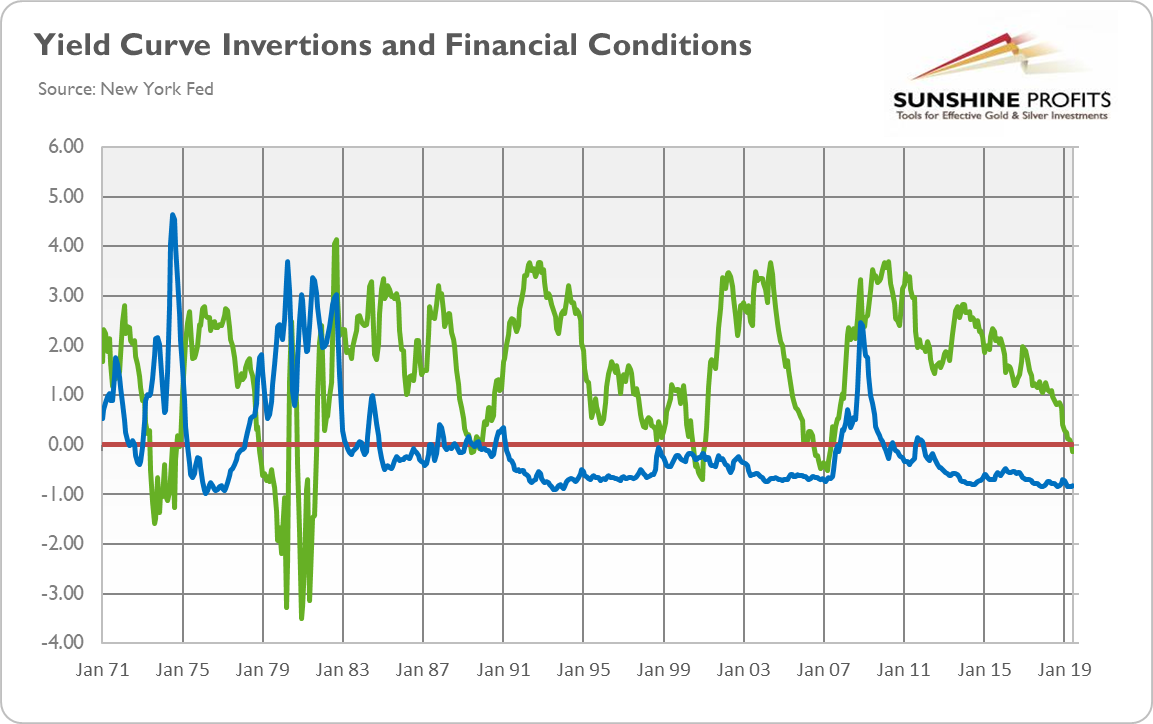
That's true. However, the financial conditions are very often a lagging indicator, as banks turn off the credit tap only after the crisis come. Liquidity is an illusory concept. It may seem to be abundant and always just there, but when market stress occurs, liquidity often disappears. Please take one more look at the chart above. The financial conditions become positive, i.e., tighter than on average, only in November 2007, just one month before the Great Recession officially began. And during the 2001 recession which occurred after the burst of the dot-com bubble, the financial conditions remained easy all the time!
Third, what about the reason behind the recent inversion of the yield curve? In the April edition of the Gold Market Overview, we pointed out that the March inversion of the yield curve happened not because the short-term interest rates rose abruptly, as the Fed tried to stop the overheating of the economy and prevent the rise of inflation, but because the long-term bonds yield declined, as investors became more pessimistic and started to expect interest rates to be lower in the future.
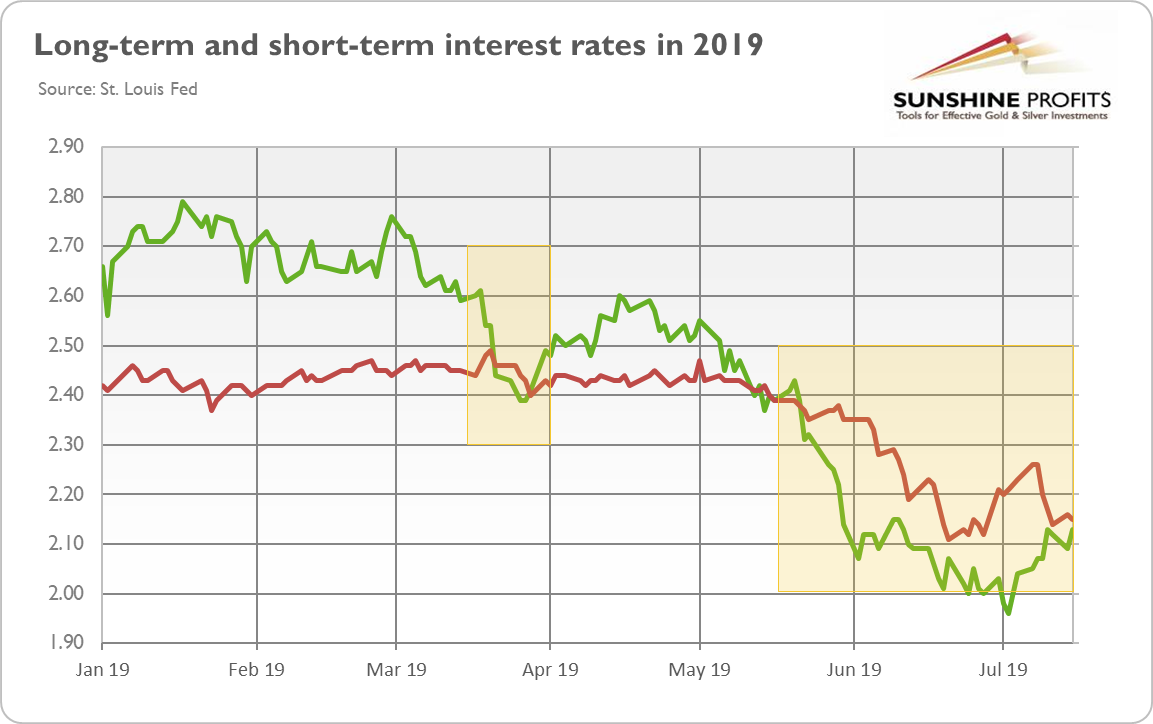
We were right. The immediate reason behind the March inversion was the drop in the long-term interest rates, as the chart below clearly shows. The same applies to the May inversion. Actually, that case was even more counterintuitive, as the short-term interest rates declined, not rose! The yield curve inverted because the long-term yields plunged even more.
Chart 2: Long-term interest rates (green line, 10-year Treasuries) and short-term interest rates (red line, 3-month Treasuries) from January 2015 to July 2019.
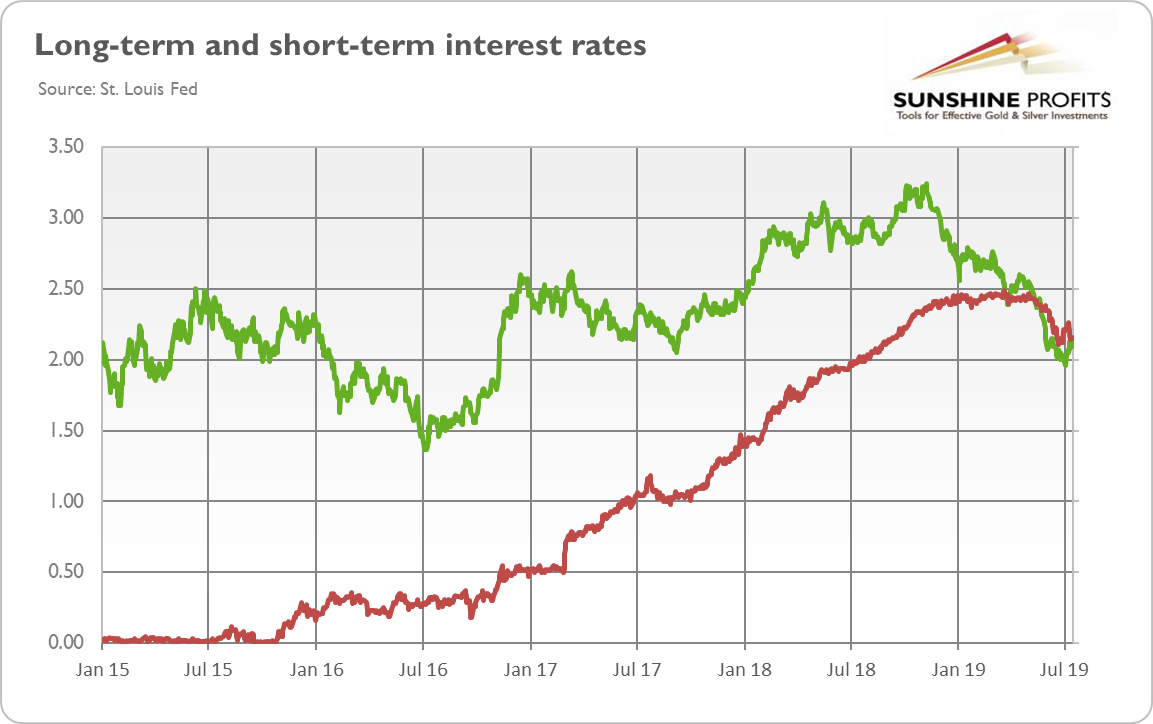
However, everything makes sense, when adopting a long-term view. So, let's take a look at the next chart, zooming out the bond yields. As one can see, the long-term interest rates remain in the sideways trend, while the short-term interest rates increased substantially since 2015 when the Fed started its tightening cycle.
Chart 3: Long-term interest rates (green line, 10-year Treasuries) and short-term interest rates (red line, 3-month Treasuries) from January 2015 to July 2019.
Hence, everything fits the standard theory of the yield curve inversion. But even if it does not, it does not matter, actually. According to the San Francisco Fed's paper we've already cited, inversion predicts slump, regardless of the driver. In other words, only the difference between the interest rates matters for recession predictions.
The bottom line is clear. The future cannot be guaranteed, but the past shows that each time the pundits reassured us that 'this time is different', they were wrong. As long as the yield curve remained flat but positive, we downplayed fearmongering about the imminent recession. When the yield curve inverted shortly in March, we were disturbed, but still far from panicking. But when the key spread, calculated on a daily basis, dived deeper into negative territory and for longer in May, while the monthly average inverted in June, we had to acknowledge that the recessionary odds in the US several months ahead increased substantially. Precious metals investors should act accordingly, adjusting their portfolios to the heightened risk of recession.
If you enjoyed the above analysis and would you like to know more about the fundamentals of the gold market, we invite you to read the August Gold Market Overview report. If you're interested in the detailed price analysis and price projections with targets, we invite you to sign up for our Gold & Silver Trading Alerts. If you're not ready to subscribe yet and are not on our gold mailing list yet, we urge you to sign up. It's free and if you don't like it, you can easily unsubscribe. Sign up today!
Thank you.
Arkadiusz Sieron
Sunshine Profits' Gold News Monitor and Gold Market Overview Editor
