

Silver and mining stocks declined for yet another day, but this time gold ended the session with a (slight, but still) gain. How can we interpret the latter? Is it a sign of strength?
In short, not at all. In yesterday’s alert we emphasized that gold’s breakdown was one of the key developments that one should consider while analyzing the precious metals market. The tiny upswing that we saw in gold yesterday was a classic example of a post-breakout pause. Let’s take a closer look (chart courtesy of http://stockcharts.com).
In yesterday’s alert, we wrote exactly the following:
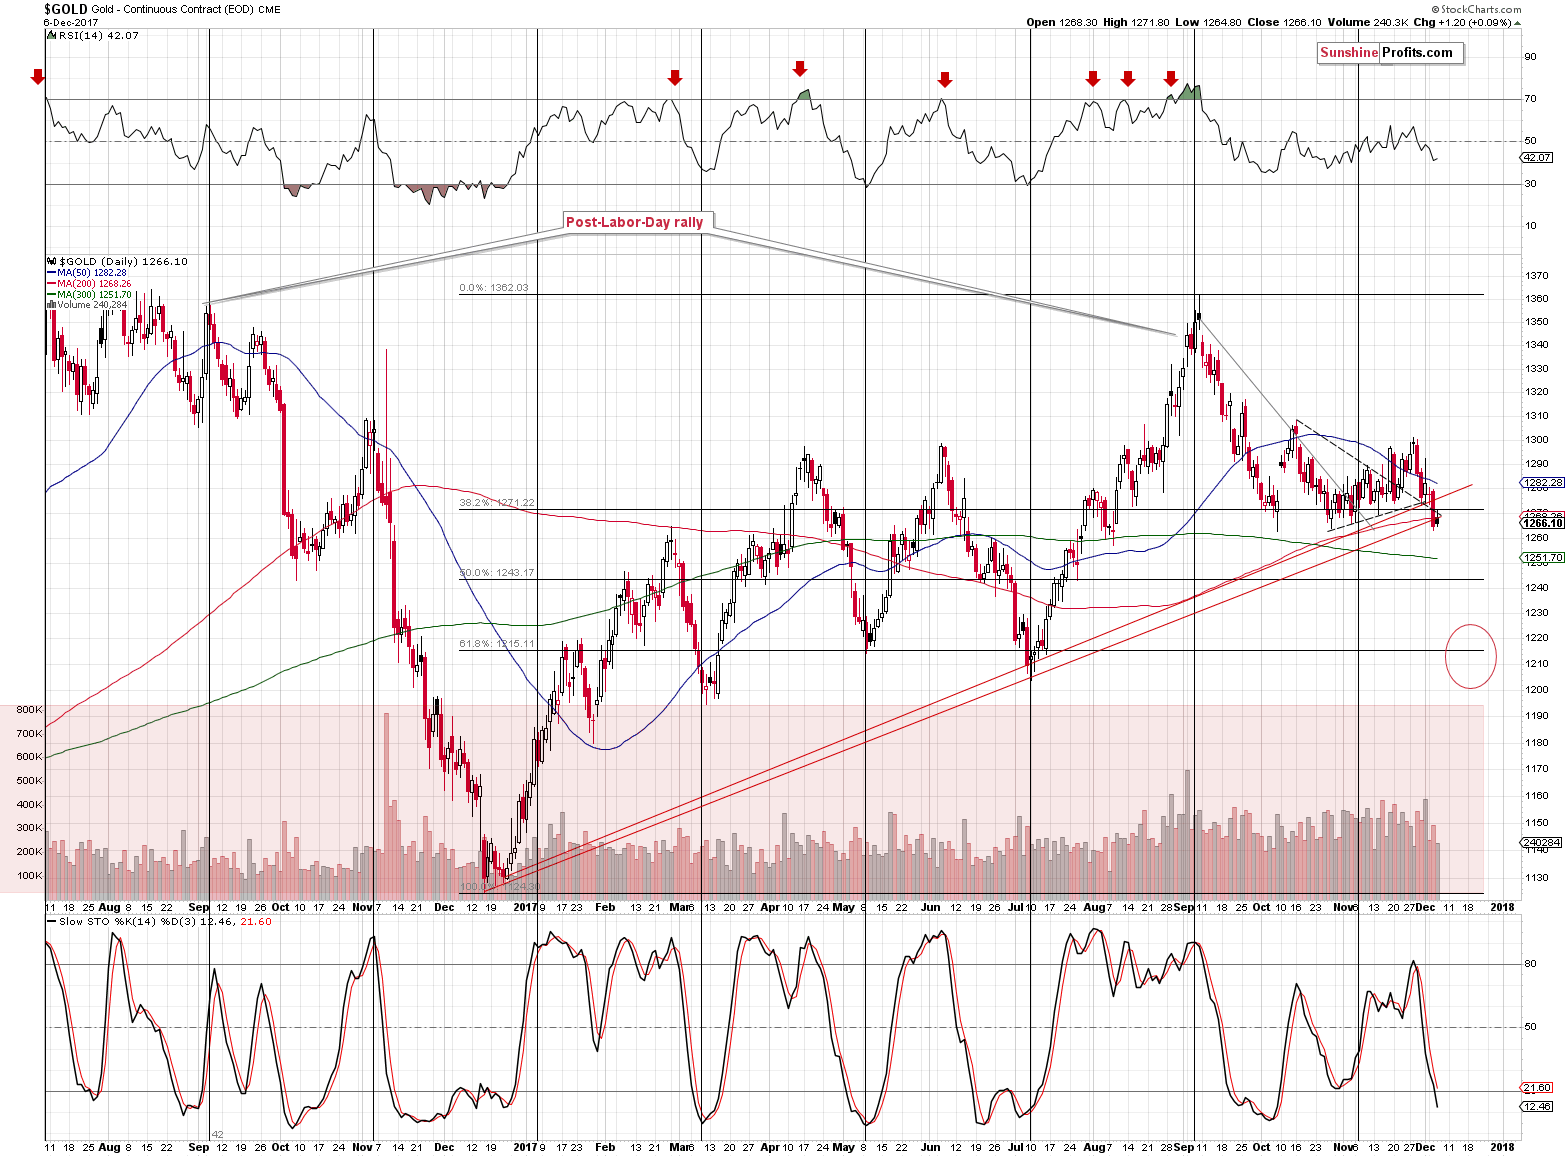
Gold closed yesterday’s session below both rising support lines, but the most important thing is that it closed it below the line based on the daily closing prices (it’s currently at about $1,275) and that the move below it was rather significant.
The breakdown is not yet confirmed, but it appears that it will be confirmed shortly, especially if the USD continues to move higher. The next support is just above $1,200, so that’s where gold is most likely headed. As discussed earlier today, the bigger the consolidation, the bigger the move is likely to follow and in this case, it means that gold should move visibly lower, not just several dollars lower. Again, it doesn’t seem that the decline is close to being over – at least not in terms of price.
Another daily close below both rising support lines is a step closer toward a confirmation of a breakdown and the fact that the volume was low adds to the credibility of the bearish case. The same goes for today’s pre-market action. At the moment of writing these words, gold is about $5 lower, so the odds are that the session will end below the rising support/resistance lines once again and that the breakdown will be fully confirmed.
The mentioned lines are clearly visible, so it’s very likely that this breakdown will be viewed as a key technical development for many traders and that it will result in lower prices relatively soon.
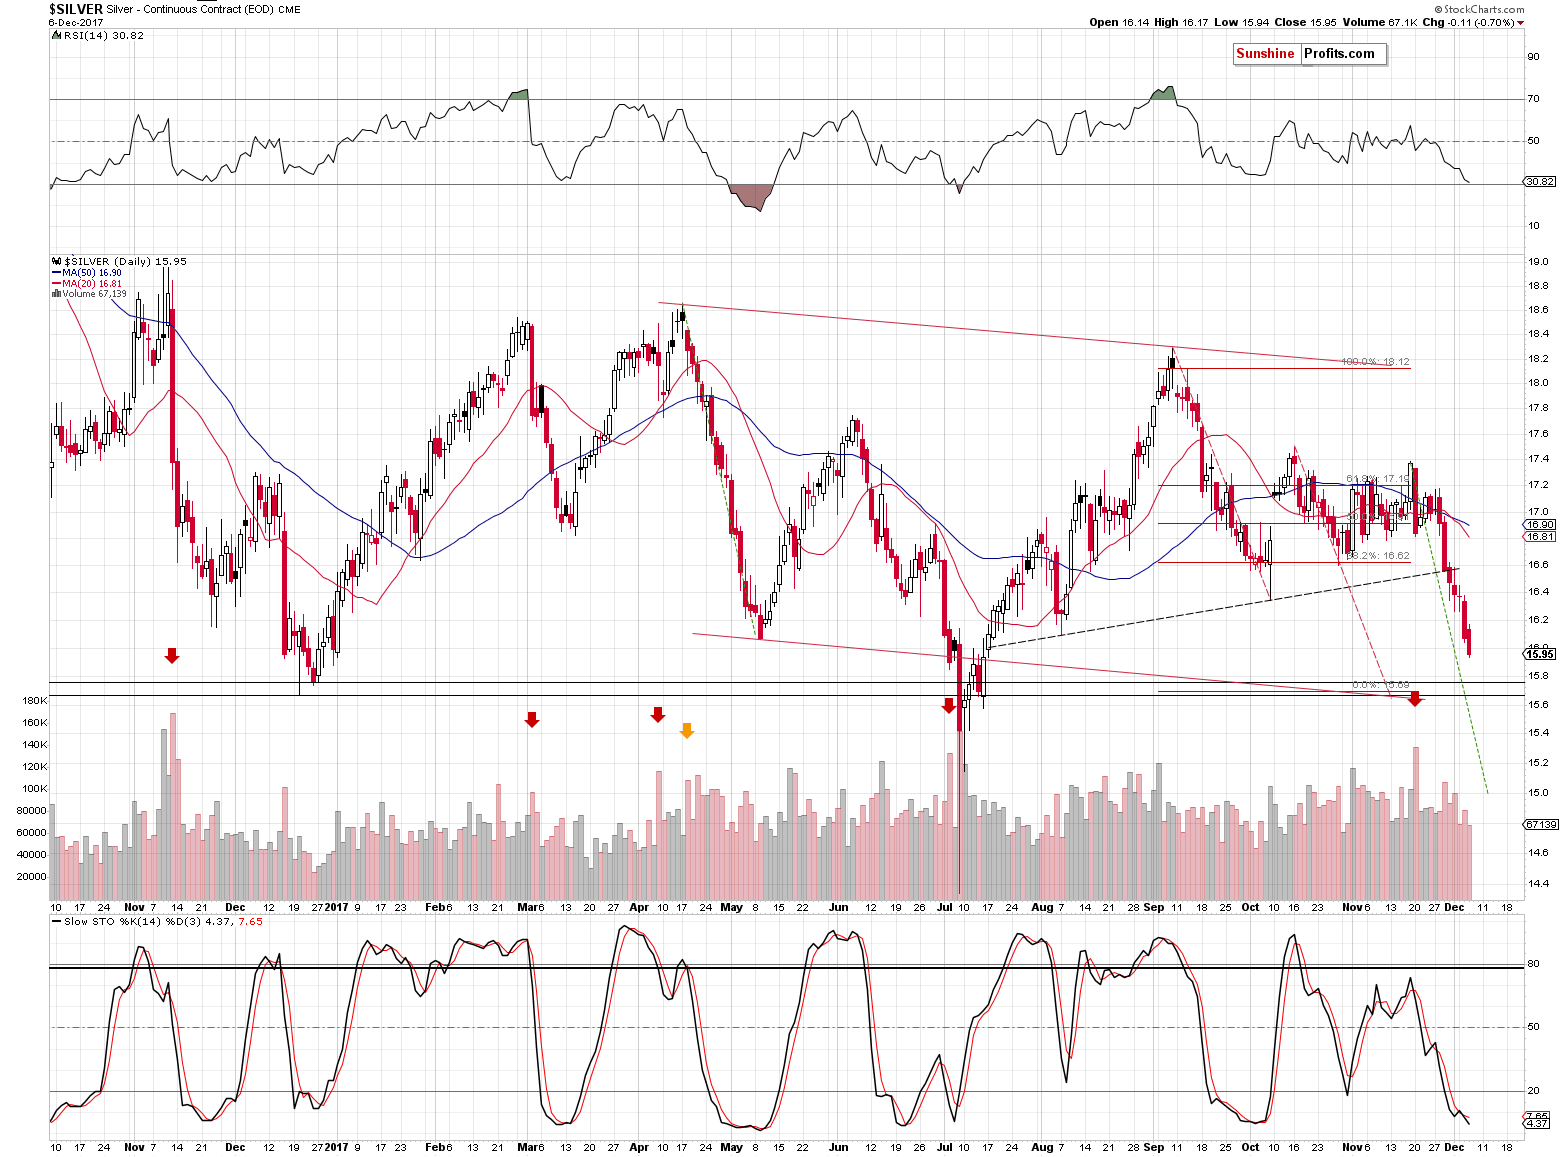
Meanwhile, the price of silver continues to march lower, just as we had expected it to. The one thing that we would like to add today is that silver just broke below its May bottom and since it continues to move lower in today’s pre-market trading, it seems that the breakdown will be confirmed.
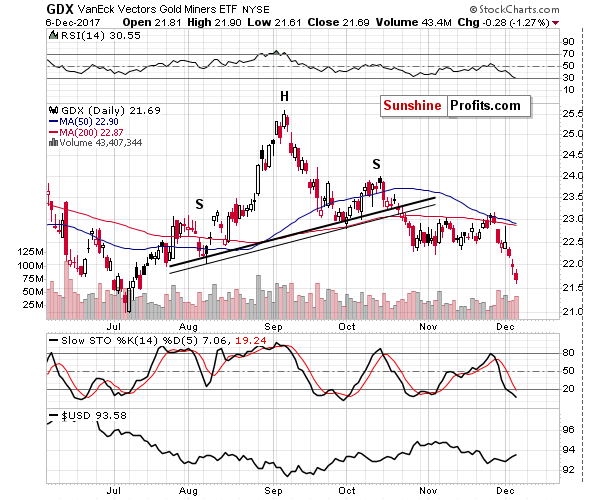
Mining stocks continued to decline and underperform gold and it can’t be explained by looking at the general stock market – it paused yesterday and the past few months saw almost consistently higher S&P 500 levels. The implications of yesterday’s session are clearly bearish. Moreover, we realize that we wrote this dozens of times, but it’s worth repeating once again – the extent to which mining stocks underperform gold and the time in which they’ve been doing so (months) is a major confirmation of the analogy between the current situation and the pre-2013 slide. The implications are extremely bearish for the following weeks and months… Especially that we just saw a major breakdown in the HUI:gold ratio.
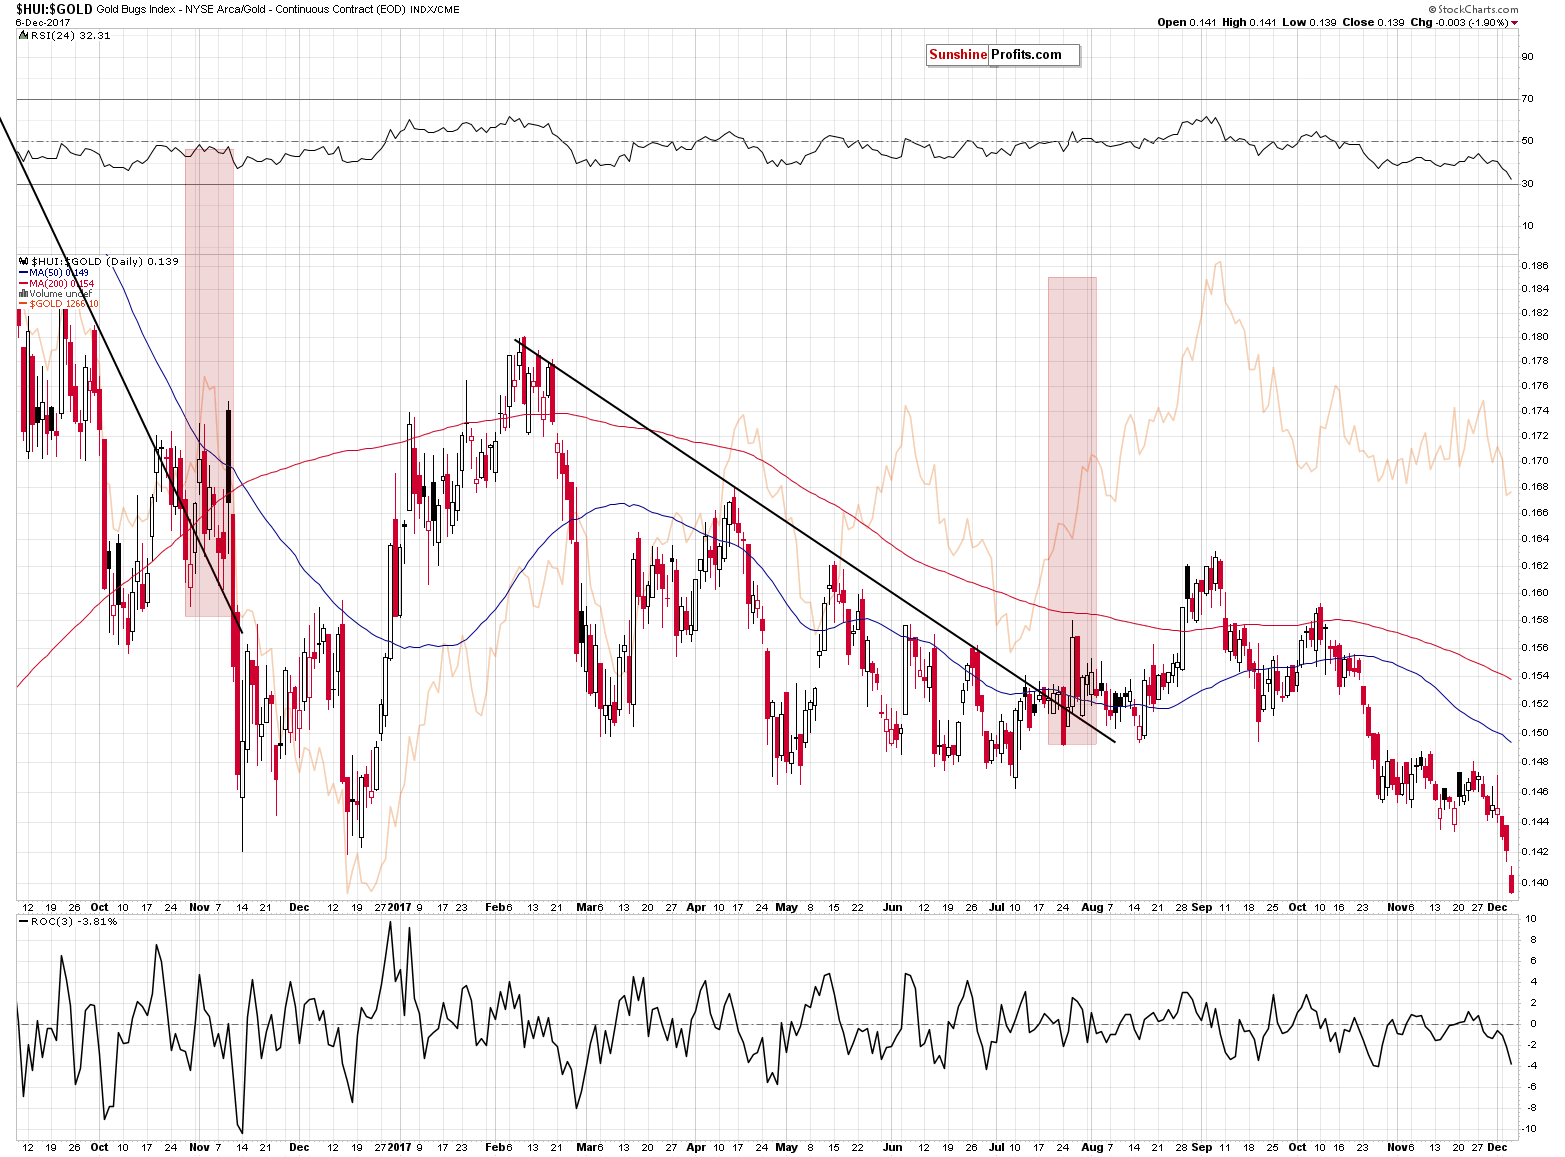
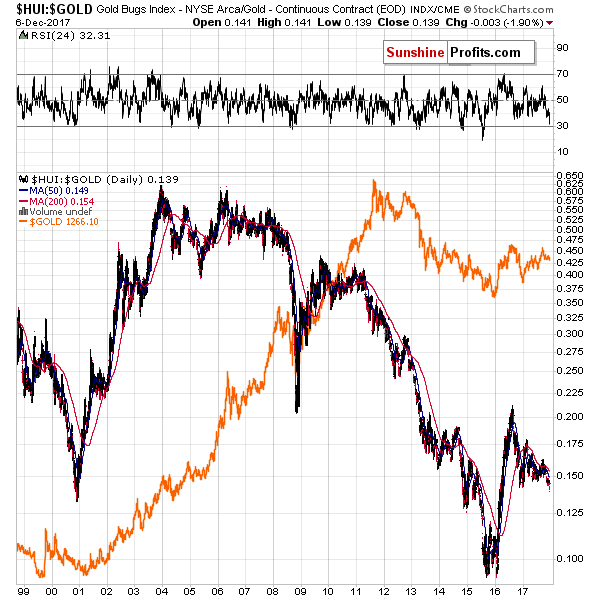
The breakdown below the 2016 low in the gold stocks to gold ratio was already visible based on Tuesday’s closing prices, but it was tiny. It was yesterday’s price action that made it clear.
The long-term chart shows that the implications are much bigger than it might appear at first sight. The reason is that there is almost no important support all the way down until the 2015 bottom (below 0.1) with the small exceptions of the 2000 low and the 2014 low.
Interestingly, both mentioned lows took place in the final part of the respective years, which makes it quite likely that we could see a temporary turnaround from those levels this month. If the ratio was to temporarily (!) bottom at about 0.13 and gold was to bottom at about $1,220, then this implies a target for the HUI Index just a little below 160. In yesterday’s alert, we wrote about 163 as the likely temporary target based on a dynamic analogy to the size of the decline that we had already seen (by the way, we also discussed the target for silver). The above charts seem to confirm it.
Summing up, it seems that the decline in the precious metals market is not very close to being over in terms of price. We might see a visible corrective upswing next week, but this correction could start at much lower levels based on the breakdown in gold and the way PMs react to the changes in the USD Index. For now, the outlook remains bearish as there are myriads of signals that support a decline in the price of gold in December.
We hope you enjoyed today’s analysis, even though it might appear controversial. If you’d like to receive follow-ups, we invite you to subscribe to our Gold & Silver Trading Alerts.
Thank you.
Sincerely,
Przemyslaw Radomski, CFA
Founder, Editor-in-chief, Gold & Silver Fund Manager
Gold & Silver Trading Alerts
Forex Trading Alerts
Oil Investment Updates
Oil Trading Alerts
