
Visit our archives for more gold articles.
The World Gold Council published a report last week that raises a few important questions and quite a few eyebrows, so let's examine it.
You can access the report here. We recommend that you read it, but if you're not going to go through the entire report, please just take a look at its first page and the chart with total demand for gold from 2003 to 2012.
The thing that got people concerned is the decline in demand and in particular the decline in the investment demand. First, let's take a closer look at the decline in total demand. The key point here is that it's not the first time that we see a y-o-y decline in demand. We saw the same in 2006 and in 2009. Guess what price did in the following years - 2007 and 2010? It rallied strongly in both cases. In 2007 gold rallied 31% and in 2010 gold rallied 29%. If gold is to close 2013 30% higher than it closed 2012, then the price for the end of this year would be $2,176.
To measure the investment demand we summed up two columns: "total bar and coin investment" and "ETFs and similar" (source: World Gold Council).
| Year | Total bar and coin investment | ETFs and similar | Sum | YoY change |
|---|---|---|---|---|
| 2003 | 304 | - | 304 | - |
| 2004 | 355 | 133 | 488 | 60.5% |
| 2005 | 396 | 208 | 604 | 23.8% |
| 2006 | 414 | 260 | 674 | 11.6% |
| 2007 | 435 | 253 | 688 | 2.1% |
| 2008 | 869 | 321 | 1190 | 73.0% |
| 2009 | 780 | 623 | 1403 | 17.9% |
| 2010 | 1205 | 382 | 1587 | 13.1% |
| 2011 | 1515 | 185 | 1700 | 7.1% |
| 2012 | 1256 | 279 | 1535 | -9.7% |
The sum of the two has actually decreased for the first time since this bull market began over 10 years ago. Should this be surprising? Investment demand is very different from regular demand for any good. Normal demand decreases with prices as people don't want to buy things that are getting expensive. With investment goods, it's the other way around because investors that see higher prices tend to extrapolate the trend and buy the expensive asset believing that the price will move even higher in the future. Gold price didn't do much in the second half of 2011 and throughout the whole 2012 - it seems natural to expect investors to be discouraged and thus to invest less.
The dip in demand would likely be bigger this year because of the increased demand in India in 2012 due to expected tariffs increase on gold imports this year. Without this "early demand" we would be likely looking at even lower values.
Is that a bad thing? Not necessarily, because this is something that shows that investors' optimism has declined. In the Feb 8 gold article we wrote the following:
We would like to add that the time factor may make this consolidation significant. Less than 40 years ago the correction took gold much lower - about half of the previous high - before the final rally in gold materialized. At this time we think that the prolonged consolidation might have been enough and gold doesn't have to move even lower - the lack of a rally might have been enough to make people throw in the towel.
Lower investment demand indicates just that - lower levels of investor optimism. The data shows that the correction is actually more discouraging and profound than it seems if you take a look at the price only. The decline in investment demand simply confirms that the price may NOT have to move much lower because the damage to the investor sentiment has already been done. Consequently, it's not a bearish piece of information.
Another important thing visible in the report is what we've been writing about for quite some time - that the official sector is now buying gold instead of selling it. While this makes us a bit concerned as the governments tend to be the worst investors, it is a very positive factor for gold in the years to come. Governments may say what they have to say (just what they have always done) but the money will flow in tune with what they really think. And it's flowing into gold and countries are either demanding their gold back (Germany) or seriously considering it.
Since we analyzed the gold charts themselves in our last gold article, today we would like to focus on the currency markets as they seem to exert the most influence on precious metals in the medium- and long term. We'll start with the Euro Index short-term chart (charts courtesy by http://stockcharts.com)
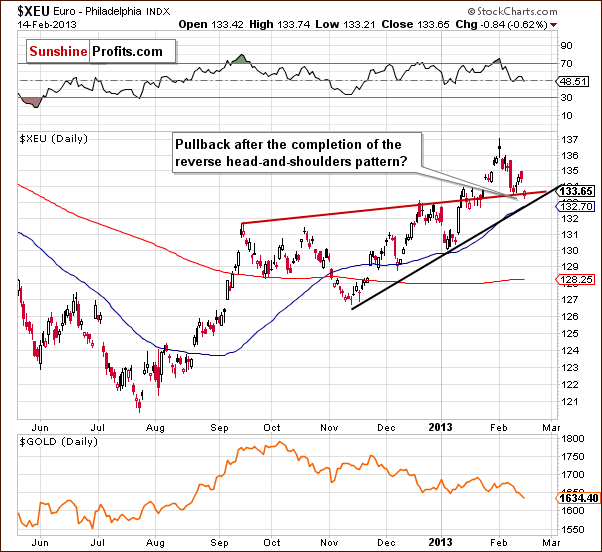
We see that the index declined on Thursday and also earlier this month. These declines appear to be a verification of the reverse head-and-shoulders pattern and the implications remain bullish at this time.
The same can be said about the implications of the short-term trend - the currency remains above the short-term support line.
Let us now move on to the U.S. dollar with the USD Index serving as a proxy here.
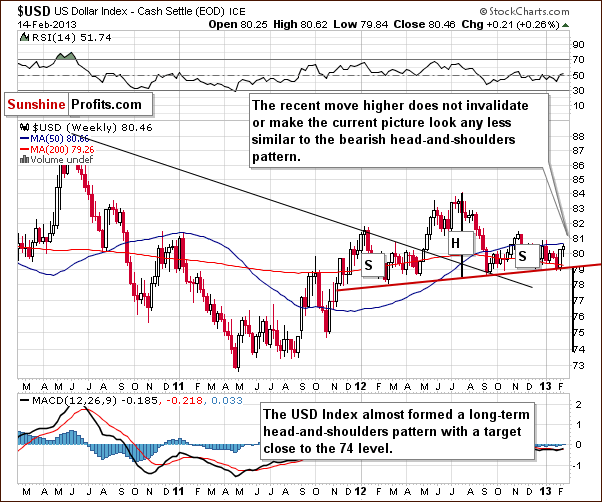
In the medium-term USD Index chart, we see that significant declines followed the 2012 top. Since then, a prolonged consolidation period has been seen and the period of declines ahead after such a lengthy consolidation could very well continue and complete the head-and-shoulders pattern in the coming weeks. This would have very negative consequences for the dollar.
Now, we'll have a look at the short-term picture of the USD market.
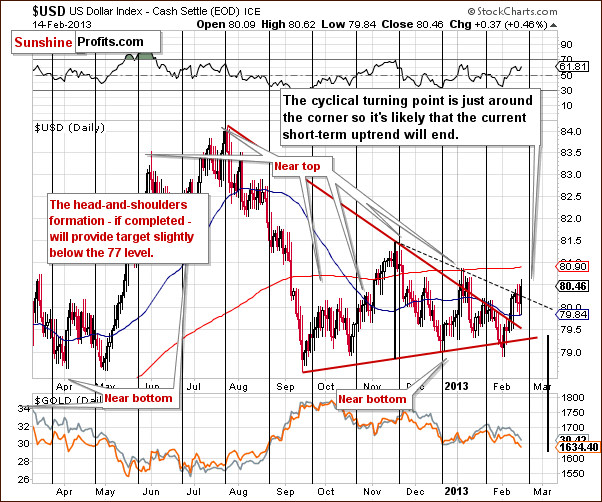
Many investors may now be asking themselves, "Will a breakdown be seen anytime soon?" In the short-term USD Index chart, the fact is that we see that a cyclical turning point is coming very soon. With the preceding move to the upside, we could very well see the long awaited medium-term decline begin. With each consecutive attempt to break down below the support line (neck level of the head-and-shoulders pattern), the odds of success increase slightly. It once again seems that a successful breakdown will be seen soon, and the head-and-shoulders pattern will be completed.
Summing up, current situation in the gold market - as indicated by the abovementioned World Gold Council report - seems to be a good foundation for the substantial rally that we believe will materialize in the coming months. Investor's optimism has clearly cooled off and the institutional part of the market carries on buying more and more of the yellow metal.
The overall situation remains bearish for the USD Index even though the index has rallied a bit this month. The weeks ahead will likely see the index level move to the downside.Once the index reverses direction, a bigger rally will likely be seen in the precious metals sector.
The week has barely begun but we have already posted an Extra Premium Update and a Market Alert - the reason is the critical situation on the gold market and in the mining stocks. The most important question that gold investors and traders are asking today is when and at what price will gold and silver bottom - and this is exactly what we comment on in these timely premium publications. We encourage you to join our subscribers and read this week's Extra Premium Update and Market Alert.
Thank you for reading.
Sincerely,
Przemyslaw Radomski, CFA
