
Based on the February 8th, 2013 Premium Update. Visit our archives for more gold articles.
In our previous essay we stepped back from the day-to-day price analysis in order to focus on the major event that happened recently on the silver market (the silver – JP Morgan manipulation lawsuit was dismissed) and today we would like to get back to the recent price moves, however, first, let’s discuss the current situation on the bond market.
A trend is a trend until it stops. Could this be the case for bonds? Is the bond bubble about to burst? And if so, what are the implications for precious metals?
Anyone following the financial press can see that analysts are rumbling that bond prices will fall when interest rates rise and that it will happen sooner than later. And we generally agree – you can’t lower interest rates below zero (who knows, maybe the Fed will surprise us calling that an unconventional but necessary move?) and since they are practically there, the ceiling is very close to the current bond valuations. The reason that bonds beat stocks over the past two decades is that interest rates have plunged making attractive the fixed income that bonds promise to pay. But the situation might as well change in the following years.
"Investors should be alert to the long-term inflationary thrust of such check writing" by the Fed, said Bill Gross, who runs the world's largest bond fund, in his January investment outlook. "While they are not likely to breathe fire in 2013, the inflationary dragons lurk in the 'out' years towards which long-term bond yields are measured."
Nearly 40% of the 32 investment strategists and money managers surveyed recently by CNNMoney think that interest rates will begin to rise in 2013, and another 30% say the shift will begin in 2014.
That would be even sooner than the Federal Reserve's projections. The central bank doesn't expect to raise the federal funds rate, the key interest rate that influences overall interest rates, until some time in 2015. The Fed said that it will keep its stimulus policies in place until the unemployment rate falls to 6.5%, which it doesn't think will happen before then. But whether that takes place this year or next, or in 2015, one doesn’t want to be stuck with major investments in bonds when it happens.
Waves come and go. The current bull market in bonds must end at some time in the future, sooner or later, not until inflation or interest rates rise. So far, the economy remains sluggish, real unemployment is high and inflation is minimal. But, sooner or later, investors will experience either a loss of money, or at best meager returns. If inflation eats away the value of bonds, those who hold gold in their portfolios may be able to compensate.
Let’s see how gold is performing this week. Let's begin with the analysis of the US Dollar Index as it will likely have a major impact on the price of yellow metal in the coming months. We will start with the long-term chart (charts courtesy by http://stockcharts.com.)
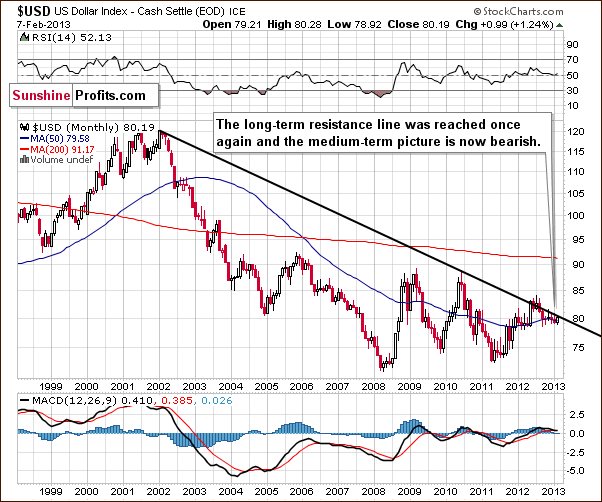
No significant changes are seen this week and the long-term trend for the USD Index remains down. Thursday’s rally did not take the index level above the long-term resistance line, so the outlook here from the long-term perspective remains bearish.
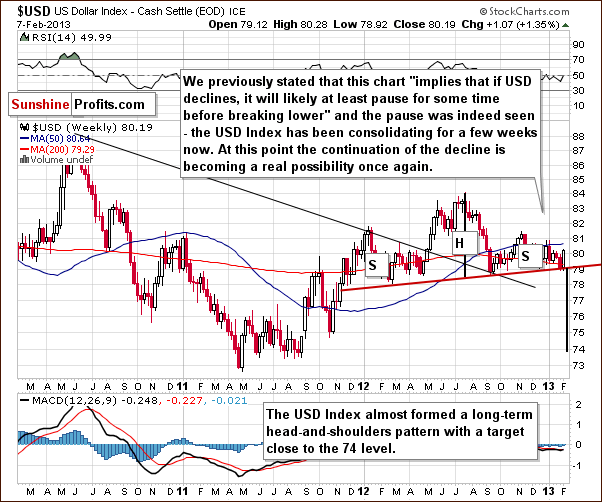
In the medium-tern USD Index chart, virtually nothing changed this week, although a move to the upside was seen on Wednesday-Thursday’s. The head-and-shoulders pattern is still not completed. A breakdown here below the neck level of the above-mentioned pattern - is quite probable and will likely lead to much bigger moves to the downside. These subsequent declines could stretch out for a period of weeks or even months.
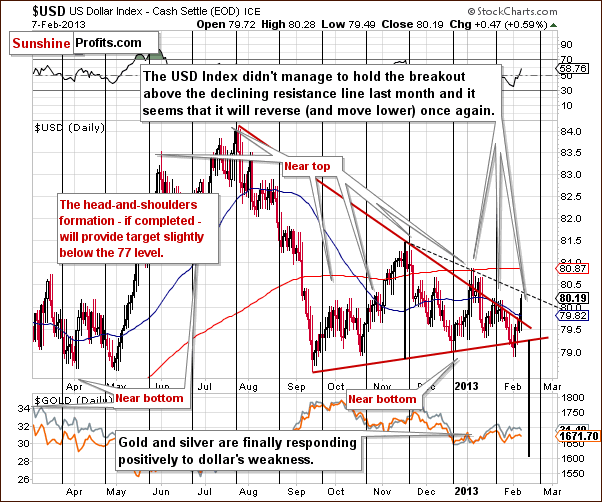
In the short-term USD Index chart, a rally above the medium-term declining resistance line based on the July-August and late-November highs last year was seen this week. As the beginning of the dashed line is at the Nov 2012 top (the one that created the medium-term support line) and the Jan 2013 high (the one that formed after prices tried breaking above the declining resistance line), it might be the case that this line represents the “how far too far can the index move and still go back down”. It’s simply our guesstimate based on two facts: each of the previous breakouts failed and the rally stopped right at the dashed line, thus confirming at least some significance thereof.
We still believe the next move seen here will be to the downside. With a cyclical turning point a bit more than a week away, sideways trading in the coming days will likely be quickly followed by a period of declines which could then trigger a rally in the precious metals sector.
At this point, let’s have a look what’s currently going on in the gold market.
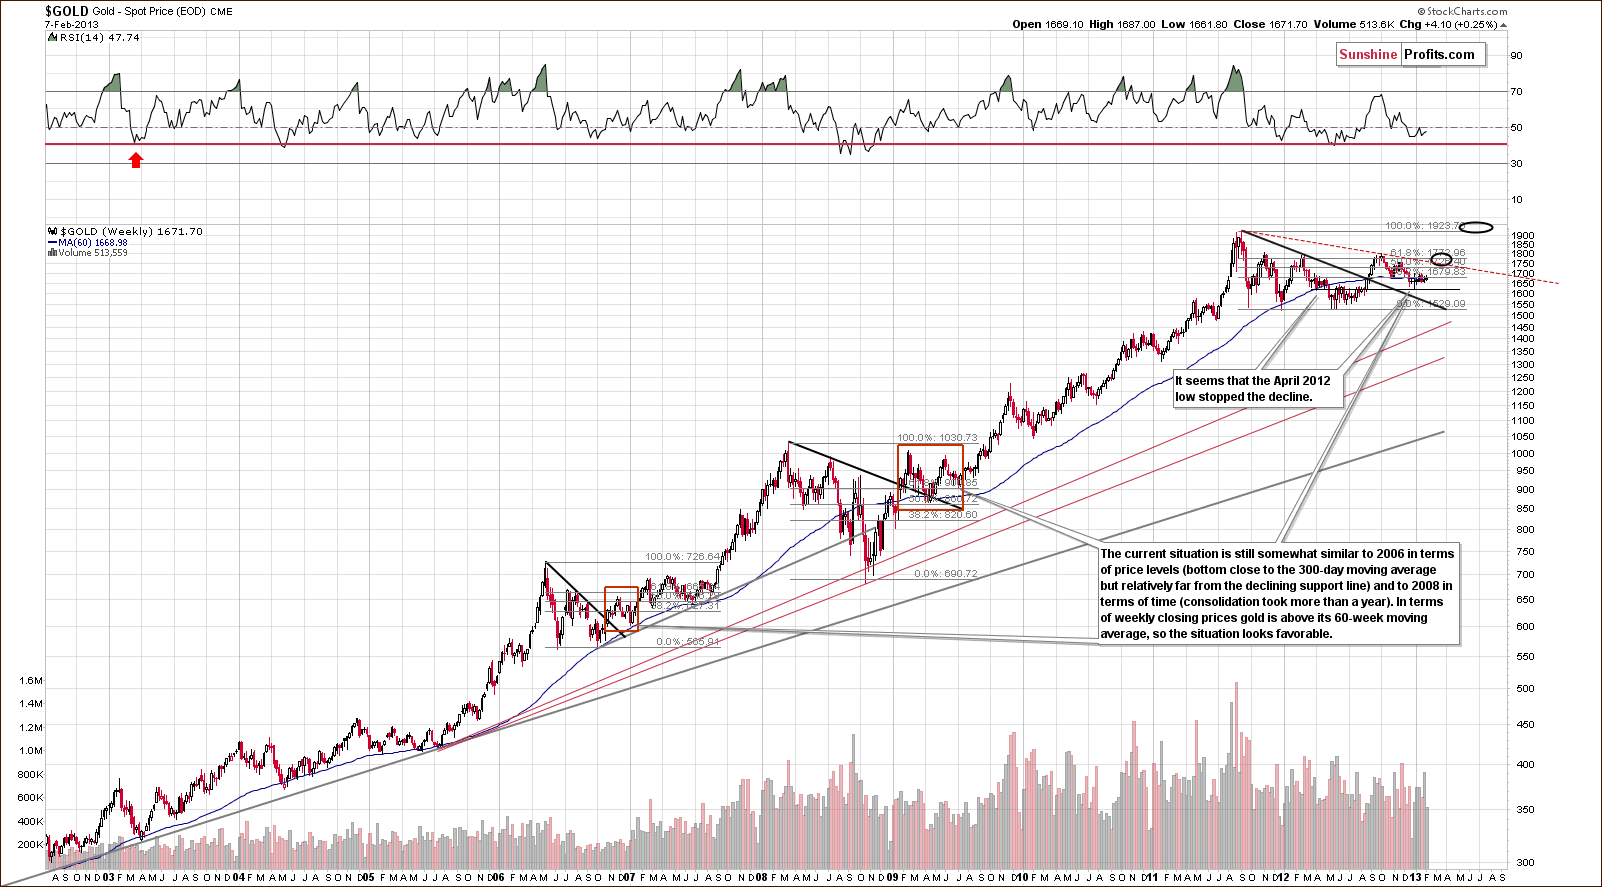
In the long-term gold chart the situation remains bullish. Gold prices consolidated after breaking out and the yellow metal is technically ready for a big rally. Comments made in our essay on the price of gold in February 2013 remain up-to-date:
The bottom was very likely formed here a few weeks ago when gold prices dipped below the 300-day moving average, which is a very important long-term technical development. Prices now appear to be simply consolidating a bit, which is also in tune with the historical patterns – the rally didn’t always start in a volatile way after the final bottom was reached below the 300-day MA – but it happened eventually many times and on each occasion the rally was worth waiting for.
On a short-term note, it is encouraging that gold did not decline much even though the dollar rallied quite sharply on Thursday.
Finally, we would like to share an observation that one of our subscribers shared with us along with our comments:
Q: I note in 2006-07 it took 76 weeks to make a new high for gold and in 2008 it took 78 weeks to make a new high in gold. We are now at week 74 in the gold cycle. Do you feel this is significant? I feel when it does move it will be to almost 1900 before a short- or medium-term correction. “When time is up, price will reverse. Time is more important than price.”--W. D. Gann (famous technical analyst.)
A: Yes, we feel this is significant and we expect to see a more volatile upswing in the coming weeks. We would like to add that the time factor may make this consolidation significant. Less than 40 years ago the correction took gold much lower - about half of the previous high - before the final rally in gold materialized. At this time we think that the prolonged consolidation might have been enough and gold doesn't have to move even lower - the lack of a rally might have been enough to make people throw in the towel.
Summing up, the situation in gold did not change much this week in terms of price and it remains bullish for the medium- and long term.
Even though it seems that not much happened on the precious metals market this week, our indicators suggest that a lot happened behind the surface. This week was very rich in signals on the part of the SP Indicators. We kept our subscribers updated on a daily basis and we posted detailed Premium Update earlier today that deals with short-term, medium-term, and long-term situation in gold, silver, platinum, mining stocks and related markets and ratios. The comprehensive analysis helps to be prepared for the coming moves - details regarding suggested trades are also provided - along with corresponding (optimized) stop-loss orders that limit the risk.
Today's Premium Update also includes our analysis of the gold and silver junior mining stocks and the up-to-date rankings of best gold and silver juniors. Interestingly, one of the companies that was just introduced to our ranking jumped right on the 3rd place. It looks particularly interesting as it represents one of the best types of performance that you can see. The company has been moving in tune with the whole sector (thus confirming that the exposure to gold) but the highs were higher and lows were higher than in the broad indices and this outperformance was steady, seen regularly. We encourage you to join our subscribers and also enjoy all of the above-mentioned benefits.
Thank you for reading. Have a great weekend and profitable week!
Sincerely,
Przemyslaw Radomski, CFA
