

Yesterday, EUR/USD verified the breakdown under the upper border of the trend channel and declined, closing the day below the early August peak. What does it mean for the exchange rate?
EUR/USD
On Tuesday, we wrote the following:
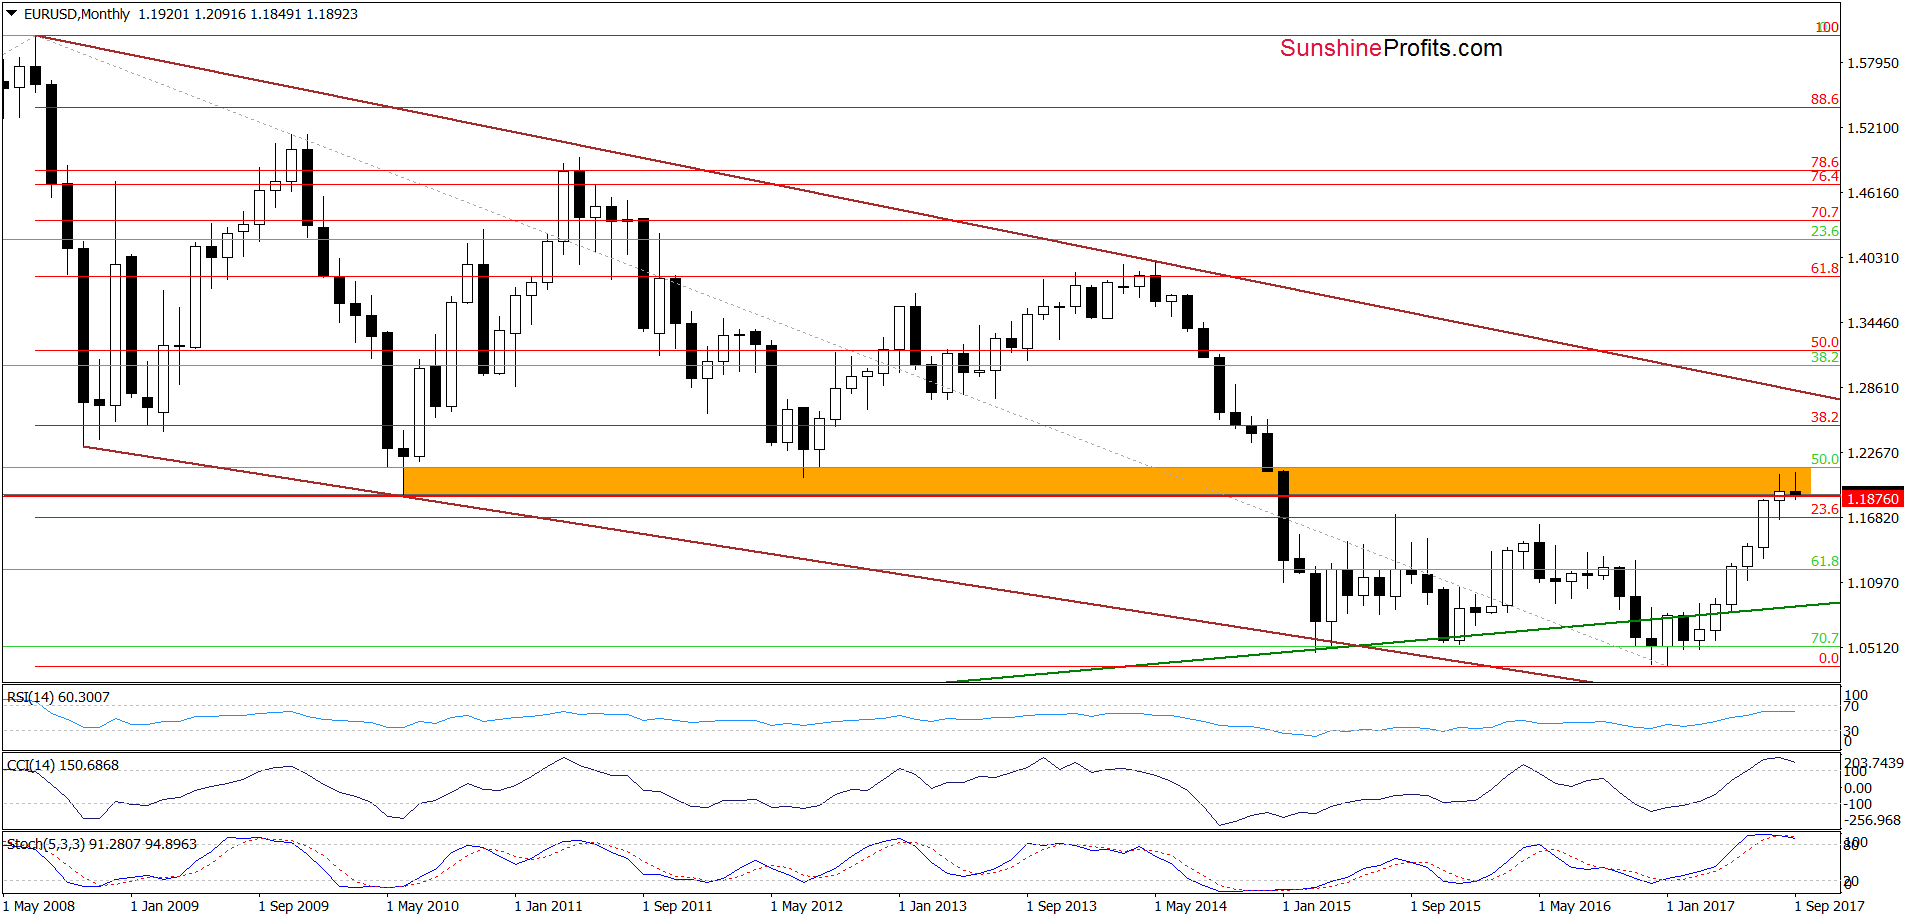
(…) on the long-term chart, we see that EUR/USD is still trading in the orange resistance zone. Additionally, indicators increased to the highest levels since April 2014. Back then, such high readings of the CCI and Stochastic Oscillator preceded bigger move to the downside, which suggests that we may see a similar price action in the coming week(s).
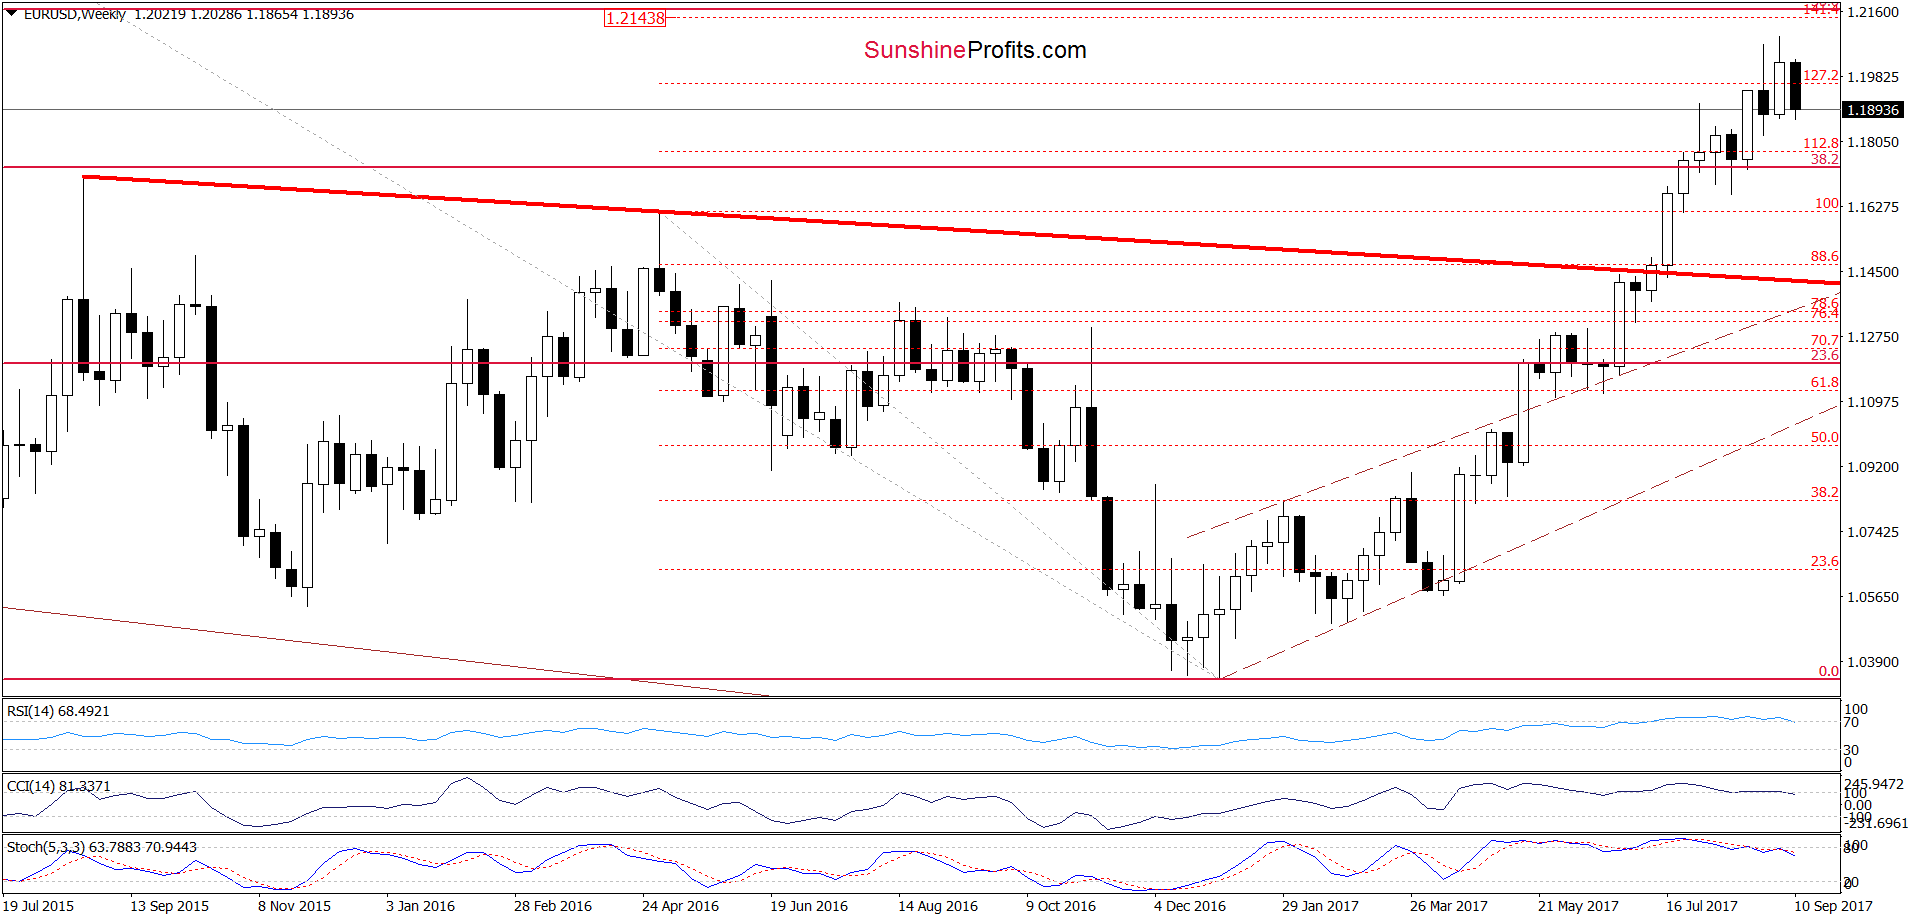
(…) on the medium-term chart (….), we can see that the CCI and Stochastic Oscillator already generated the sell signals, supporting currency bears. (…) we also see that the exchange rate is quite close to invalidating the earlier breakout above the 127.2% Fibonacci extension.
On top of that, (…), EUR/USD slipped below the upper border of the brown rising trend channel, invalidating the earlier breakout.
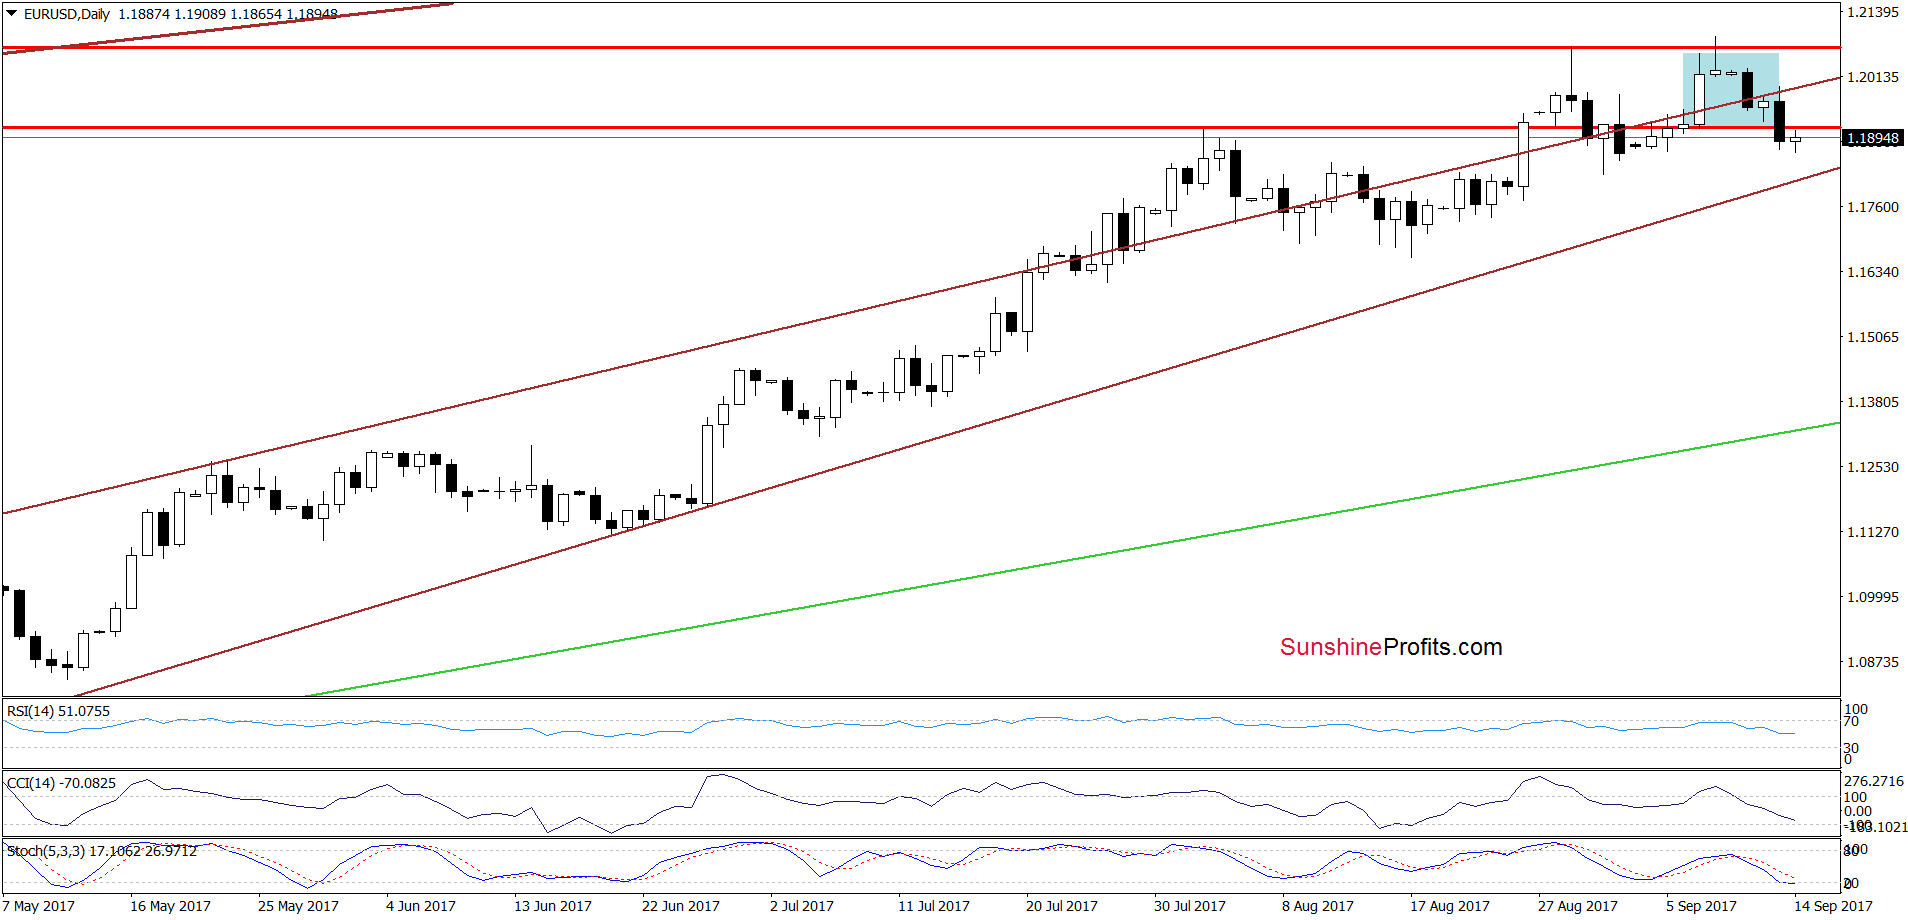
(…) the pair rebounded slightly, but taking into account all the above-mentioned factors and the sell signals generated by the daily indicators, we think that it’s nothing more than a verification of yesterday’s breakdown. If this is the case, we’ll see reversal and further deterioration in the very near future.
From today’s point of view, we see that the situation developed in line with the above scenario and EUR/USD declined after the verification of the earlier breakdown under the upper border of the brown rising trend channel marked on the daily chart. Thanks to yesterday’s drop the pair also slipped below the early August high and the 127.1% Fibonacci extension, invalidating the breakouts (additional bearish developments). Taking these facts into account and combining them with the current position of the monthly weekly and daily indicators, we believe that further deterioration is just around the corner. Therefore, if the pair extends losses from today’s levels, the next target for currency bears will be the lower border of the brown rising trend channel (currently around 1.1810). If this support is broken, the way to lower levels will be open.
Very short-term outlook: bearish
Short-term outlook: mixed with bearish bias
MT outlook: mixed
LT outlook: mixed
GBP/USD
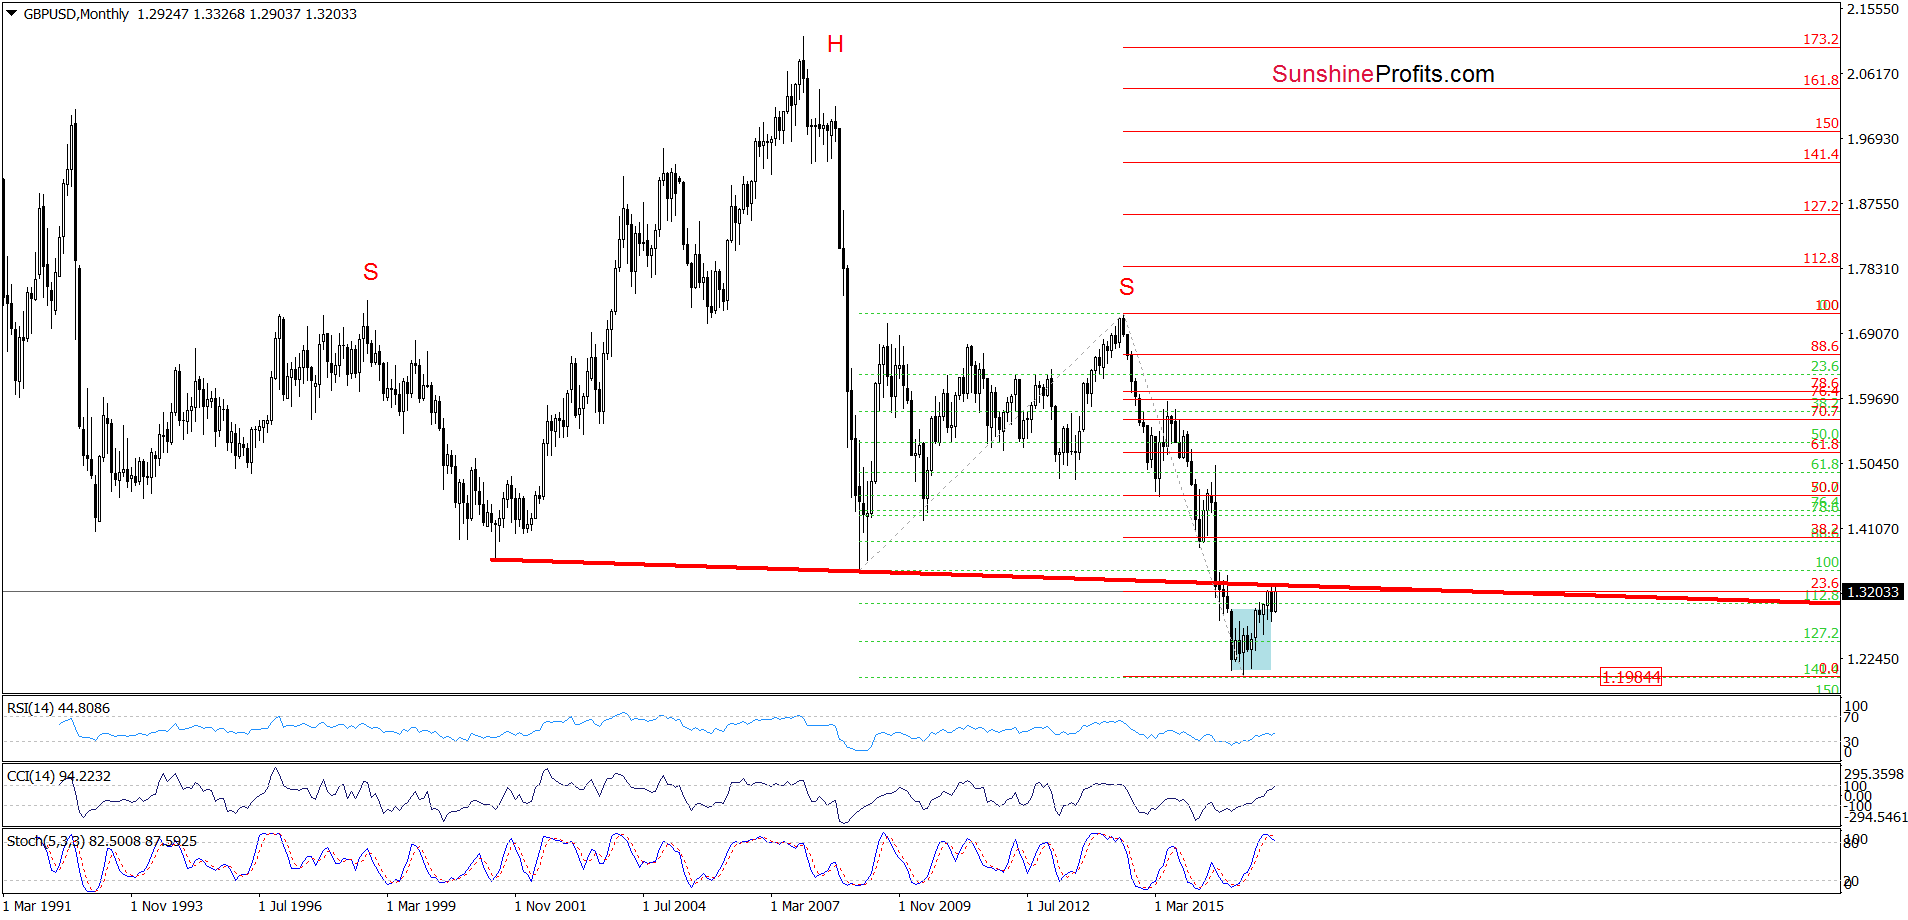
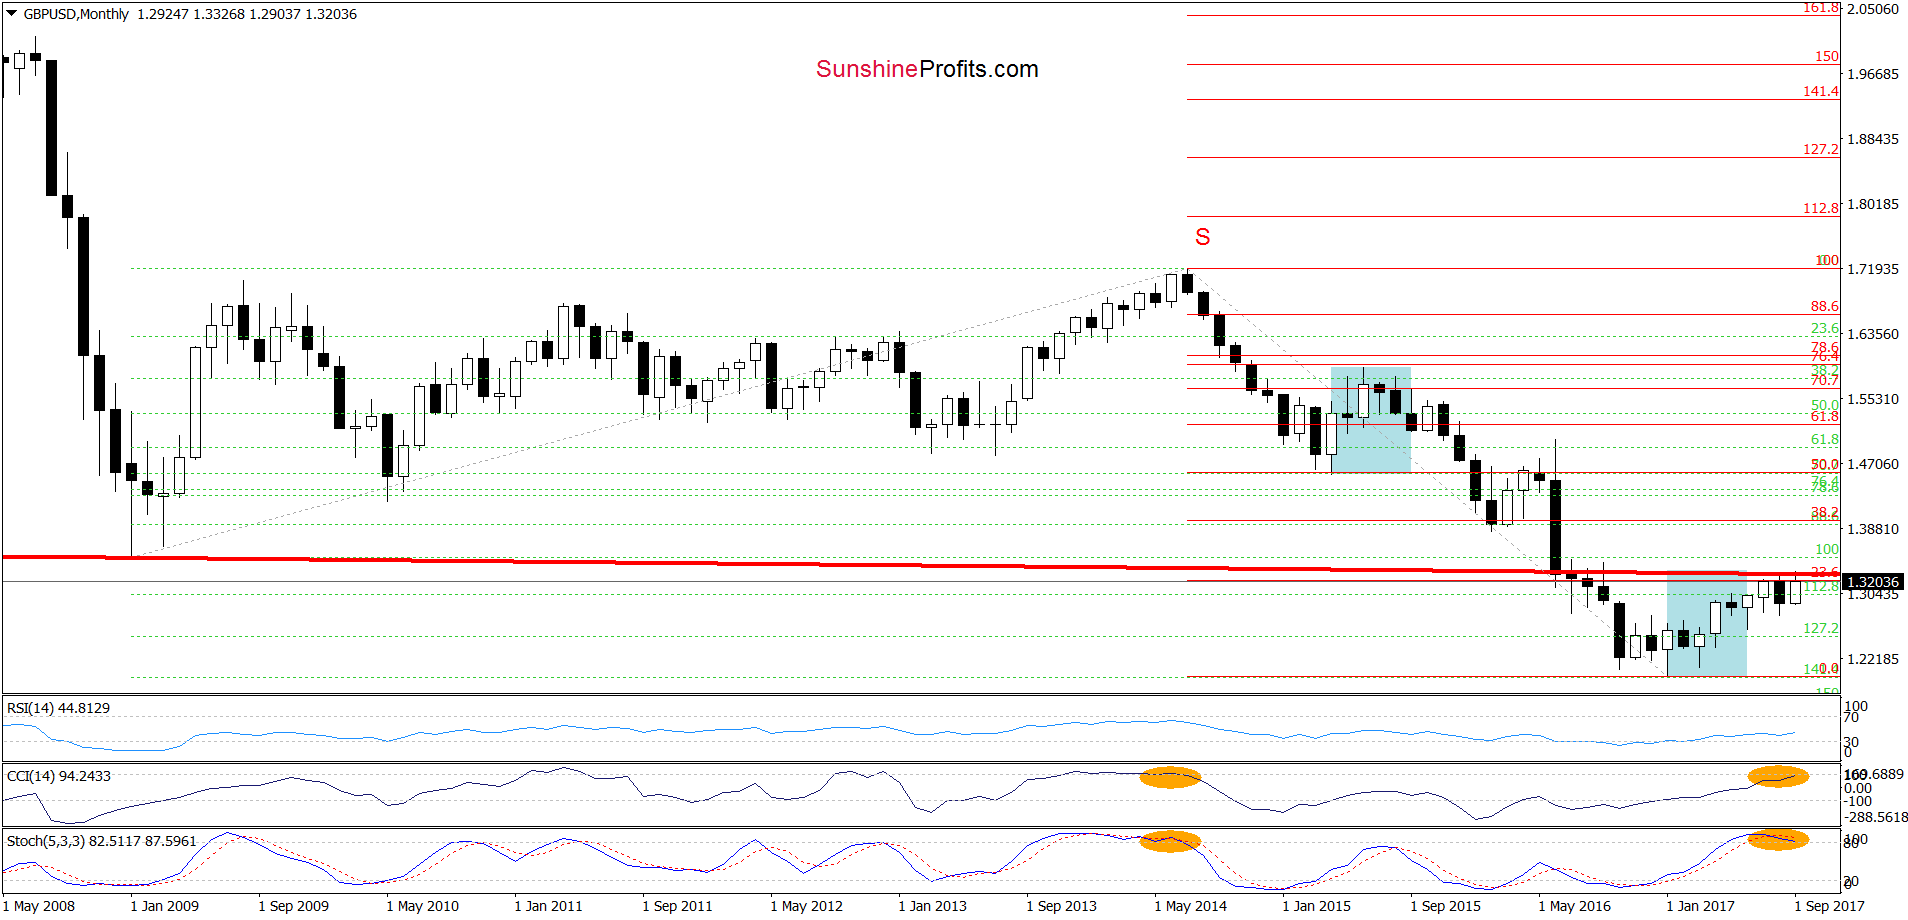
Looking at the monthly chart of GBP/USD, we see that the pair increased to the 23.6% Fibonacci retracement based on the entire July 2014-January 2017 downward move and the previously-broken neck line of the long-term head and shoulders formation once again. As you see the combination of these resistances was strong enough to stop currency bulls in the previous month, which suggest that reversal is just around the corner.
Additionally, the CCI and the Stochastic Oscillator increased to the highest levels since July 2014. Back then, such high readings of the indicators preceded sizable declines, which suggest that we may see similar price action in the following month(s).
On top of that, when we compare the size of blue corrections, we clearly see that they are almost equal, which means that currently currency bulls are not stronger than they were between April and June 2015. In our opinion, this fact also increases the probability of another attempt to move lower.
Are there any other negative factors on the horizon, which could encourage currency bears to act? Let’s examine the daily chart and find out.
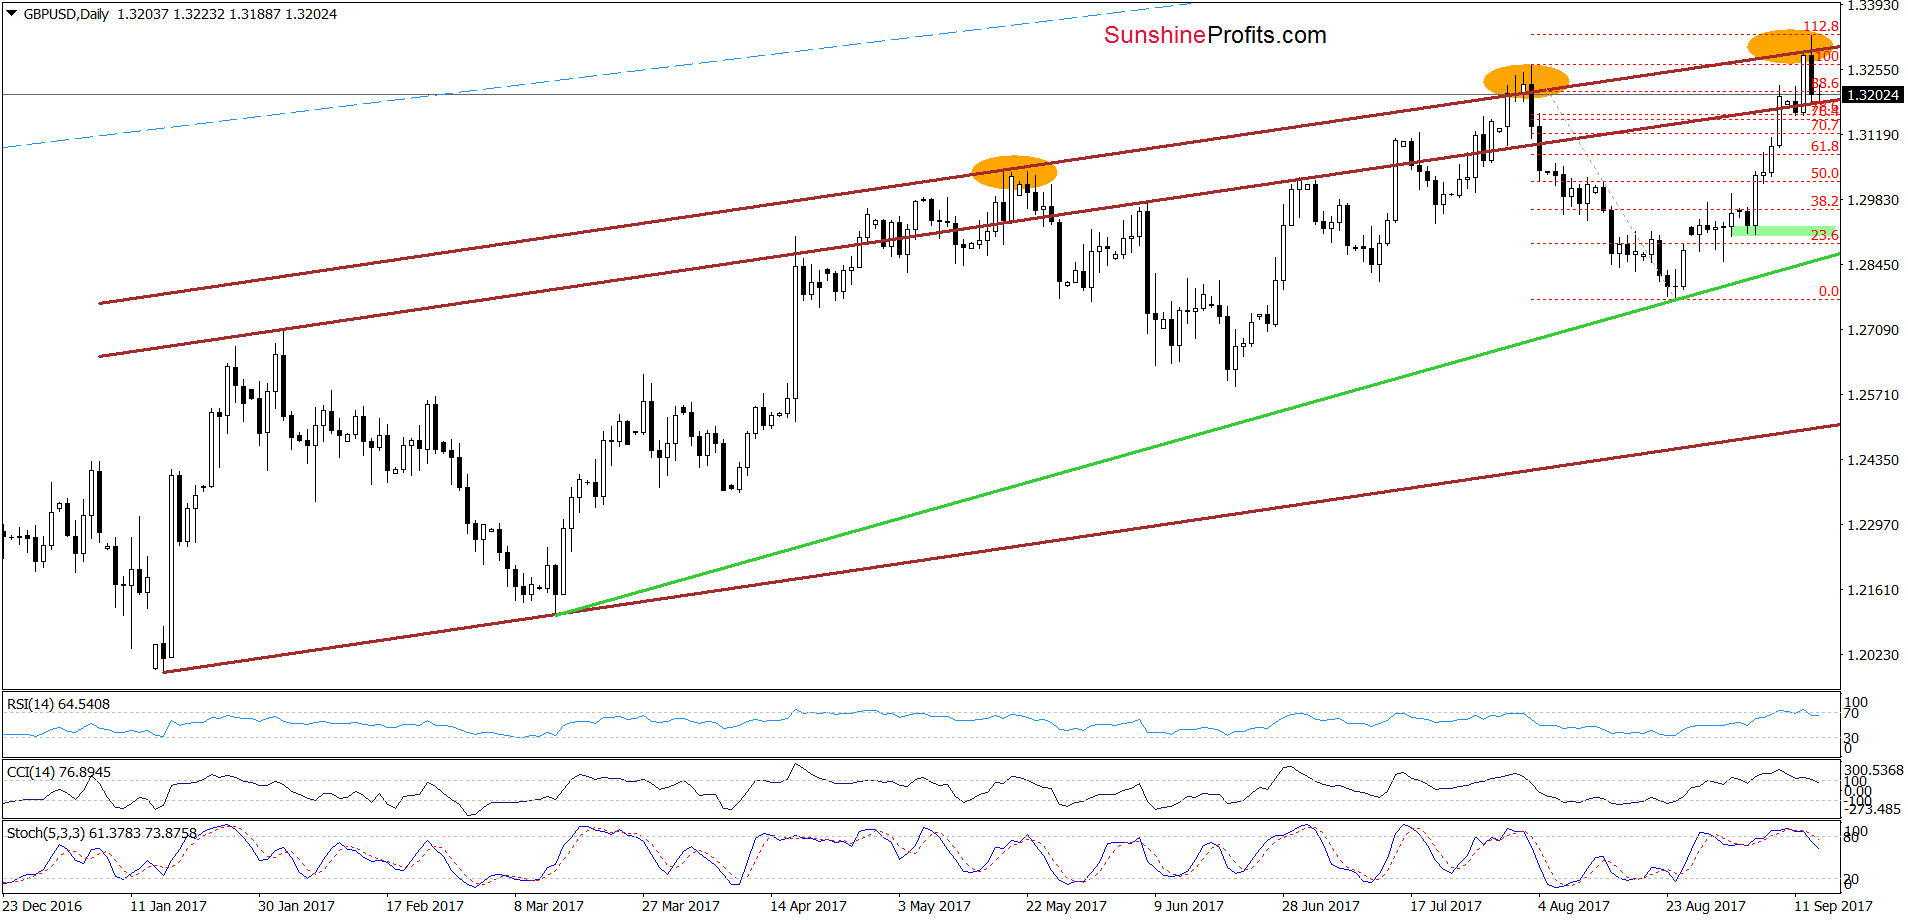
From the very short-term perspective, we see that GBP/USD increased to the upper brown resistance line (parallel to the upper border of the brown rising trend channel) once again. As you see this important resistance was strong enough to stop increases in May, August and also earlier this week, which suggests that we’ll see further deterioration in the coming days (similarly to what we saw in previous cases). Additionally, all daily indicators generated the sell signals, giving currency bears another reason to act.
How low could the pair go? In our opinion, if GBP/USD breaks below the upper border of the brown rising trend channel, we’ll see at least a drop to the green support line based on the mid-March and August lows in the following days.
Very short-term outlook: bearish
Short-term outlook: mixed with bearish bias
MT outlook: mixed with bearish bias
LT outlook: mixed
USD/CAD
On Tuesday, we wrote the following:
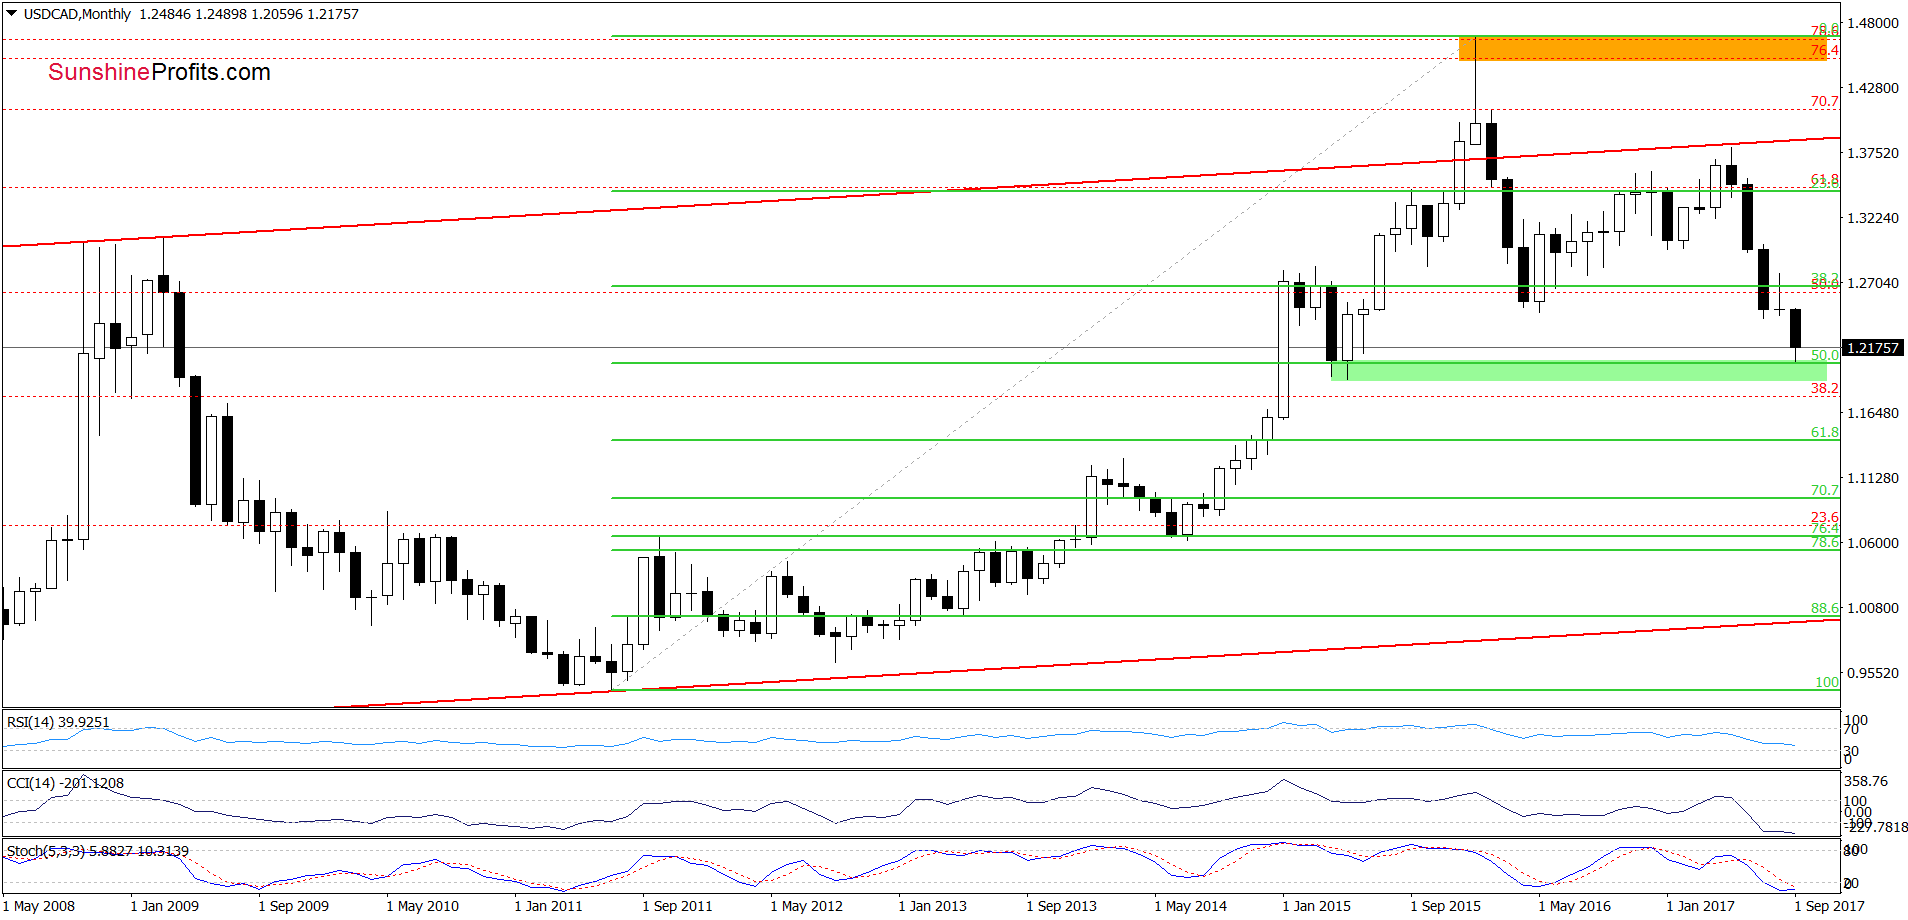
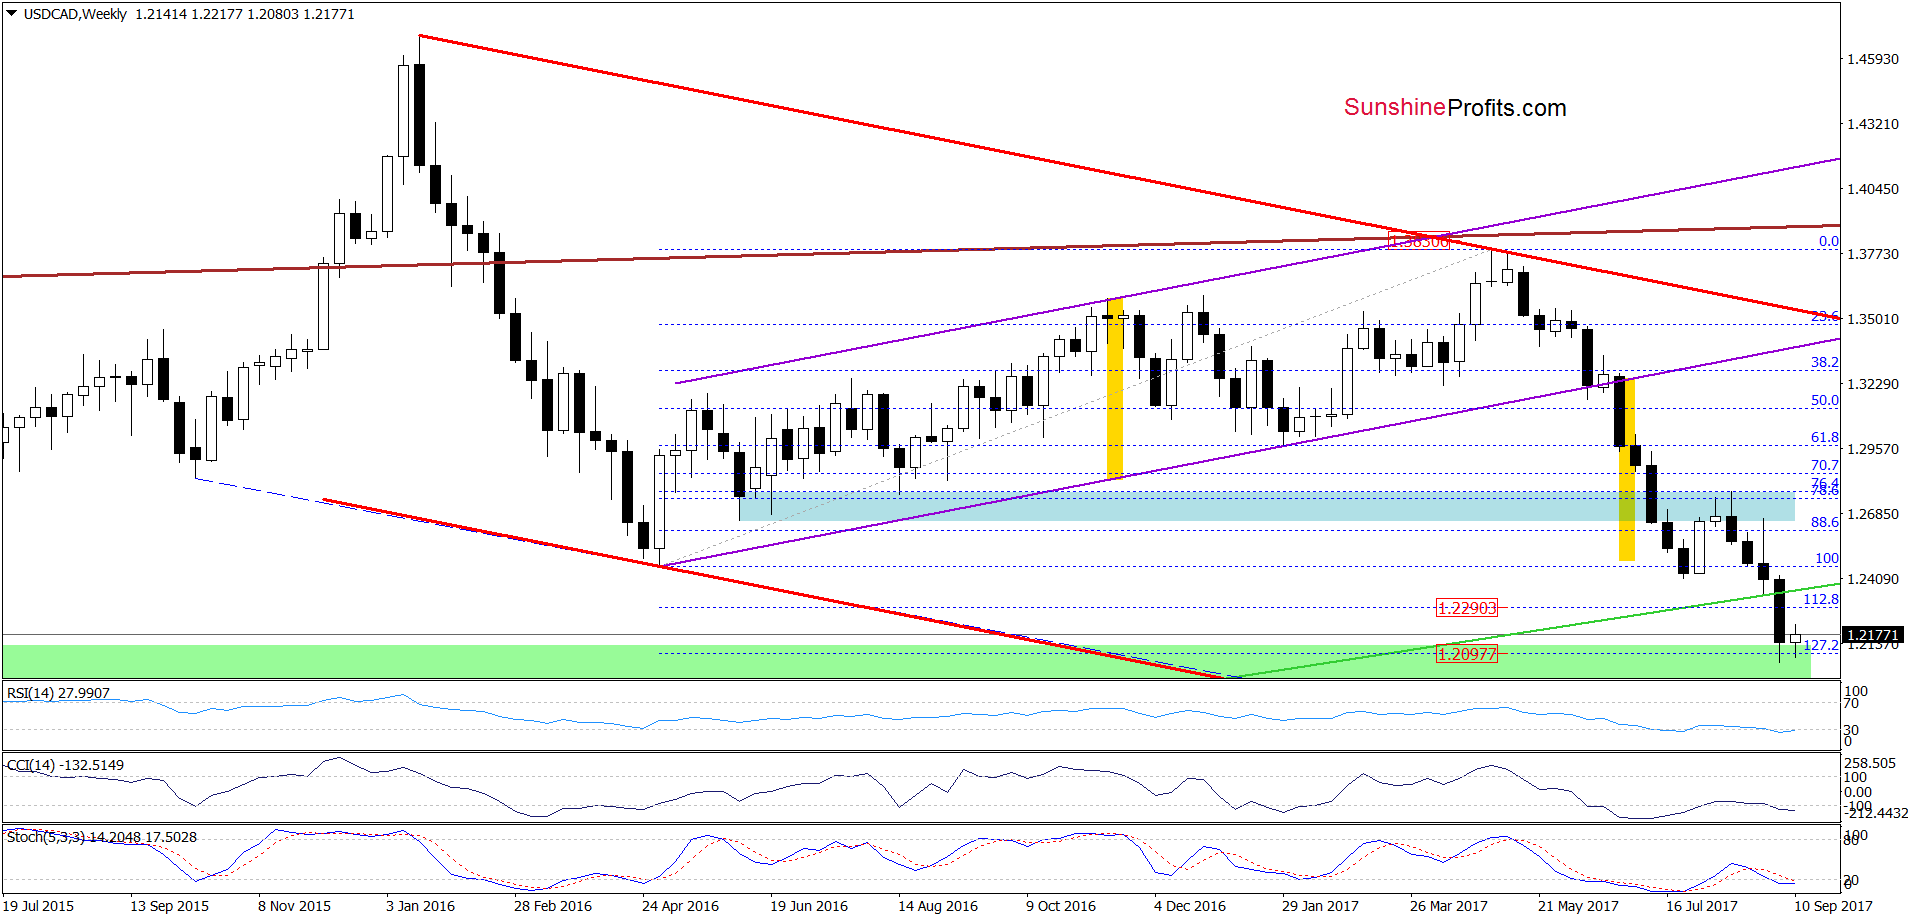
(…) although USD/CAD hit a fresh 2017 low in the previous week, the pair is still trading around the upper border of the green support zone (created by the 127.2% Fibonacci extension), which could stop currency bears in the coming week – especially when take into account the 50% Fibonacci retracement (based on the entire 2011-2016 upward move) marked on the long-term chart (…)
On the charts, we see that the above-mentioned support zone encouraged currency bulls to act (as we had expected), which resulted in a small (from the long- and medium-term perspective) rebound.
How did this move affect the very short-term picture of USD/CAD? Let’s check.
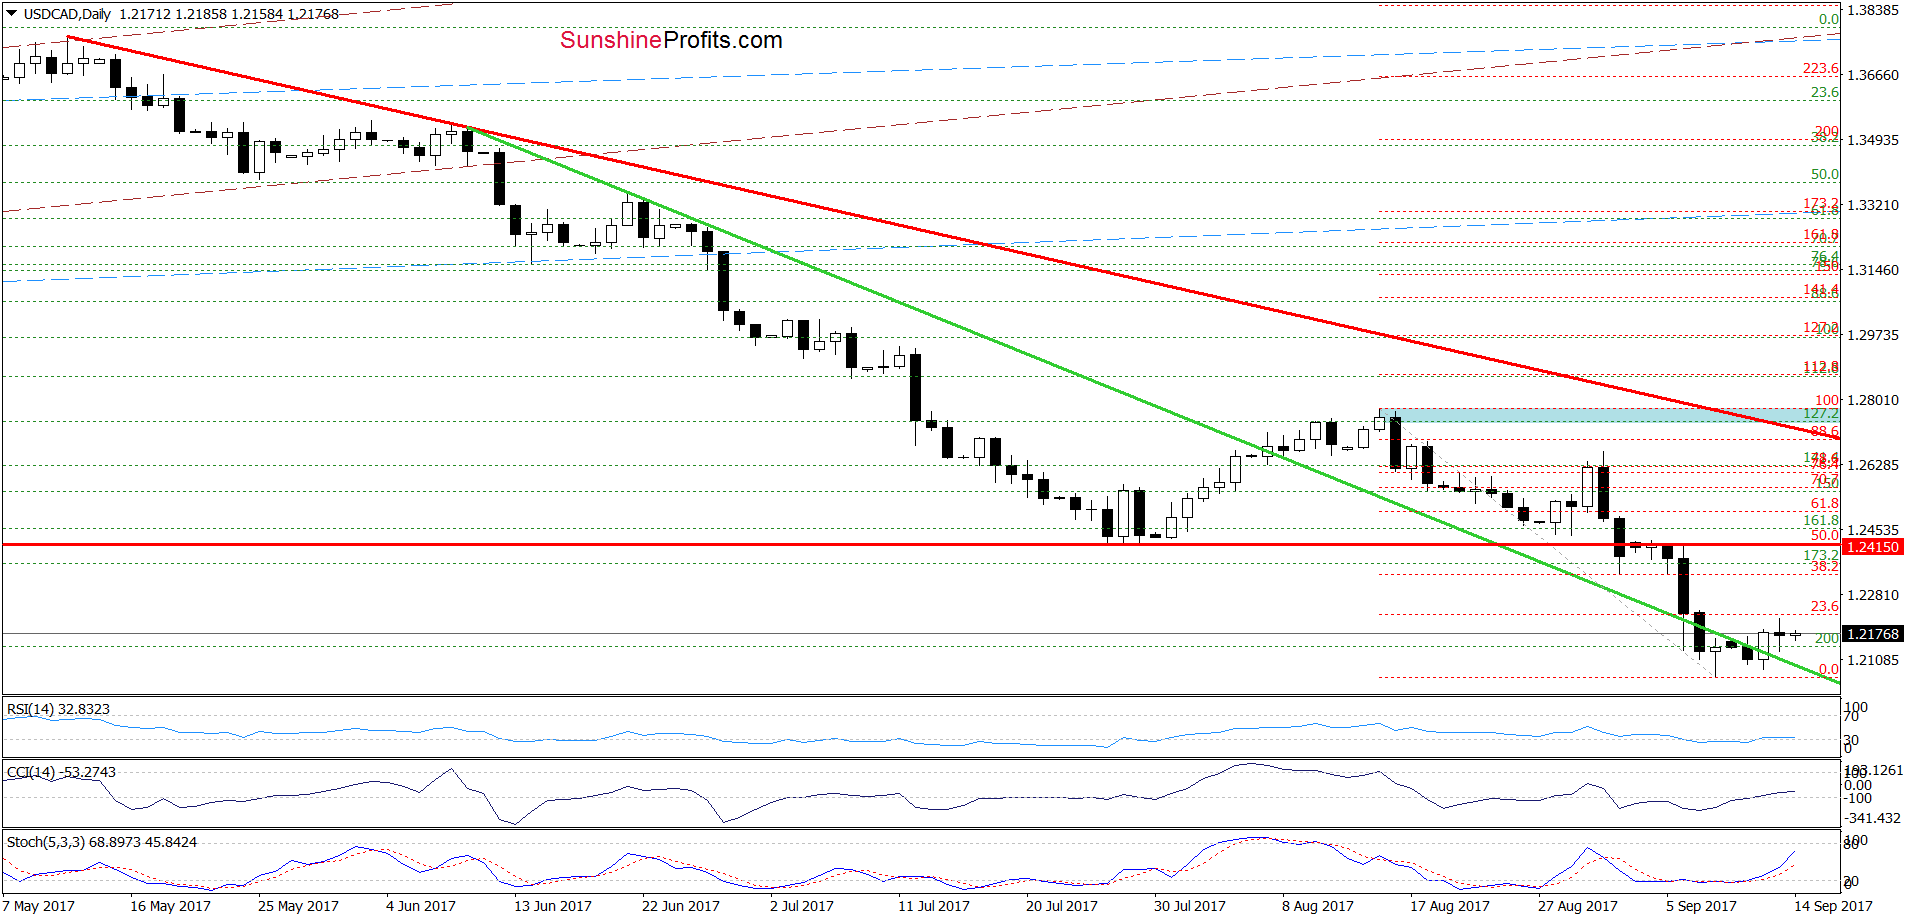
Looking at the daily chart, we see that USD/CAD climbed above the green support line and the 200% Fibonacci extension, invalidating the earlier breakdown. Additionally, the RSI, the CCI and the Stochastic Oscillator generated buy signals, suggesting further improvement.
If this is the case and the exchange rate extends gains from current levels, we’ll see an increase to the 38.2% Fibonacci retracement (based on the mid-August-September declines) or even to the red horizontal resistance line based on the July lows and the 50% retracement in the coming days.
Very short-term outlook: mixed with bullish bias
Short-term outlook: mixed with bullish bias
MT outlook: mixed
LT outlook: mixed
USD/CHF
Quoting our Tuesday alert:
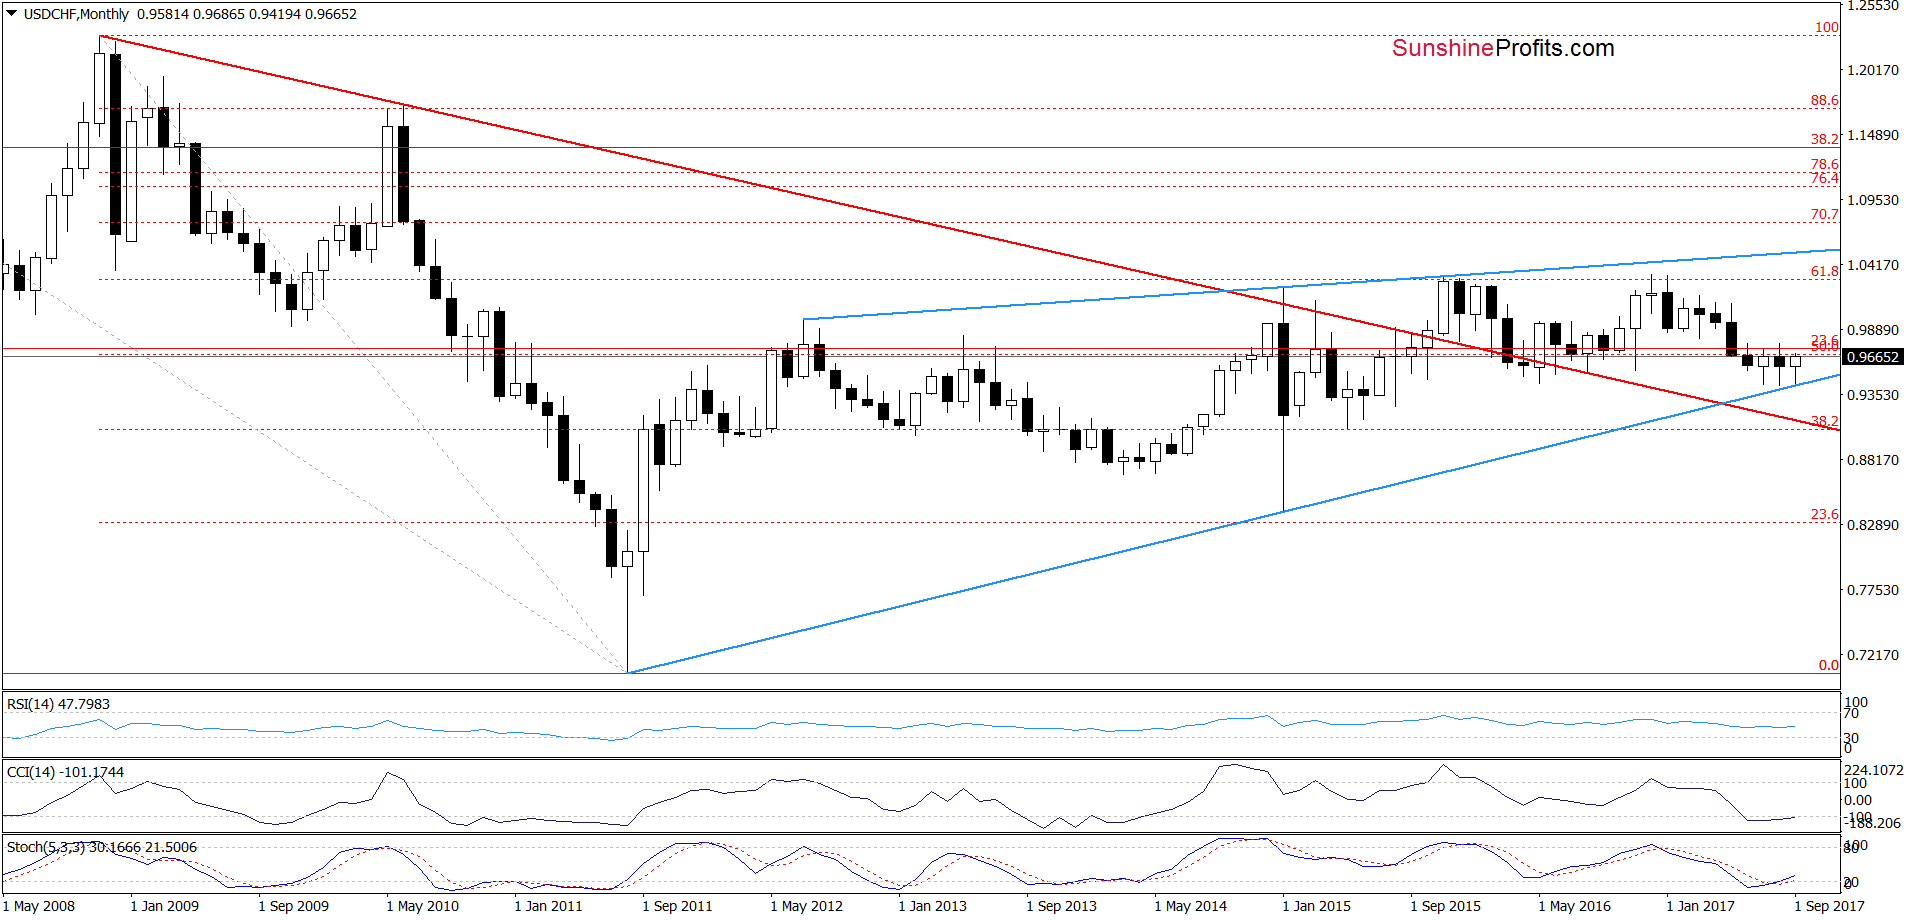
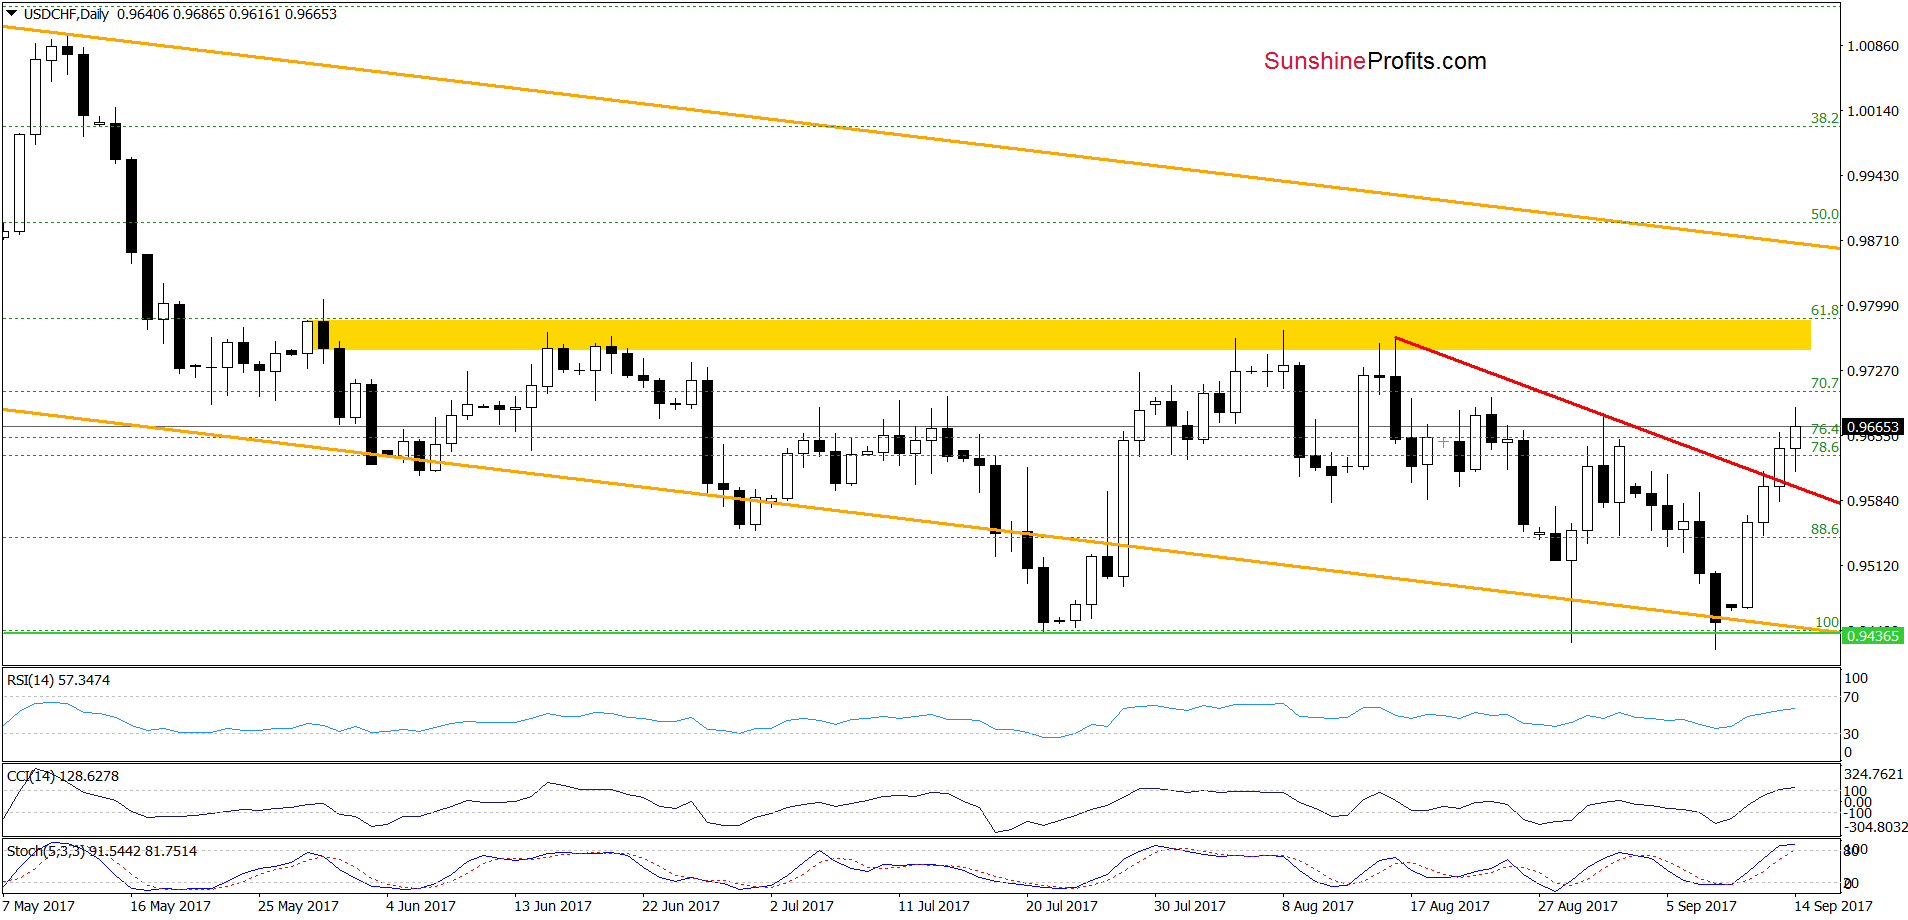
(…) USD/CHF bounced off the long-term blue rising support line seen on the monthly chart, invalidating the earlier small breakdown below the lower border of the orange declining trend channel. Taking this positive event into account and combining it with the buy signals generated by the daily (and even monthly) indicators, we think that further improvement is just around the corner. If this is the case and the pair increases from current levels, the initial upside target will be the yellow resistance zone seen on the daily chart (around 0.9751-0.9781).
From today’s point of view, we see that USD/CHF broke above the red declining resistance line based on the previous highs, which together with buy signals generated by the indictors (they are still in play) suggests that we’ll see realization of our Tuesday scenario in the coming days.
Very short-term outlook: mixed with bullish bias
Short-term outlook: mixed with bullish bias
MT outlook: mixed
LT outlook: mixed
Naturally, the above could change in the coming days and we’ll keep our subscribers informed, but that’s what appears likely based on the data that we have right now. If you enjoyed reading our analysis, we encourage you to subscribe to our daily Forex Trading Alerts.
Thank you.
Nadia Simmons
Forex & Oil Trading Strategist
Przemyslaw Radomski, CFA
Founder, Editor-in-chief, Gold & Silver Fund Manager
Gold & Silver Trading Alerts
Forex Trading Alerts
Oil Investment Updates
Oil Trading Alerts
